 Qazi Forex Tips
Regular divergence ki accuracy kam kyun hoti hai, aur is se best results kaise lein?

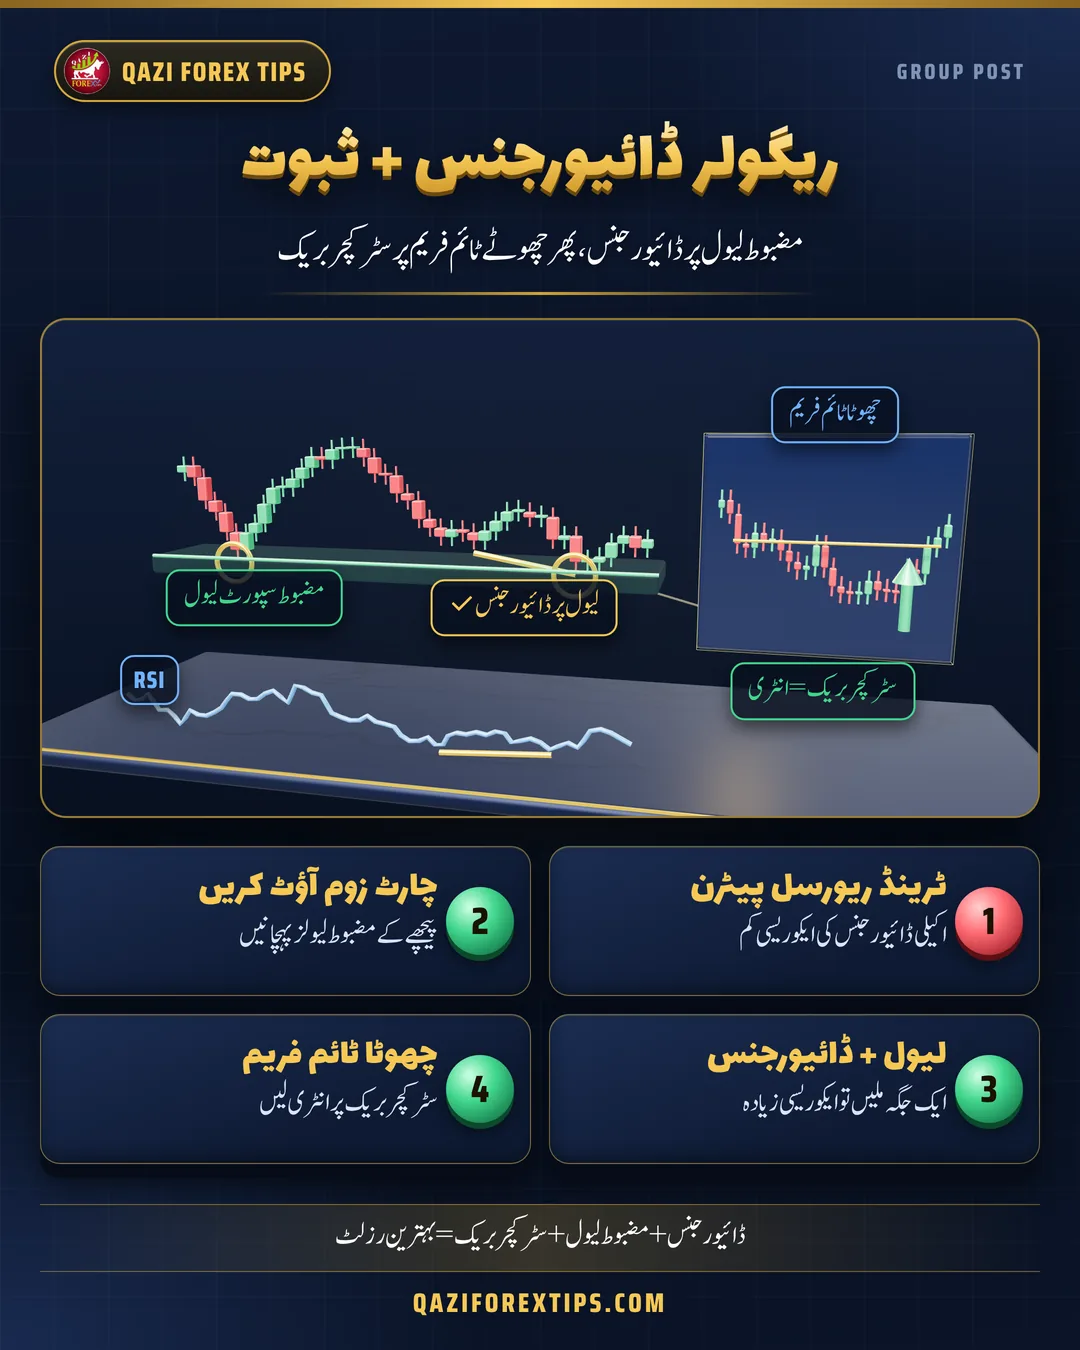
ریگولر ڈائیورجنس سے بہترین رزلٹ کیسے لیں
یاد رکھیں، ریگولر ڈائیورجنس ایک ٹرینڈ ریورسل پیٹرن ہے۔ یہ بتاتی ہے کہ موجودہ ٹرینڈ کا momentum کمزور ہو رہا ہے اور مارکیٹ ریورس ہو سکتی ہے۔ لیکن اگر آپ صرف ڈائیورجنس دیکھ کر انٹری لیں گے تو اس کی ایکوریسی تھوڑی کم ہو گی، کیونکہ ٹرینڈ میں ڈائیورجنس بار بار بنتی ہے اور مارکیٹ پھر بھی اسی سمت چلتی رہتی ہے۔
ہاں، اگر اس کے ساتھ ثبوت (evidence) شامل کر لیے جائیں تو پھر بہترین رزلٹ مل سکتے ہیں۔ اس سے بہترین رزلٹ لینے کے لیے یہ کریں:
1۔ پہلے چارٹ زوم آؤٹ کریں تاکہ پورا پکچر سامنے آئے۔
2۔ پھر مضبوط لیولز identify کریں: پیچھے کے بڑے ٹاپ، باٹم، سپورٹ اور ریزسٹنس۔
3۔ اگر پیچھے کوئی مضبوط لیول ہے، مارکیٹ اب اسی لیول پر موجود ہے اور یہیں آپ کو ڈائیورجنس ملتی ہے، تو اس کے بہترین رزلٹ ملیں گے اور ایکوریسی بھی زیادہ ہو گی۔
4۔ انٹری کے لیے چھوٹے ٹائم فریم کا سٹرکچر بھی ساتھ شامل کر لیں، یعنی وہاں سٹرکچر بریک ہونے کا انتظار کریں، تو بہت ہی بہترین رزلٹ ملیں گے۔
یعنی ڈائیورجنس + مضبوط لیول + چھوٹے ٹائم فریم کا سٹرکچر۔ تینوں ثبوت ایک جگہ جمع ہوں تو ٹریڈ پلان کریں، ورنہ انتظار کریں۔
What regular divergence tells you
A regular bullish divergence is when price makes a lower low but RSI makes a higher low. A regular bearish divergence is when price makes a higher high but RSI makes a lower high. Both say the same thing: the current trend is losing momentum and may reverse. That is why regular divergence is a trend reversal pattern. (Hidden divergence is different: it points to trend continuation. See hidden divergence.) The basics are in RSI divergence explained.
Why its accuracy is low on its own
Momentum can slow down many times inside a strong trend. In a falling market you will often see two or three bullish divergences in a row while price keeps making new lows. Each one looked like a reversal, and each one stopped out the trader who bought it alone. Divergence answers "is momentum weakening?", not "is the trend over?".
Evidence 1: a strong level from the zoomed-out chart
- Zoom out on H4 or Daily so you can see the whole picture, not only the last few swings.
- Mark the strong levels: older major highs and lows where price turned sharply before, support and resistance that held more than once. See support and resistance and types of levels.
- Take divergence only at those levels. If there is a strong level behind, price is sitting on it now, and the divergence forms right there, you have two independent reasons for a reversal. That is where divergence gives its best results and its accuracy is higher.
Evidence 2: the lower timeframe structure for the entry
Even at a strong level, do not enter on the divergence candle. Drop to a lower timeframe (M15 if the setup is on H4, M5 if it is on H1) and wait for the structure to break: for a buy, a candle body closes above the last lower high; for a sell, below the last higher low. That break shows the reversal has started. Enter on the break or its retest, with the stop beyond the divergence low or high. More on this in BOS vs CHoCH and why divergence needs confirmation.
| What you see | What to do |
|---|---|
| Divergence in the middle of nowhere | Skip it. It is only a warning. |
| Divergence on a strong level | Mark it and watch. Do not enter yet. |
| Divergence on a strong level + lower timeframe structure break | Plan the trade: entry on the break or retest, stop beyond the divergence swing, target at the next level. |
A worked example
Gold on H4 falls to a level where price bounced strongly two months earlier. At that level price makes a lower low while RSI makes a higher low: bullish divergence on a strong support. On M15 price is still making lower highs, so you wait. A few hours later an M15 candle closes above the last lower high. You buy on the retest of that broken high, the stop goes below the divergence low, and the first target is the nearest H4 resistance. If the M15 structure never breaks, there is no trade, and that is fine.
For a bearish version of the same idea, at a previous top, read divergence at a double top on resistance.
Test it on your own charts
Find 20 to 30 regular divergences in backtesting and split them into three groups: alone, on a strong level, and on a strong level with a lower timeframe structure break. Your own numbers will show the difference. Replay past days in the QFT Replay Simulator, or follow how to backtest in 4 steps.
Khulasa (Roman Urdu / Hindi)
- Regular divergence trend reversal pattern hai; akeli ho to accuracy kam.
- Chart zoom out karein aur peeche ke mazboot levels mark karein.
- Price mazboot level par ho aur wahin divergence bane to accuracy zyada.
- Entry ke liye chhote time frame par structure break ka intezar.
- Divergence + level + structure: teeno hon to trade plan, warna intezar.
Questions
Is regular divergence a reversal or continuation pattern?
Regular divergence is a trend reversal pattern. Hidden divergence is the one that points to continuation.
Why does regular divergence fail so often?
Momentum can weaken many times inside a strong trend, so several divergences can form while price keeps going. On its own it is only a warning.
How do I improve divergence accuracy?
Take it only at a strong level from the zoomed-out chart, and enter after the lower timeframe structure breaks.
Which lower timeframe should I use for the entry?
Roughly one step down: M15 for an H4 setup, M5 for an H1 setup.
اکثر پوچھے جانے والے سوال
ریگولر ڈائیورجنس کیا بتاتی ہے؟
یہ ٹرینڈ ریورسل پیٹرن ہے، یعنی موجودہ ٹرینڈ کا momentum کمزور ہو رہا ہے۔
ایکوریسی کیسے بڑھائیں؟
مضبوط لیول پر ڈائیورجنس لیں اور چھوٹے ٹائم فریم پر سٹرکچر بریک کا انتظار کریں۔
Aksar Pooche Jane Wale Sawal (Roman Urdu / Hindi)
Regular divergence akeli kaafi hai?
Nahi, strong level aur chhote time frame ka structure saath milayein.
Entry kab?
Chhote time frame par structure break ke baad.
Learn more
- RSI divergence explained
- Hidden divergence
- Divergence at a double top on resistance
- Why divergence needs confirmation
Have a question of your own, or a chart you want checked? Post it with your reasoning in our free Facebook group.
Join the free groupEducation only, not financial advice. Trading forex, Gold and CFDs carries a high risk of loss. Spreads, leverage and contract sizes differ by broker; check your own broker's specifications.