 Qazi Forex Tips
Kis kis level pr kitni Liquidaty parhi ha ya kis indicator sa pta chlta ha.

لیکوئیڈیٹی کس انڈیکیٹر سے پتا چلتی ہے؟
جی بھائی، فاریکس میں کوئی بھی انڈیکیٹر صحیح نہیں بتا سکتا کہ کس لیول پر کتنی لیکوئیڈیٹی پڑی ہے، کیونکہ یہ مارکیٹ کسی ایک ایکسچینج پر نہیں چلتی اور اصل آرڈرز کا ڈیٹا کسی کے پاس نہیں ہوتا۔ لکس الگو یا ہیٹ میپ جیسے انڈیکیٹر صرف اندازہ لگاتے ہیں۔
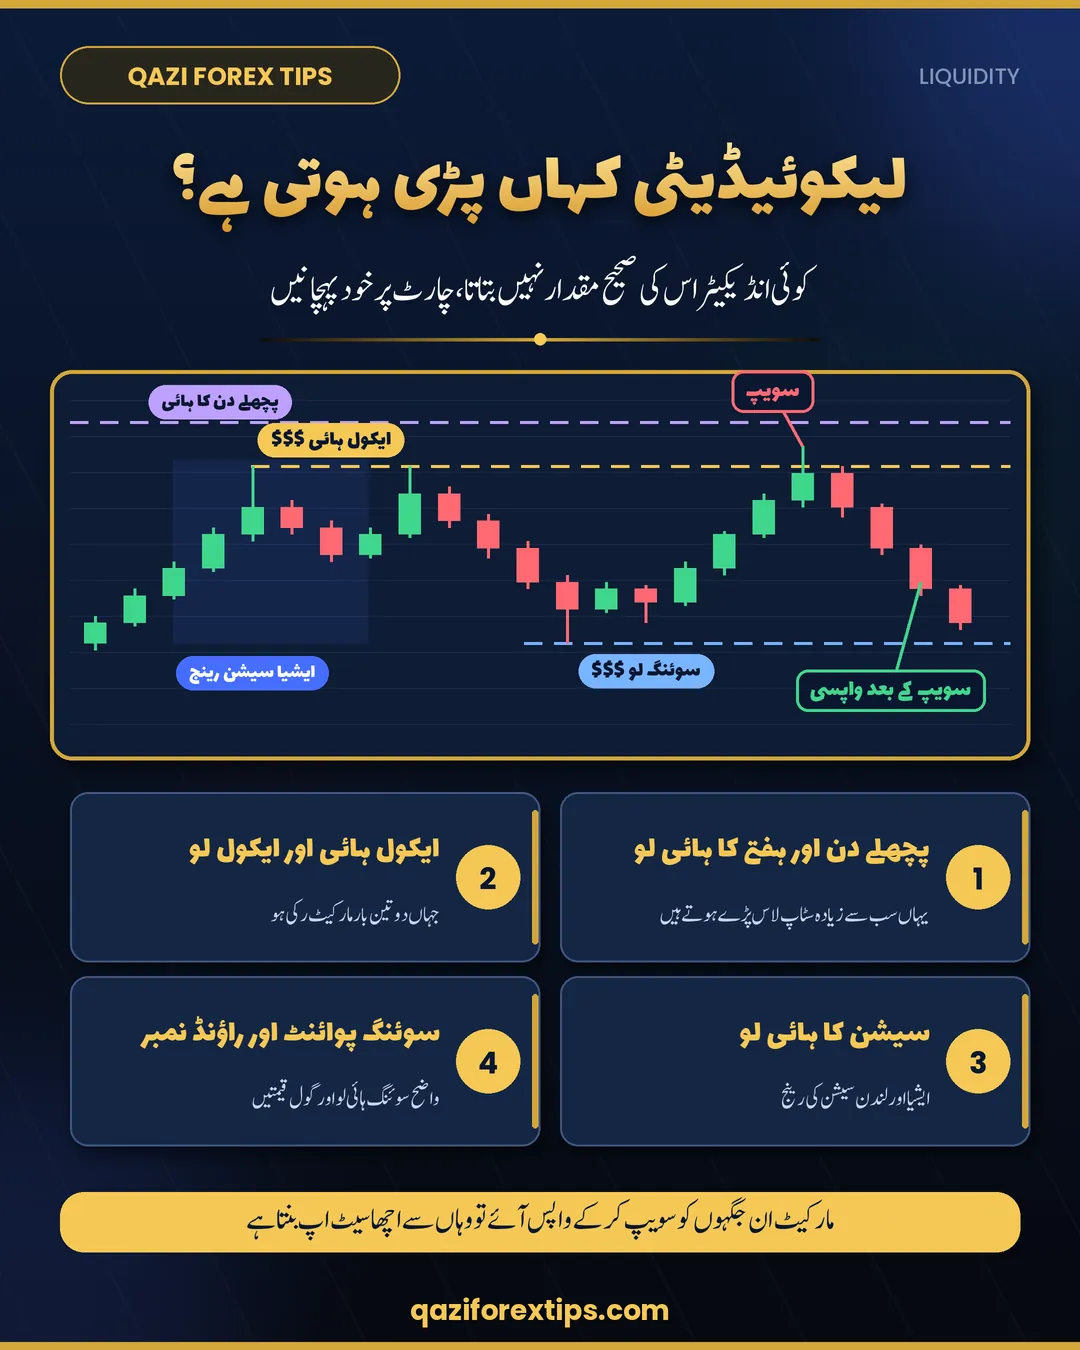
لیکوئیڈیٹی کو چارٹ پر خود پہچانیں، یہ عام طور پر ان جگہوں پر ہوتی ہے:
1۔ پچھلے دن اور پچھلے ہفتے کا ہائی اور لو۔
2۔ ایکول ہائی اور ایکول لو، جہاں دو یا تین بار مارکیٹ رکی ہو۔
3۔ ایشیا یا لندن سیشن کا ہائی لو۔
4۔ واضح سوئنگ ہائی لو اور راؤنڈ نمبر۔
ان جگہوں کے پیچھے لوگوں کے سٹاپ لاس پڑے ہوتے ہیں۔ جب مارکیٹ ان کو سویپ کر کے واپس آئے تو وہاں سے اچھا سیٹ اپ بنتا ہے۔
Why no indicator can measure liquidity in forex
Spot forex is an over-the-counter market. There is no single exchange and no central order book, so no one can see every pending order and stop loss sitting at a price. Your broker only sees its own clients, and the volume on your MT5 chart is tick volume (how many times the price changed), not the money that traded.
That is why "liquidity" indicators can only estimate. Most of them simply draw lines at swing highs and lows, equal highs and lows or the previous day's range, which you can mark yourself. Heatmaps that show resting orders come from exchange order books (crypto exchanges or futures such as CME). They show orders on that one exchange only, not the whole forex market.
Where liquidity actually sits
Liquidity, in the trading sense, is a cluster of orders: mostly stop losses and breakout orders. Traders put them in the same obvious places, so you can find them on the chart without any indicator.
| Place on the chart | Whose orders sit there |
|---|---|
| Previous day and previous week high and low | Stops of traders who sold or bought the range, and breakout entries |
| Equal highs and equal lows (double tops and bottoms) | Stops placed just beyond a level that held two or three times |
| Asia and London session high and low | Stops from the overnight range, often swept in London or New York |
| Clear swing highs and lows | Stops of traders who entered on the last swing |
| Round numbers (e.g. 1.1000 or 2,400 on Gold) | Pending orders and take profits that cluster on easy prices |
More detail on the concept is in what is liquidity in forex. For the session ranges, our free ICT Killzones indicator draws each session as a box with its high and low, so the Asia and London levels are marked for you.
Is there liquidity in an FVG, an order block or near a mitigation block?
A member asked this in the group after the answer above. The short answer: yes, these zones attract price, but they are not the same thing as a stop-loss pool, and no tool tells you how many orders are waiting there.
- Above or below a wick (swing high or low): the strongest liquidity. Buyers' stops sit above a swing high and sellers' stops below a swing low.
- Equal highs and equal lows: where price turned two or three times from one level, the most stops pile up.
- Daily or weekly order block: price reacts here because of pending orders, which is why a higher timeframe order block matters more than a 5 minute one.
- Fair value gap (FVG): this is an imbalance rather than a stop pool. Price often comes back to fill it, but not every FVG is a valid entry.
- Near a mitigation order block: if equal lows or an obvious wick sit just before the block, price often sweeps that first and then reacts from the block.
The edge is in the sequence: a sweep of the obvious liquidity, then a structure break on the lower timeframe, then the entry. Do not enter only because a zone "has liquidity". The full order block checklist is in how to make a trade plan on an order block.
How to use it: wait for the sweep
- Mark the levels before the session: previous day high and low, Asia range, any equal highs or lows.
- Wait for price to sweep one: a wick goes beyond the level and takes the stops.
- Look for the return: the candle closes back inside the range, ideally followed by a shift in structure on a lower timeframe.
- Enter on the return, with the stop beyond the sweep wick and the target at the liquidity on the other side.
If price breaks the level and keeps closing beyond it, that was not a sweep but a real breakout. Do not fight it.
What about LuxAlgo and other liquidity tools?
They can save time by drawing the lines for you, and that is fine. Just remember they mark the same places listed above. They do not know how much money is waiting there, and a line on the chart is not a reason to trade. Decide with price action at the level.
Khulasa (Roman Urdu / Hindi)
- Forex mein koi indicator nahi bata sakta ke kis level par kitni liquidity padi hai, kyunke market kisi ek exchange par nahi chalti.
- LuxAlgo ya heatmap jaise indicators sirf andaza lagate hain; MT5 ka volume tick volume hota hai, asli paisa nahi.
- Liquidity in jagahon par hoti hai: pichhle din aur hafte ka high low, equal highs aur lows, Asia aur London session ka high low, swing points aur round numbers.
- In jagahon ke peeche logon ke stop loss pade hote hain.
- Market sweep kar ke wapas range mein close kare to wahan se achha setup banta hai; SL sweep wick ke paar.
Questions
Is there an indicator that shows liquidity in forex?
No indicator can measure how much liquidity sits at a level in spot forex, because there is no central order book. Liquidity tools only mark likely places such as swing highs and lows and equal highs and lows.
Where does liquidity sit in forex?
Above and below previous day and week highs and lows, equal highs and lows, session highs and lows, clear swing points and round numbers, where traders place stop losses.
What is a liquidity sweep?
Price moves just beyond a level where stops sit, takes them, and then closes back inside the range. The return after a sweep often gives a good setup.
Does a liquidity heatmap work for forex?
Heatmaps come from exchange order books, so for forex they show only one exchange or futures market, not the whole market. Use them as a rough guide at most.
اکثر پوچھے جانے والے سوال
لیکوئیڈیٹی کس انڈیکیٹر سے پتا چلتی ہے؟
فاریکس میں کوئی انڈیکیٹر لیکوئیڈیٹی کی صحیح مقدار نہیں بتا سکتا۔ انڈیکیٹر صرف اندازہ لگاتے ہیں، اس لیے اسے چارٹ پر خود پہچانیں۔
لیکوئیڈیٹی کہاں ہوتی ہے؟
پچھلے دن اور ہفتے کے ہائی لو، ایکول ہائی اور ایکول لو، سیشن کے ہائی لو، سوئنگ پوائنٹس اور راؤنڈ نمبرز کے پیچھے۔
لیکوئیڈیٹی سویپ کے بعد کیا کریں؟
اگر کینڈل واپس رینج کے اندر کلوز ہو تو چھوٹے ٹائم فریم پر کنفرمیشن لے کر انٹری لیں، سٹاپ لاس سویپ والی وک کے پار۔
Aksar Pooche Jane Wale Sawal (Roman Urdu / Hindi)
Liquidity kis indicator se pata chalti hai?
Forex mein koi indicator iski sahi miqdar nahi bata sakta. Chart par khud pehchanein: previous day high low, equal highs lows aur session ki range.
LuxAlgo liquidity indicator sahi hai?
Yeh lines lagane mein waqt bachata hai, lekin wohi jagahen mark karta hai jo aap khud kar sakte hain. Is ki line trade ki wajah nahi.
Liquidity sweep kaise pehchanein?
Wick level ke paar jaye aur candle wapas range ke andar close ho. Agar candles level ke paar close hoti rahen to wo breakout hai, sweep nahi.
Learn more
- What is liquidity in forex? Liquidity sweeps explained
- SMC course lesson 2.1: BSL and SSL (Urdu) · English
- Liquidity sweep vs break (Urdu) · English
- Free ICT Killzones indicator (session highs and lows)
- Forex trading sessions in Pakistan and India time
- Smart money concepts explained
- Order block trade plan: 4 checks
- Herd mentality: why the crowd's stops get hit
Have a question of your own, or a chart you want checked? Post it with your reasoning in our free Facebook group.
Join the free groupEducation only, not financial advice. Trading forex, Gold and CFDs carries a high risk of loss. Spreads, leverage and contract sizes differ by broker; check your own broker's specifications.