 Qazi Forex Tips

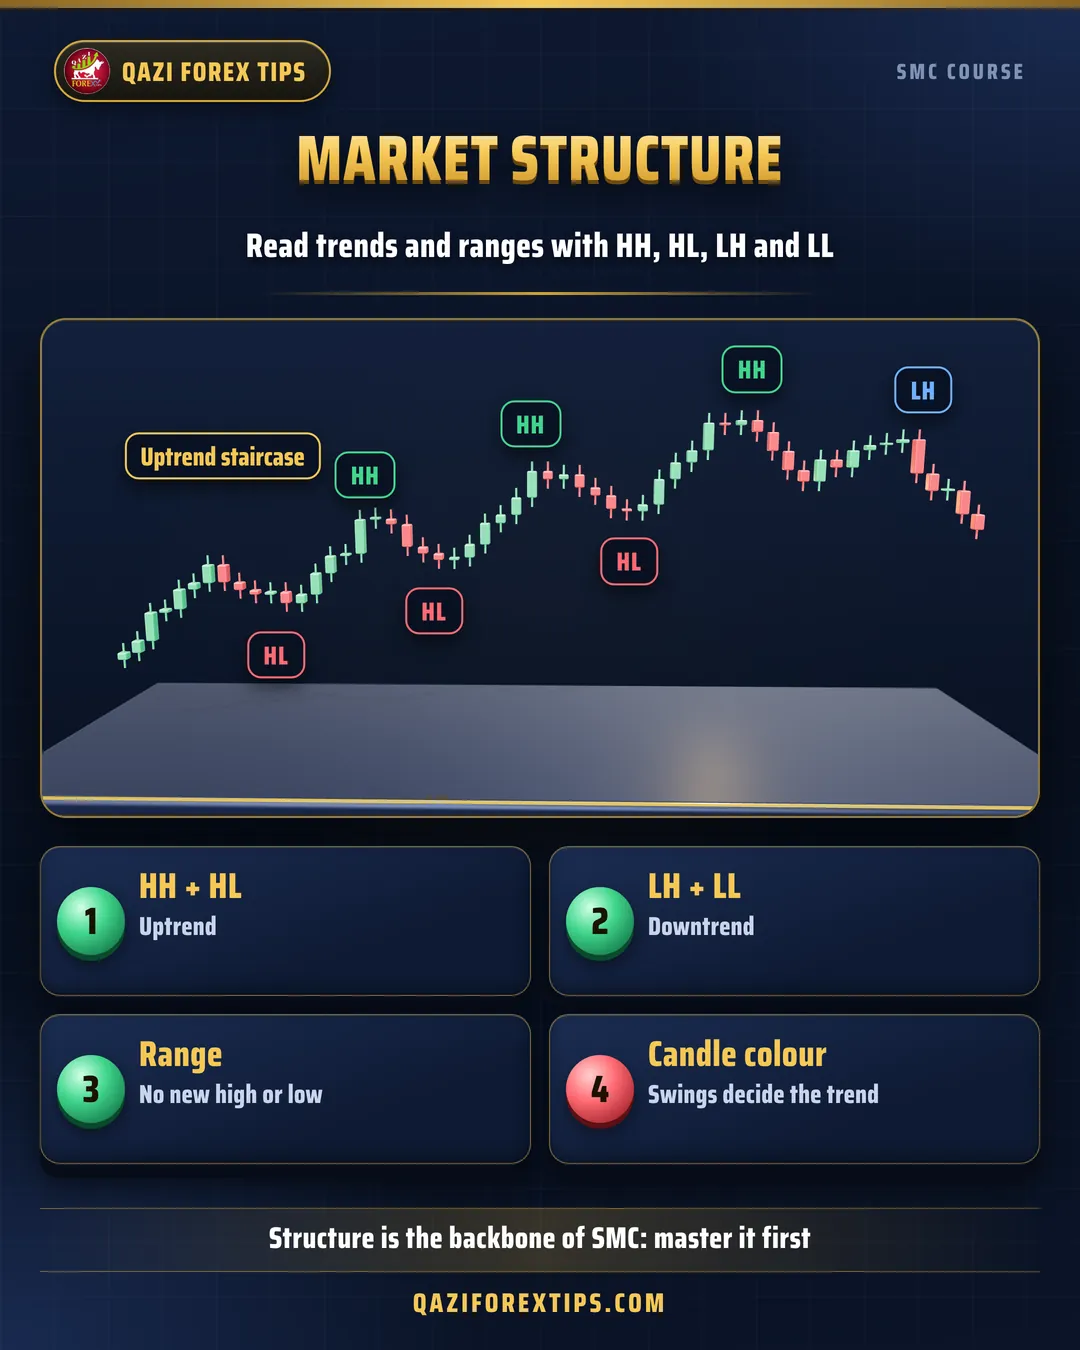
The four names that make up structure
In the previous lesson you learned to mark swing highs and lows. Now name each swing by comparing it with the previous swing of the same kind:
| Name | Full name | Meaning |
|---|---|---|
| HH | Higher High | The new high is above the previous high |
| HL | Higher Low | The new low is above the previous low |
| LH | Lower High | The new high is below the previous high |
| LL | Lower Low | The new low is below the previous low |
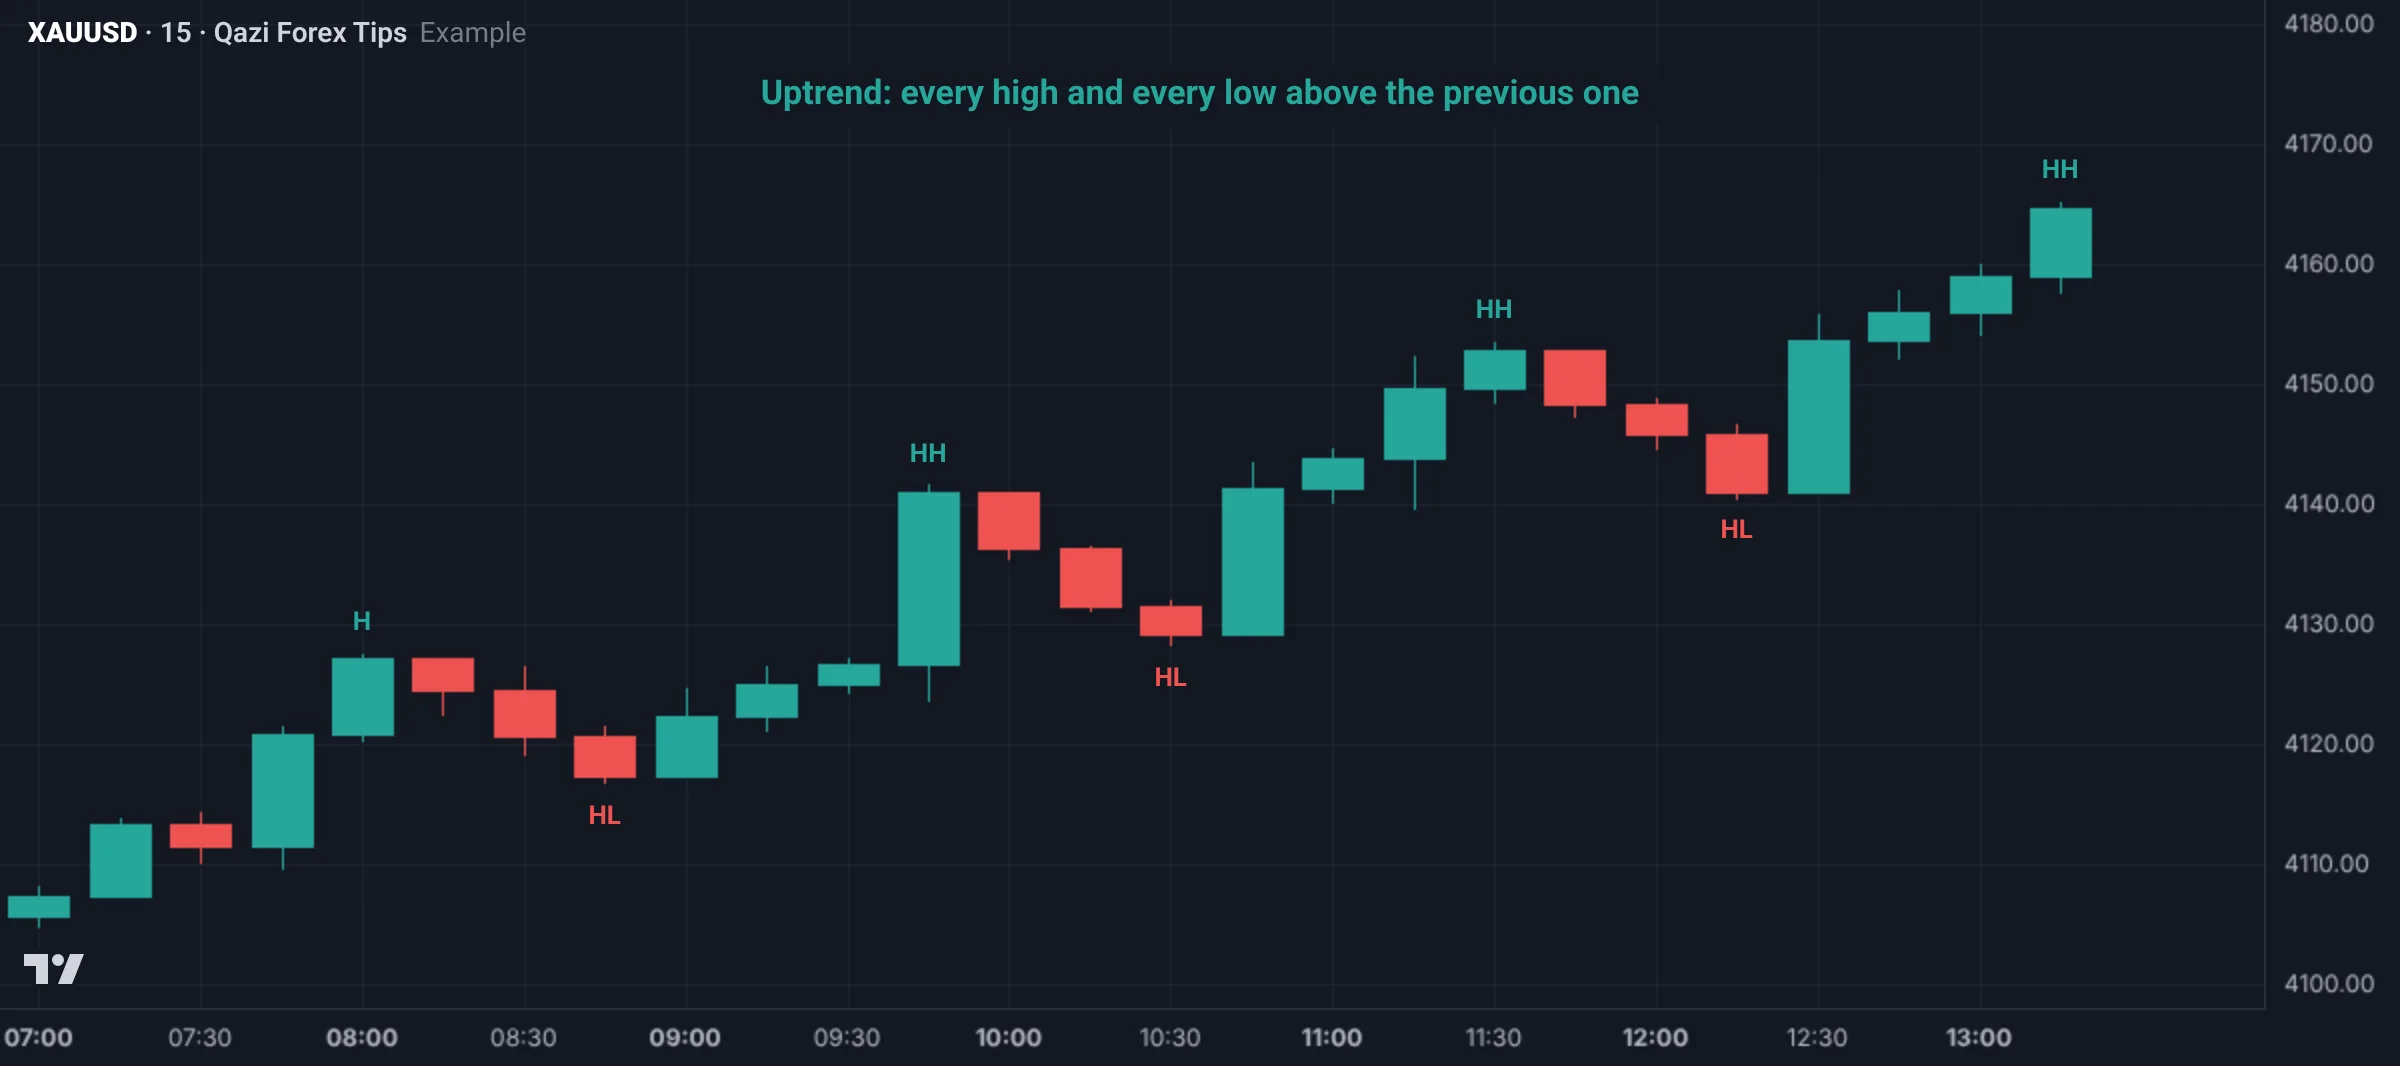
Uptrend: HH and HL
When both highs and lows are rising, the market is in an uptrend. Buyers step in at a higher price on every pullback.
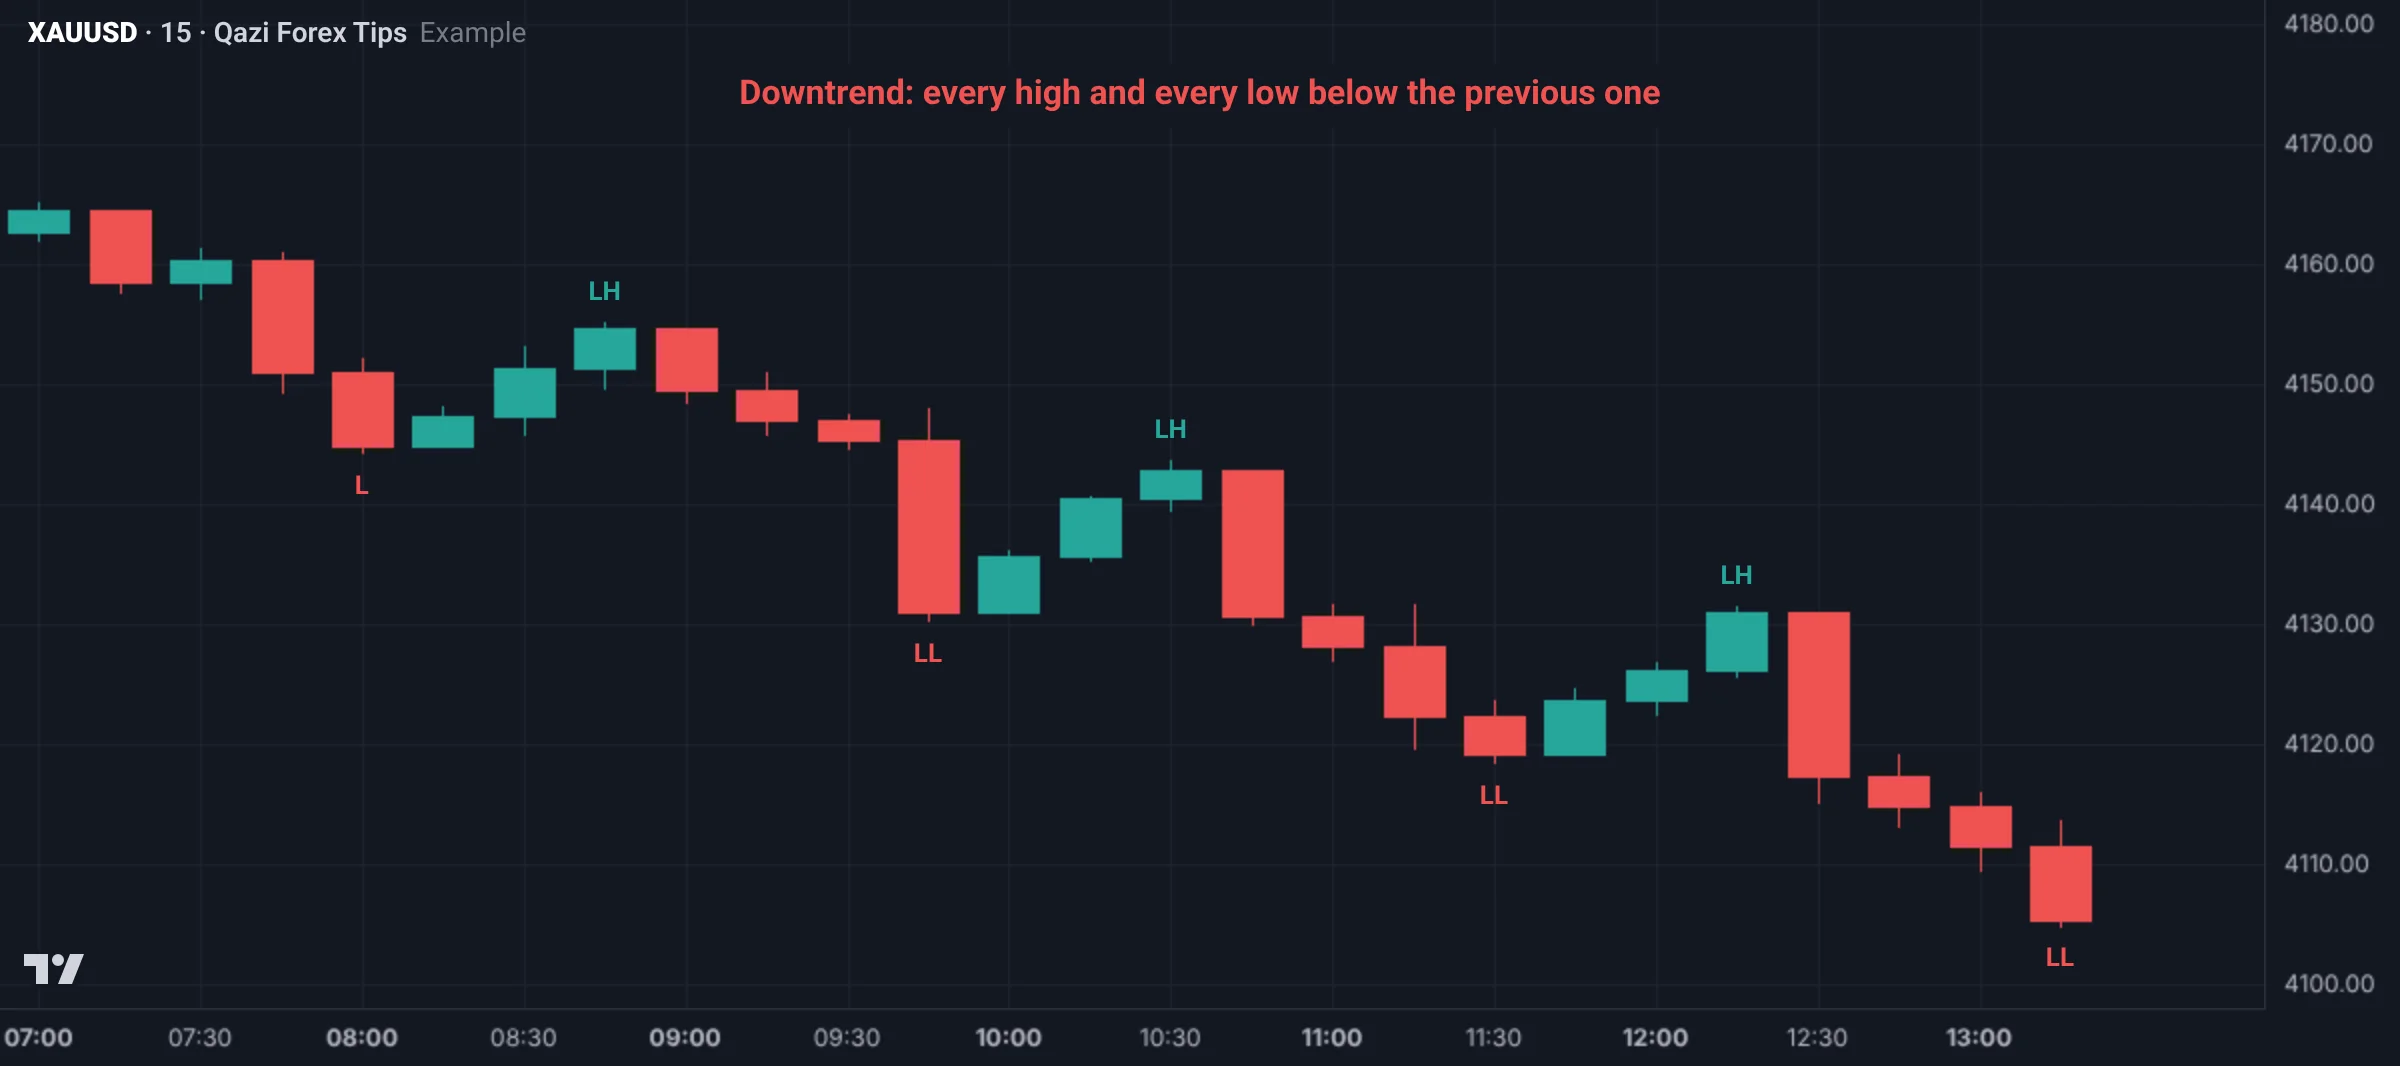
Downtrend: LH and LL
When both highs and lows are falling, it is a downtrend. Sellers sell at a lower price on every move up.
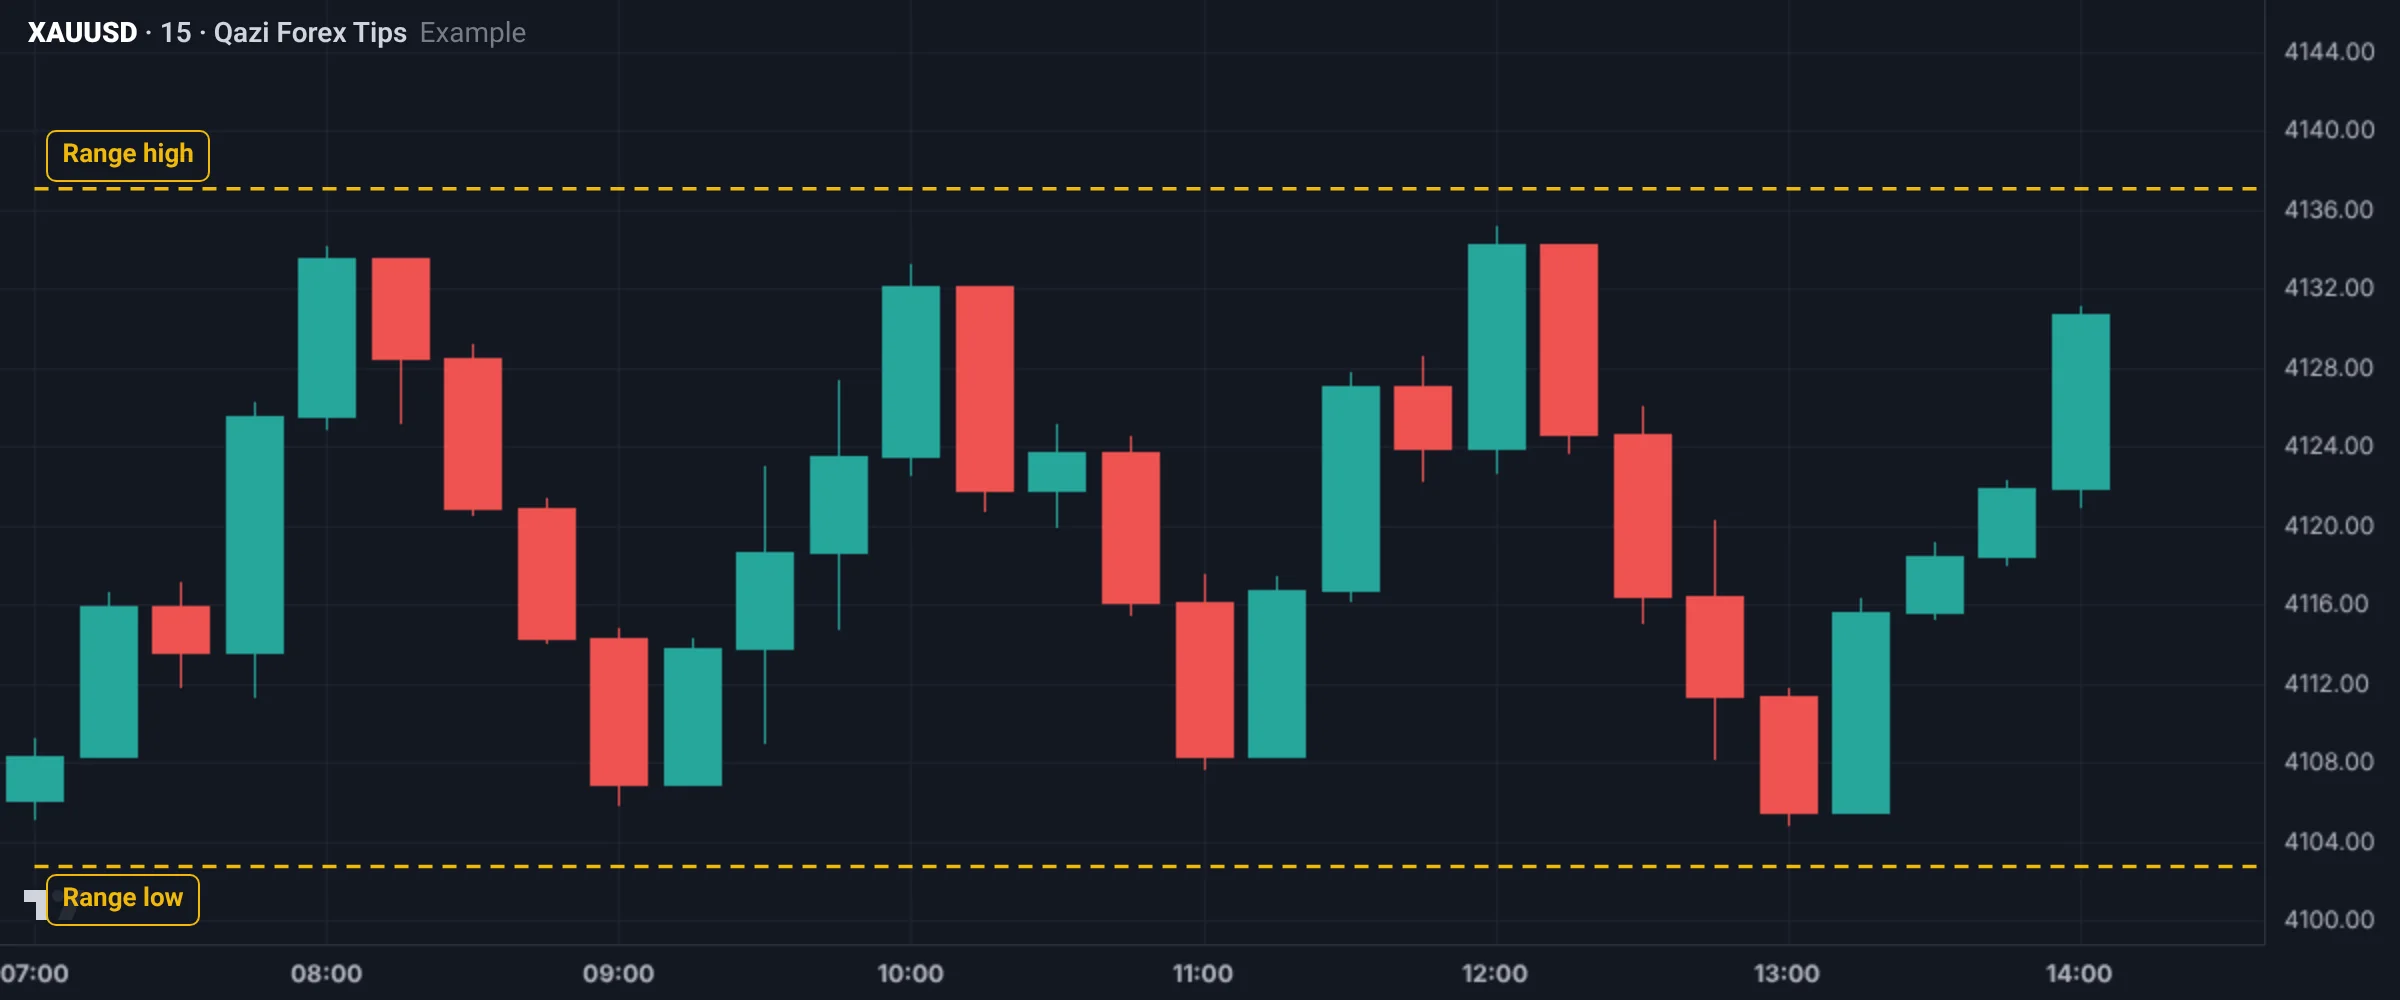
Range: no new high, no new low
When price swings between a clear high and low without a clean HH or LL, it is a range. Entering in the middle of a range is the biggest mistake. Both edges of a range are liquidity in SMC, which Phase 2 covers in detail.
Reading structure step by step
- Show 100 to 150 candles on the chart and mark only major swings.
- Move from left to right: compare each new high with the previous high, and each new low with the previous low.
- Label each swing HH, HL, LH or LL.
- Use the last two highs and the last two lows to decide: uptrend, downtrend or range.
- Write one line: "H4 structure is bullish; the last HL is at this price."
Mixed situations
- HH but LL: the market is expanding. The trend is unclear, so be careful.
- LH but HL: the market is contracting (a triangle). Wait for the breakout, don't guess.
- One timeframe bullish, another bearish: this is normal. The multi-timeframe lesson solves it.
How a trend changes
A trend doesn't change in one candle; it weakens step by step. The usual path from an uptrend to a downtrend:
- Price makes HH and HL: a healthy uptrend.
- A new high stays below the previous high: the first LH. Buyers are tiring.
- Price closes below the last HL: the first LL. This is what the next lessons call a CHoCH.
- After that, a series of LH and LL: now a downtrend.
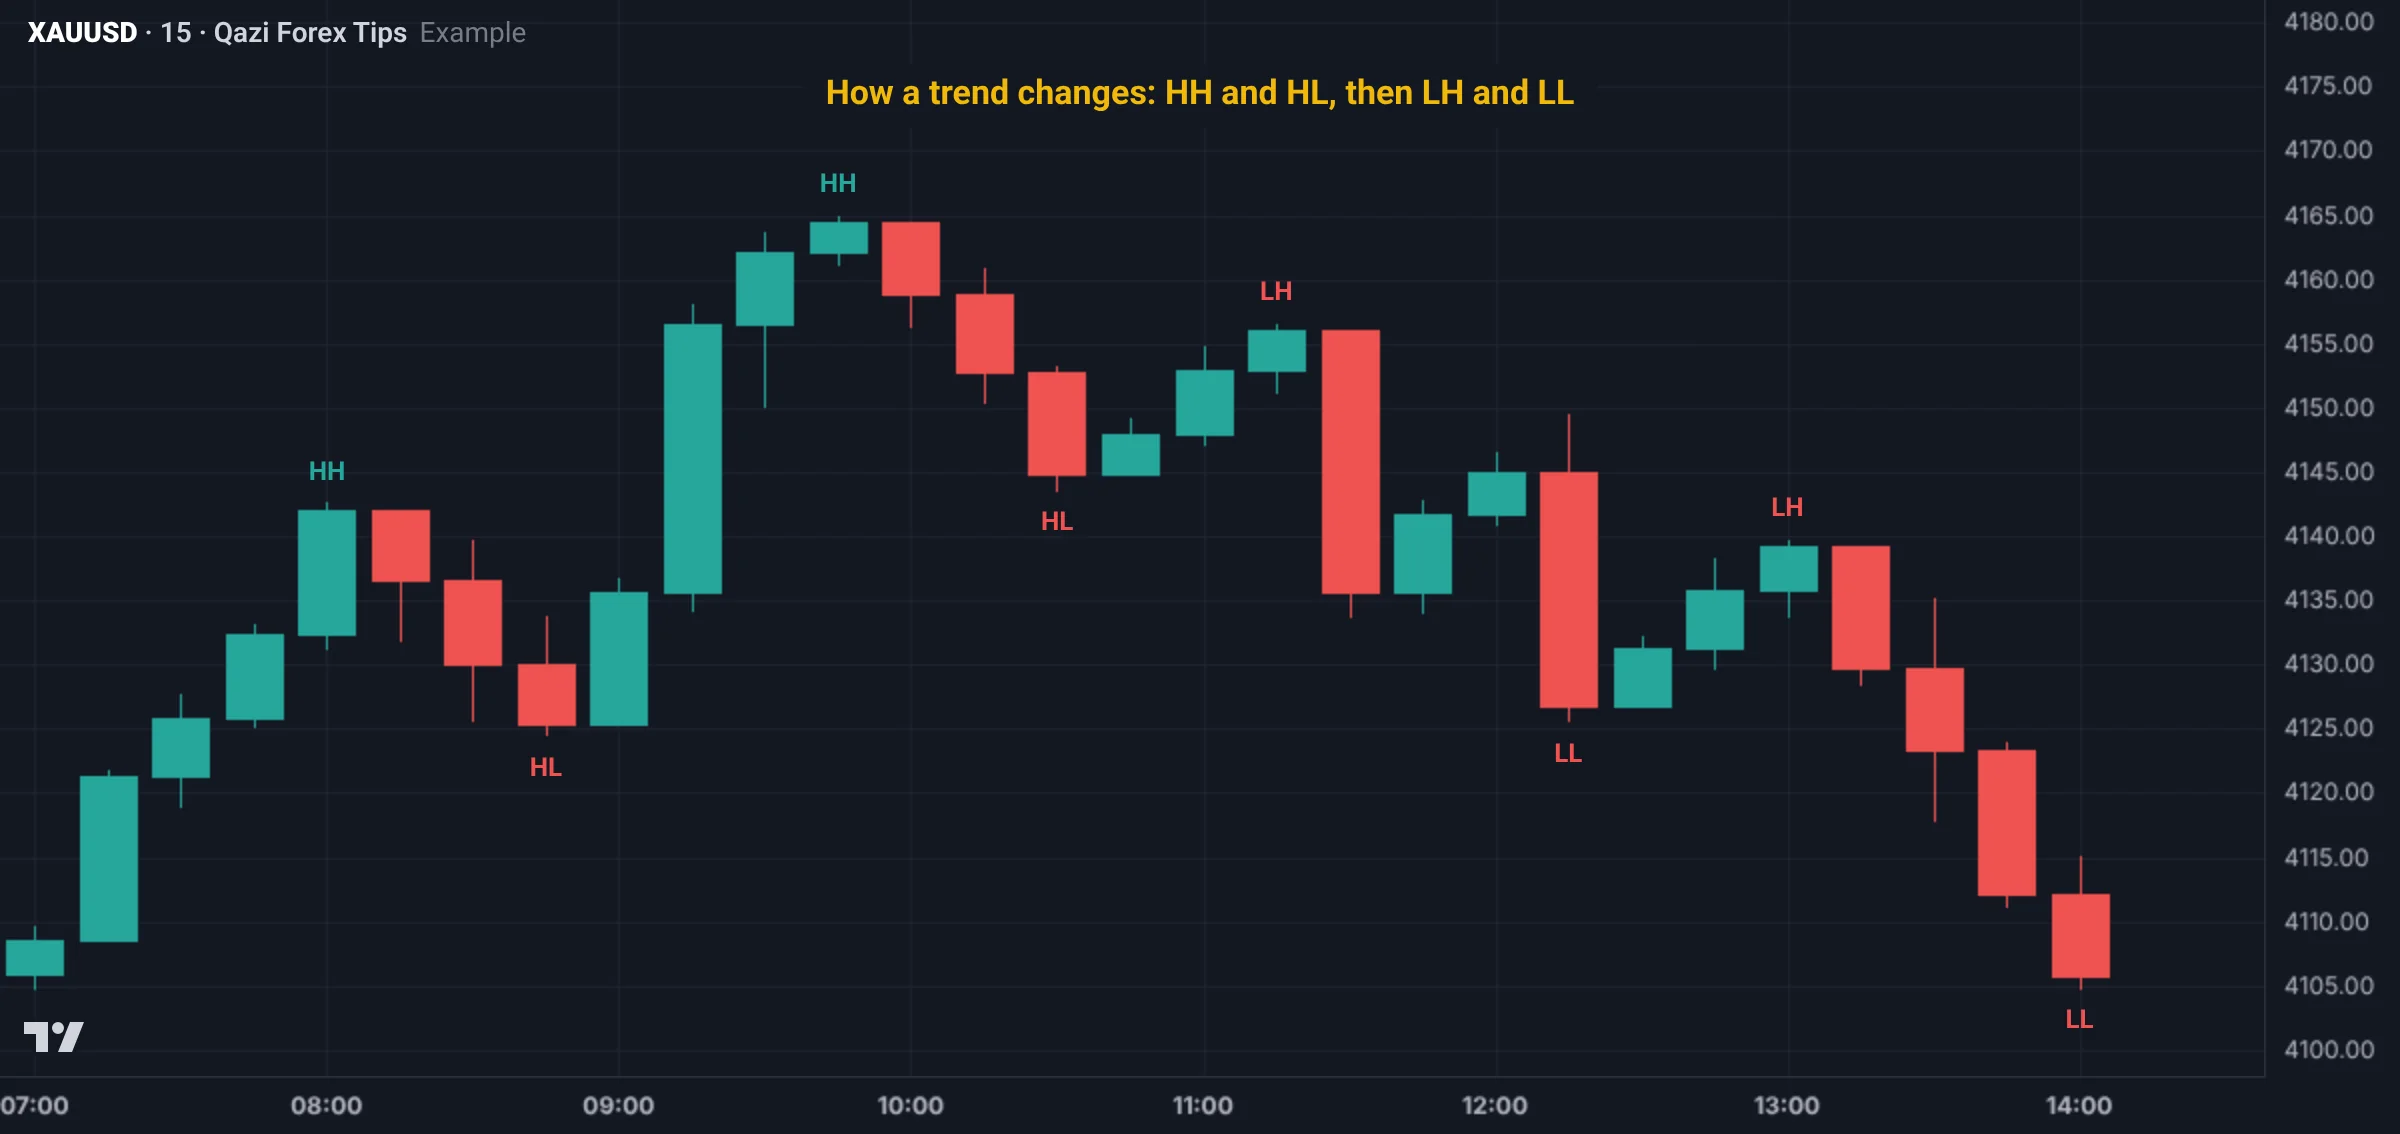
Remember: one LH alone does not prove a change. Even an uptrend sometimes prints a slightly lower high. The real change comes when the last HL is broken by a body close.
A Gold example
Suppose Gold on H1 made these swings: 4,108 (low), 4,126 (high), 4,117 (low), 4,139 (high), 4,129 (low), 4,147 (high).
- Highs: 4,126 → 4,139 → 4,147, each above the previous: HH.
- Lows: 4,108 → 4,117 → 4,129, each above the previous: HL.
- Result: an uptrend, with the last HL at 4,129. As long as price does not close below 4,129, the bias stays bullish.
- If the next high stalls at 4,143 (LH) and price then closes an H1 candle below 4,129, that is the first big sign of a trend change.
Writing the structure every day
Before trading each day, write three lines in your notebook:
- D1 / H4: what is the structure (up, down or range)?
- Last important level: the last HL in an uptrend, the last LH in a downtrend.
- Bias: "Bullish unless price closes below 4,129."
These three lines protect you from emotional decisions, because you already know at which price your view must change.
Real Gold chart examples
This is a real Gold H4 chart from 28 Oct 2026 to 13 Nov 2026 (data: Dukascopy, bid price, Pakistan time).
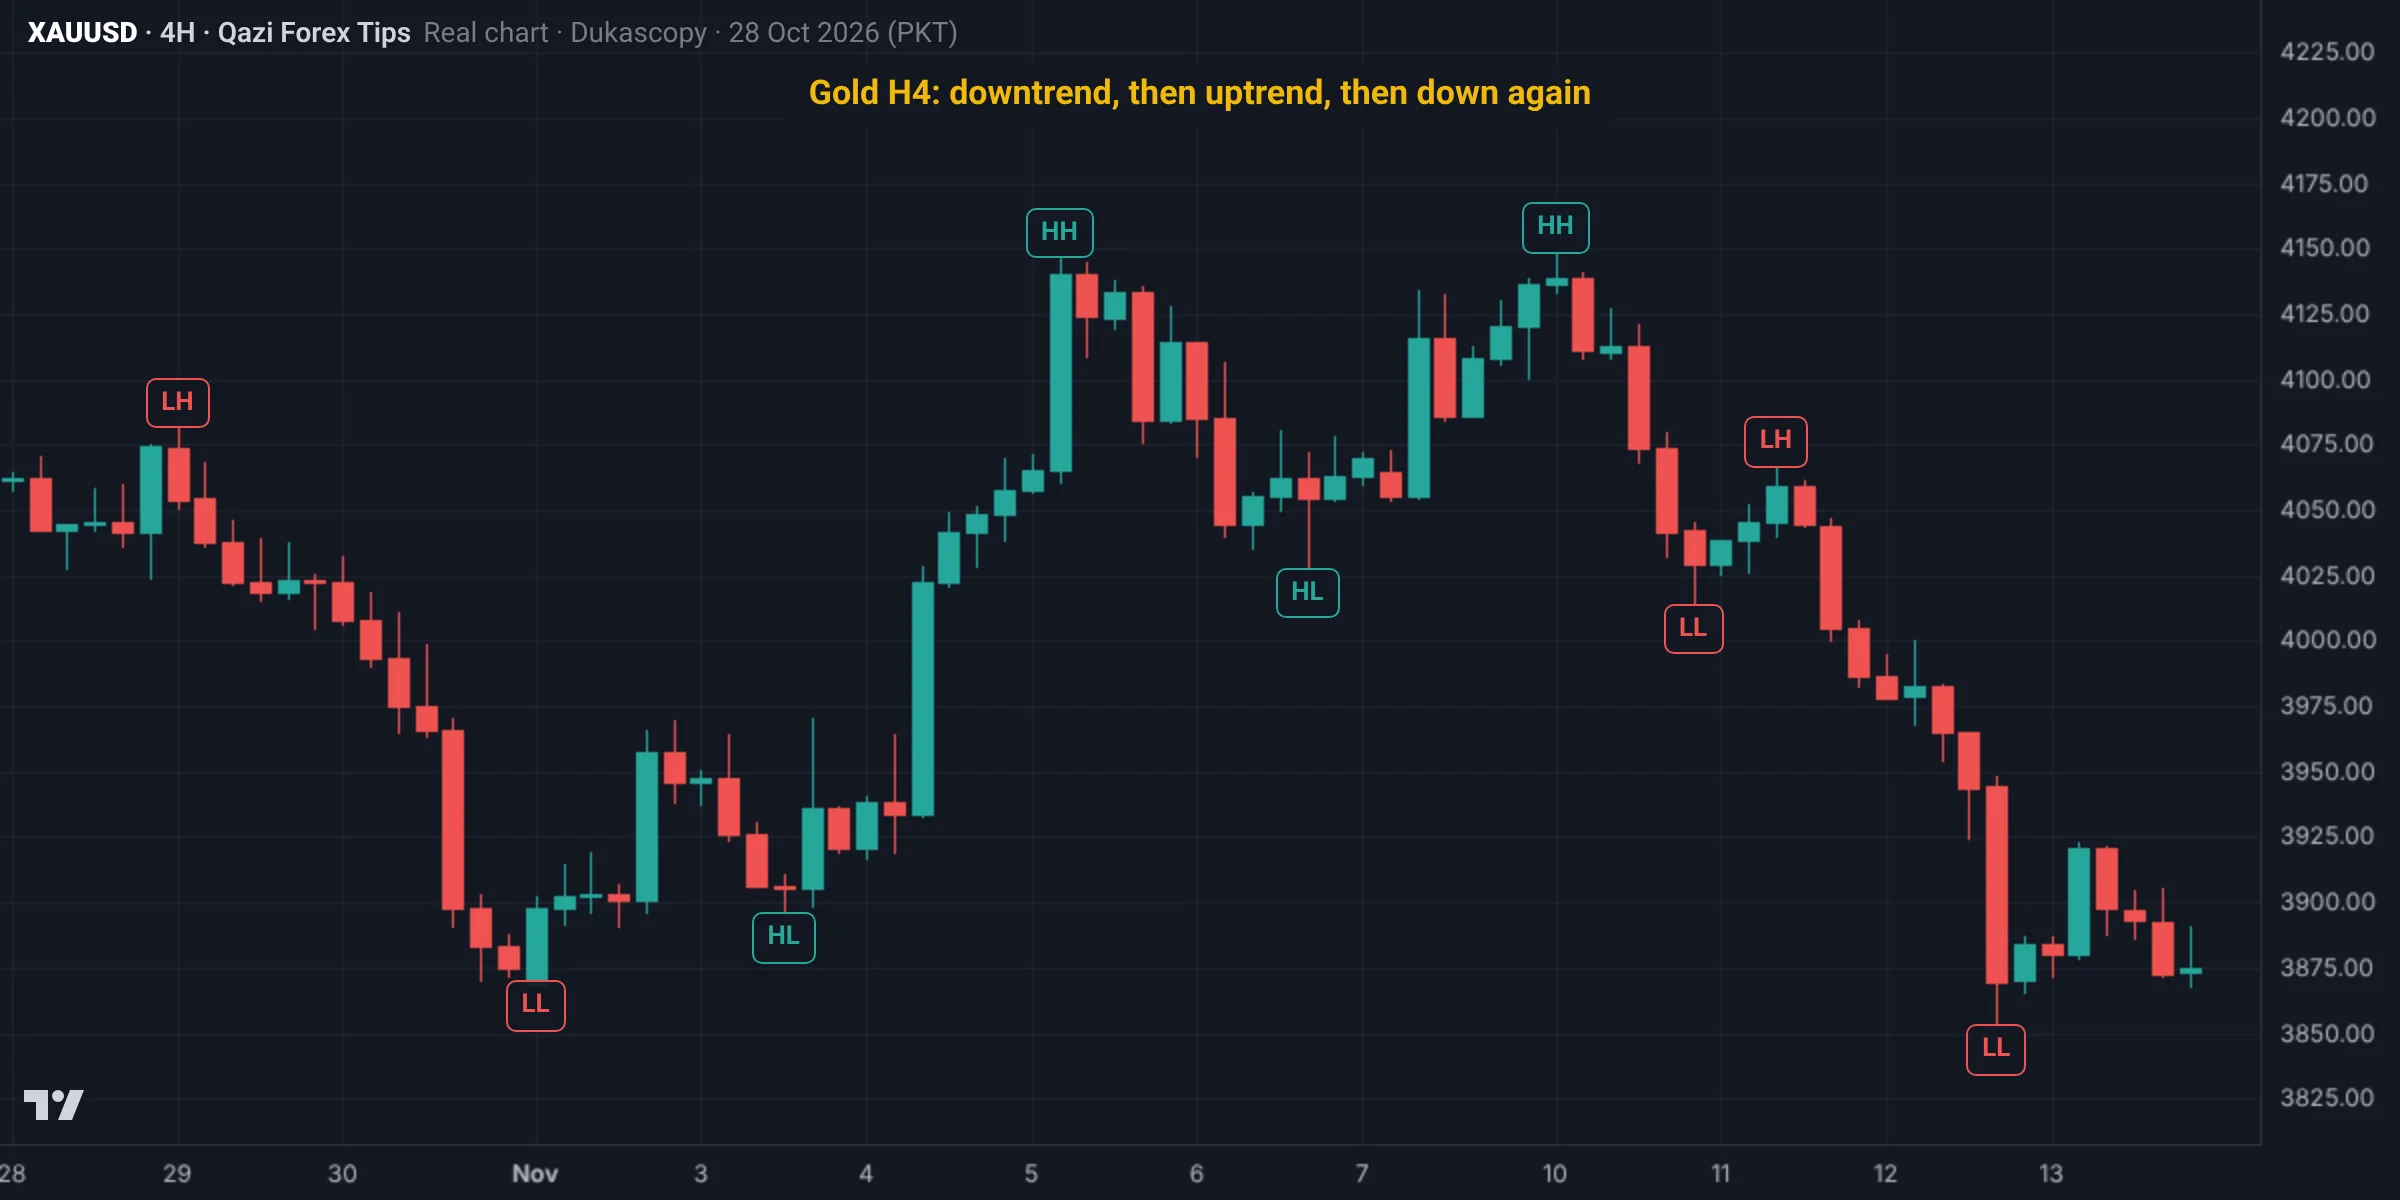
- Downtrend: the LH at 4,082.0 on 29 Oct and the LL at 3,869.1 on 2 Nov.
- Uptrend: an HL at 3,895.3 on 3 Nov, an HH at 4,146.8 on 5 Nov, an HL at 4,027.2 on 6 Nov and an HH at 4,148.6 on 10 Nov (only just above the previous high).
- Downtrend again: an LL at 4,013.4 late on 10 Nov, an LH at 4,066.8 on 11 Nov and an LL at 3,852.3 on 12 Nov.
Real swings are never as neat as textbook drawings, but the HH, HL, LH and LL sequence is still easy to read.
Second example: a clean downtrend (29-30 Oct)
Gold H1 on 29 and 30 Oct 2026 (data: Dukascopy, bid price; Pakistan time). In the first example the trend kept changing; here is a clean two-day downtrend:
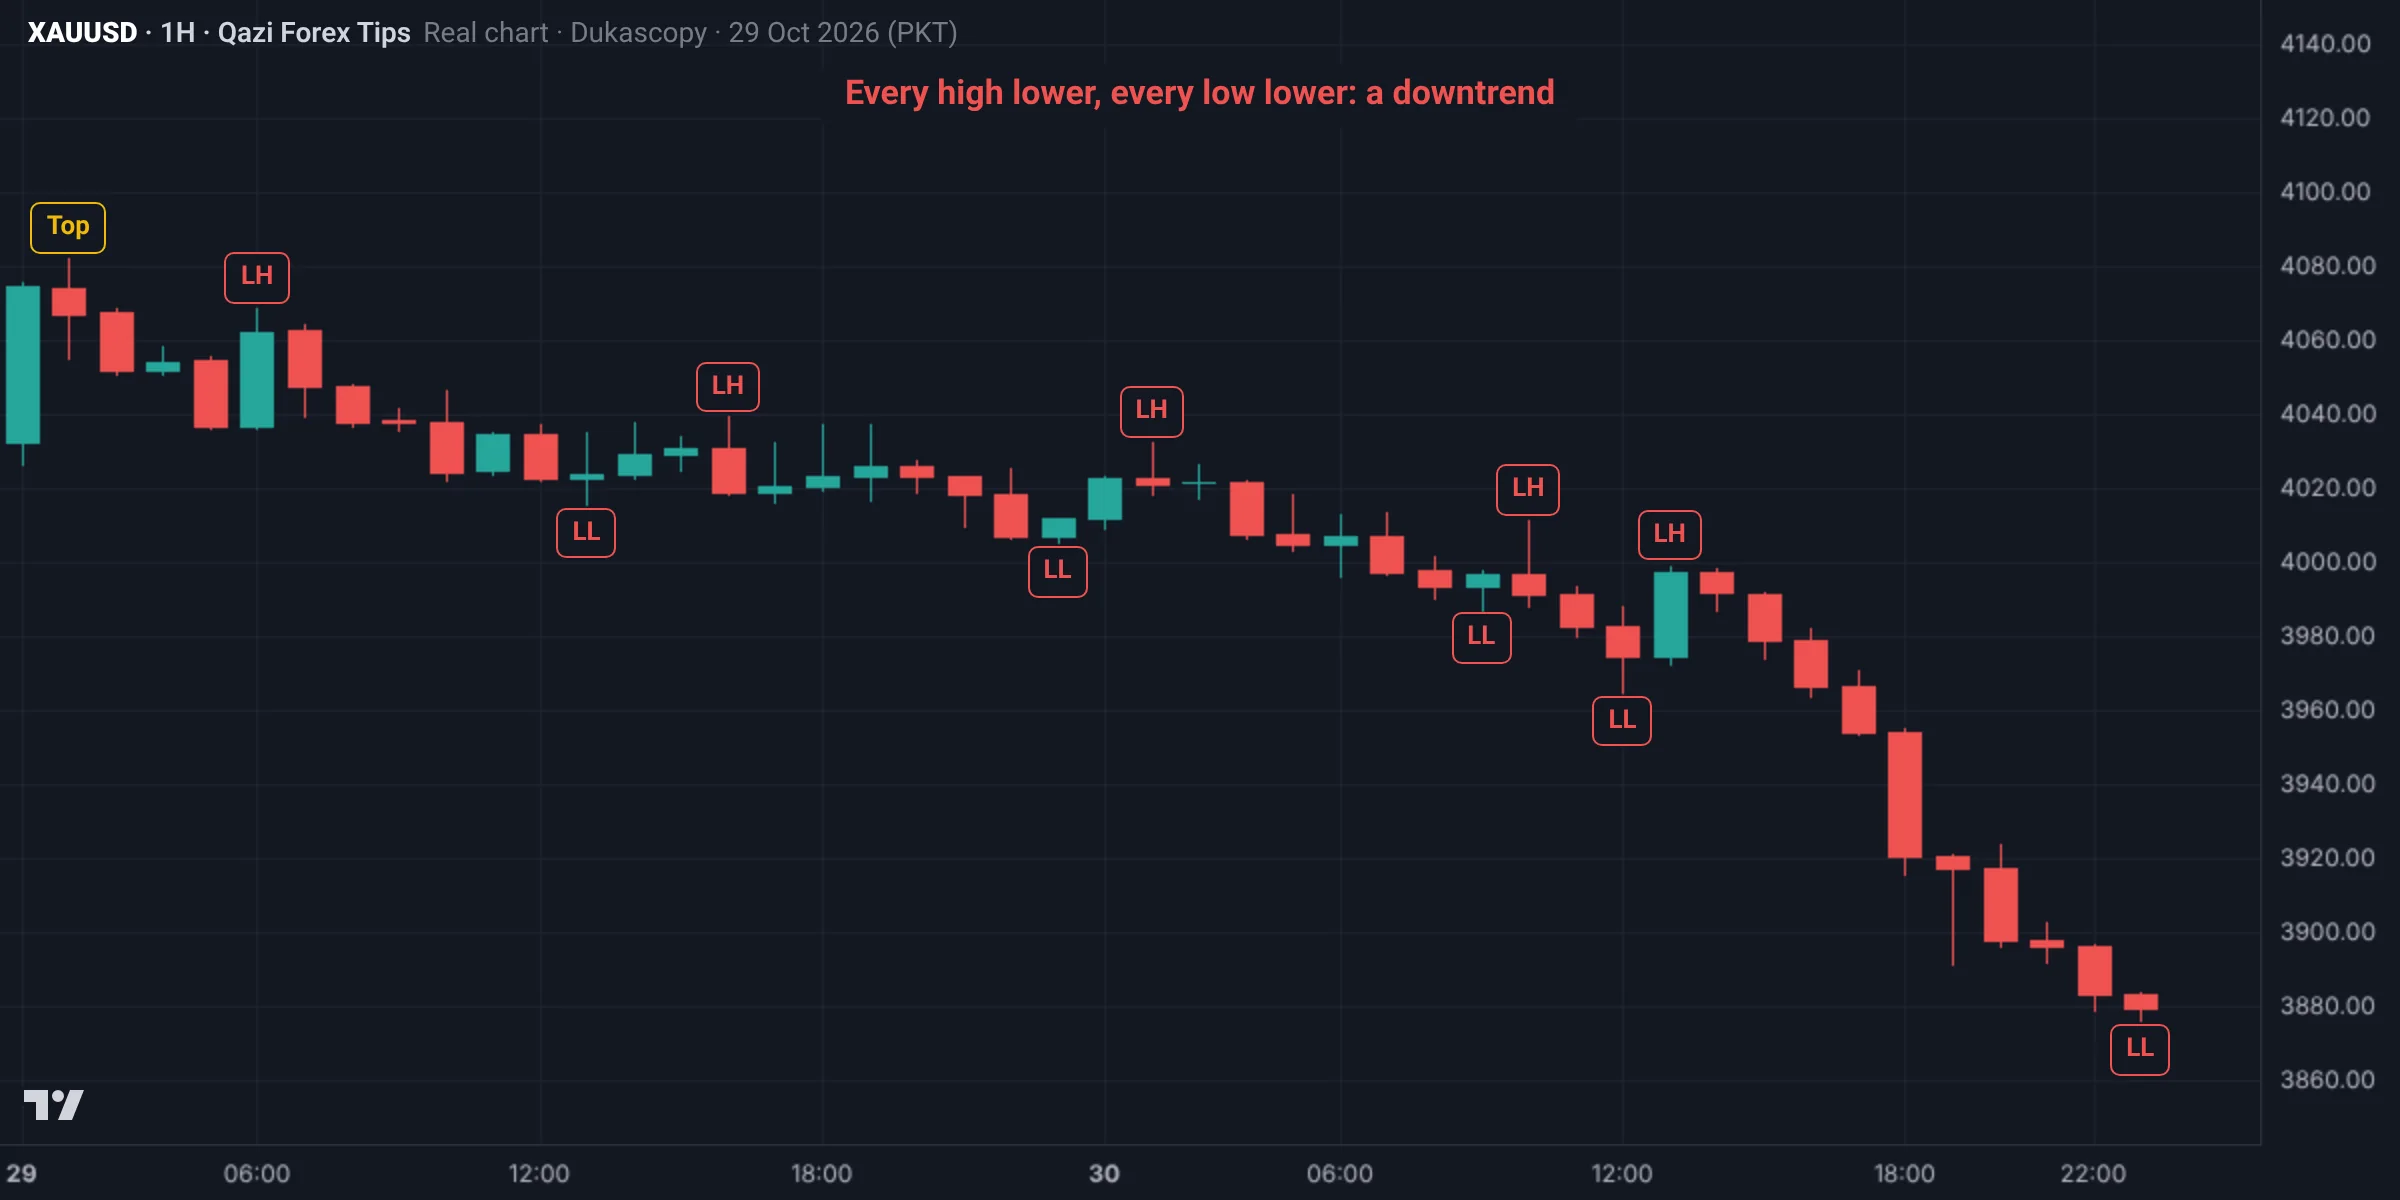
- Top: the high of 4,082.0 at 01:00 on 29 Oct.
- LH (lower high): 4,068.6, 4,039.2, 4,032.3, 4,011.3, 3,999.1. Each high below the previous one.
- LL (lower low): 4,015.6, 4,005.1, 3,987.3, 3,964.9, 3,876.1. Each low below the previous one.
Until this sequence breaks, every move up is just a pullback and sell setups are better. At the last LL price was $206 below the top.
Common mistakes
Summary
- HH and HL make an uptrend, LH and LL a downtrend, and no new high or low a range.
- The trend changes when the last HL (or the last LH in a downtrend) breaks with a body close.
- Write three lines daily: structure, last important level and bias.
Spot it on the chart: practice
This is a real Gold chart (Dukascopy data, Pakistan time). Study it and pick an answer. After you answer, the fully marked chart and the explanation appear.
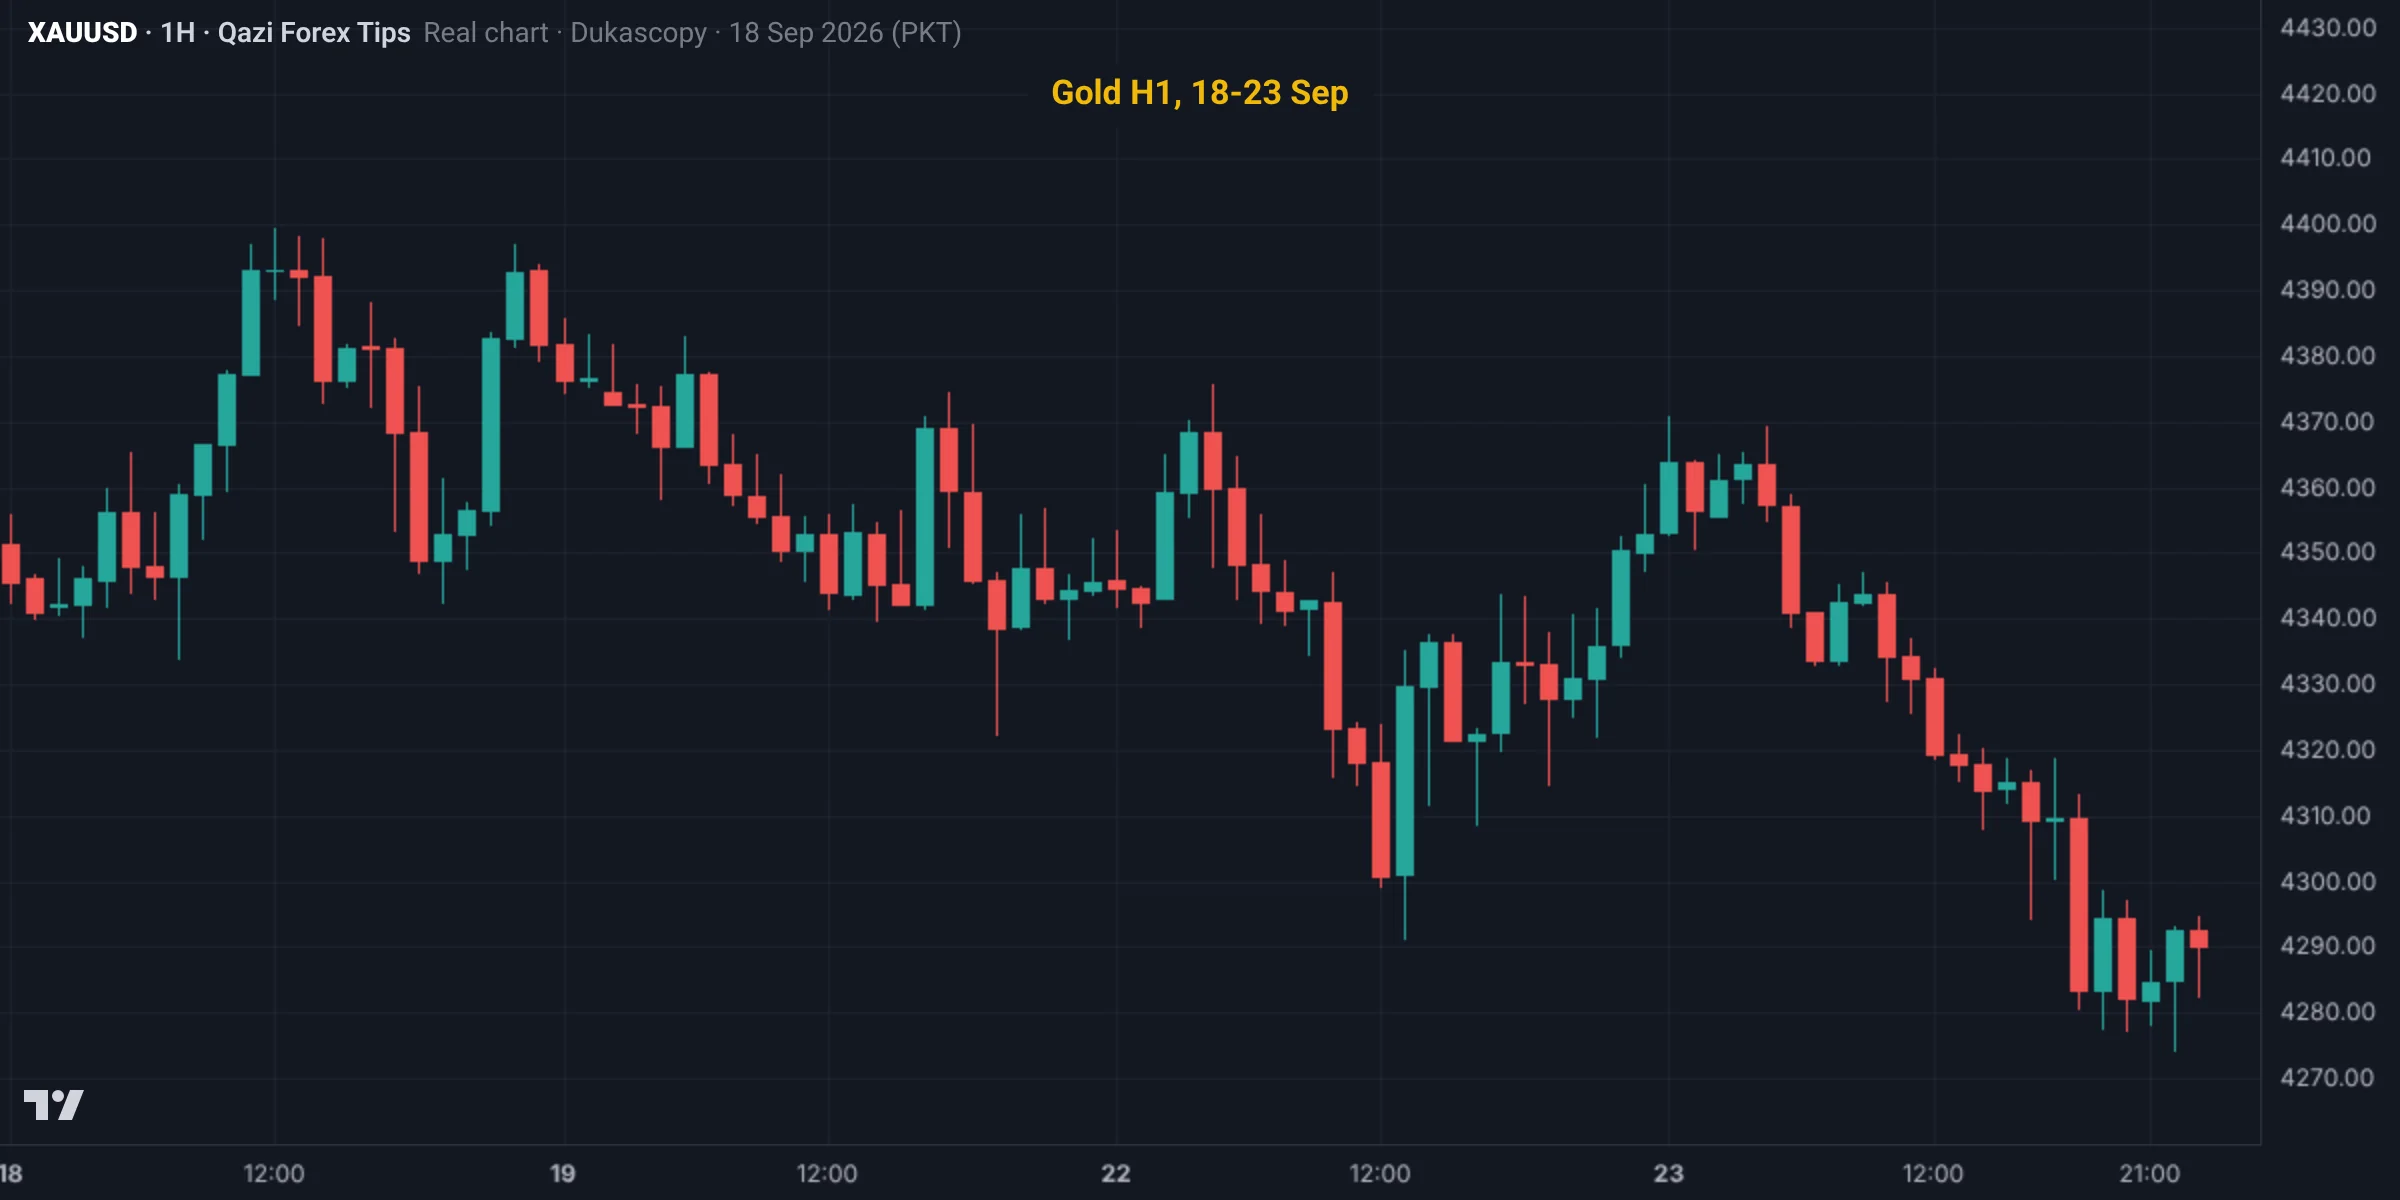
What is the structure on this chart?
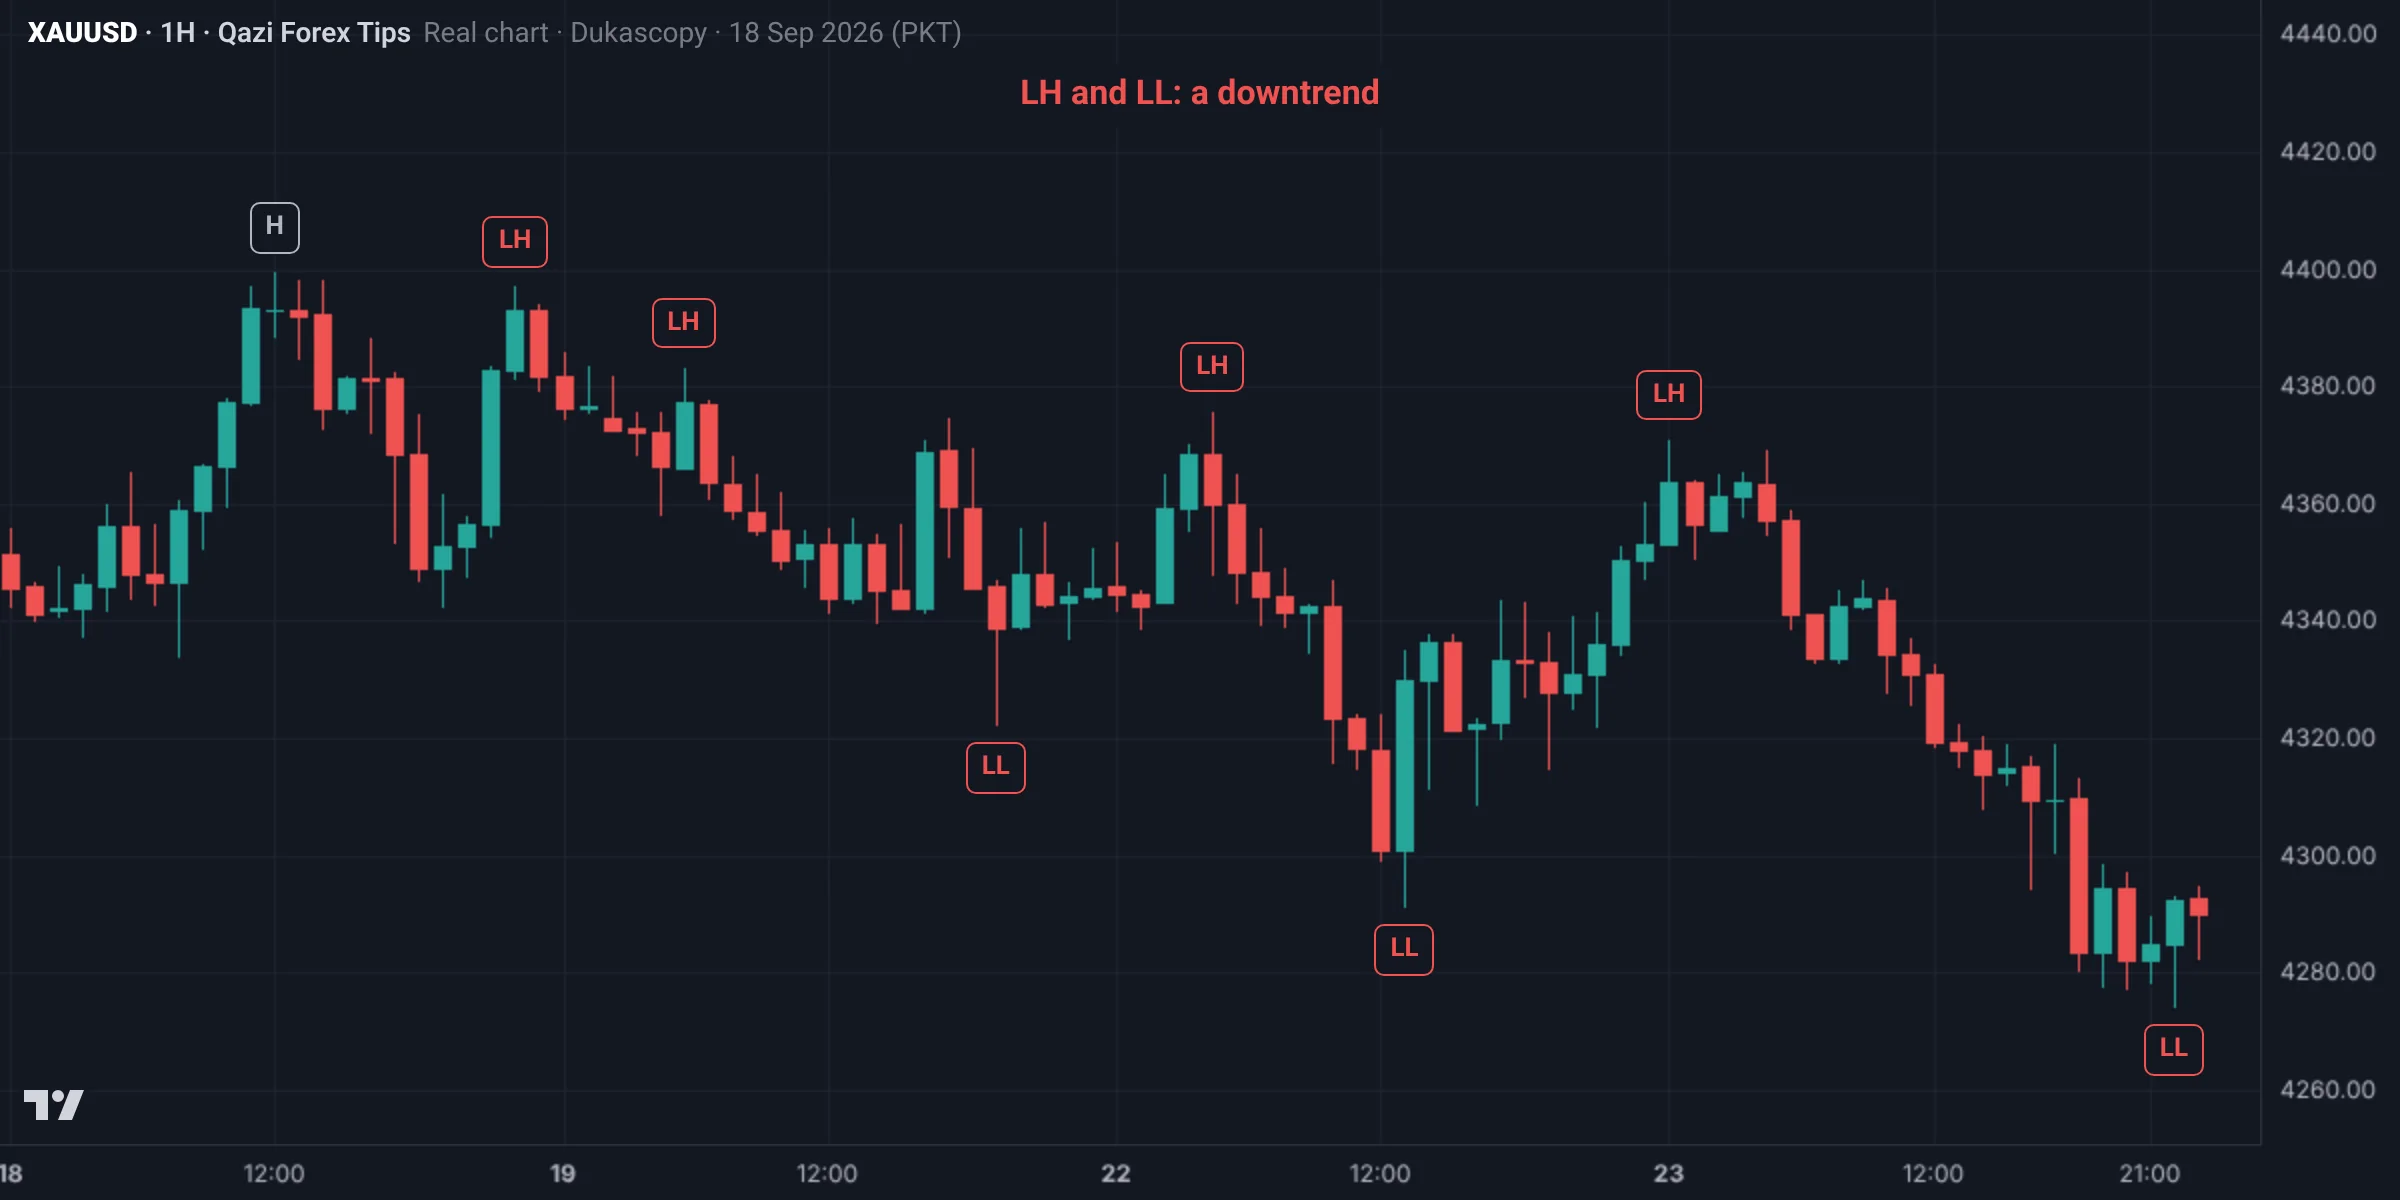
The highs kept falling: 4,397.0, 4,383.2, 4,375.7, 4,371.0, and so did the lows: 4,322.3, 4,291.2, 4,274.2. Each high is lower than the last (LH) and each low is lower than the last (LL).
The marked chart
Test yourself: Lesson 1.1 quiz
9 questions. Pick one answer for each and you will see at once whether it is right and why. Your score and grade appear at the end. You need 70% to pass.
0 correct · 0 / 9
Question 1What does HL (Higher Low) mean?
Each swing is named by comparing it with the previous swing of the same kind.
Question 2What identifies a downtrend?
When both highs and lows are falling, it is a downtrend.
Question 3What is the biggest mistake in a range?
Both edges of a range are liquidity in SMC; entering in the middle makes no sense.
Question 4What do you use to decide the trend?
The trend comes from swings, not candle colours.
Question 5Price makes an HH but also an LL. What is this?
HH with LL is expansion; LH with HL is contraction (a triangle).
Question 6An uptrend prints its first LH. Has the trend changed?
Even an uptrend sometimes prints a slightly lower high; selling the first LH is a mistake.
Question 7Gold H1 lows: 4,108, 4,117, 4,129; highs: 4,126, 4,139, 4,147. How long does the bias stay bullish?
The last HL is 4,129; a body close below it would be the first big sign of a trend change.
Question 8Which three lines should you write before trading each day?
Knowing in advance at which price your view changes protects you from emotional decisions.
Question 9Three red candles appear in an uptrend. What does it mean?
Candle colour does not change the trend; the last HL must break.
Lesson checklist
Tick each point once you understand it. Your ticks are saved in this browser.
Assignment
- Take screenshots of 15 different places on the Gold H1 chart and label HH, HL, LH and LL on the major swings.
- Under each chart write one line: uptrend, downtrend or range, and why.
- Find 3 range charts among those 15 and mark both edges of the range.
- Post your best 5 charts in the group.
- On Gold H1, find a place where an uptrend turned into a downtrend and mark the first LH and the break of the last HL.
Post your assignment screenshots with your reasons in our free Facebook group, where your charts will be checked.
Join the free group
Who wrote this lesson
Dr. Qazi Abdul Basit, Ph.D
Ph.D in Business Administration and a forex and Gold trader since 2013. Founder of Qazi Forex Tips, which teaches traders in Pakistan and India price action, risk management and trading psychology in their own language: 65 student batches so far, free courses on YouTube, and MT5 tools for traders (QFT Replay Simulator, QFT Trade Assistant).
- 2013 trading since
- 75K+ Facebook group members
- 65 student batches
- 15K+ YouTube subscribers
How this lesson was made: the content follows Dr. Qazi's teaching method and years of trading. Real charts are built from Dukascopy Gold (XAUUSD) data, and backtest results are shown as they came out, even when negative. We do not sell signals, manage accounts or take money from any broker. Last updated: 19 November 2026.
Questions
What is market structure in trading?
The pattern of swing highs and lows: higher highs and higher lows make an uptrend, lower highs and lower lows a downtrend, and no new highs or lows a range.
What do HH, HL, LH and LL mean?
Higher high, higher low, lower high and lower low, each compared with the previous swing of the same kind.
How do I identify a downtrend?
When highs are below previous highs (LH) and lows are below previous lows (LL).
What should I do in a range?
Avoid entries in the middle; wait for a rejection or a break at the edges.
Which timeframe should I read structure on?
Bias on H4 or daily, zones on H1, entries on M15 or lower.
Does one deep pullback end an uptrend?
No. The trend changes only when the protective swing breaks, which is a CHoCH.
How do I identify an uptrend?
Each swing high is above the previous one (HH) and each swing low is above the previous one (HL). The uptrend holds until the last HL breaks with a body close.
On which timeframe does market structure matter most?
On the higher timeframes (D1, H4), because they set the bias. The lower timeframes (M15, M5) are only for the entry.
Read more
Education only, not financial advice. Trading forex, Gold and CFDs carries a high risk of loss. SMC concepts describe tendencies, not guarantees. Lesson 5 of 38.