 Qazi Forex Tips
Key findings
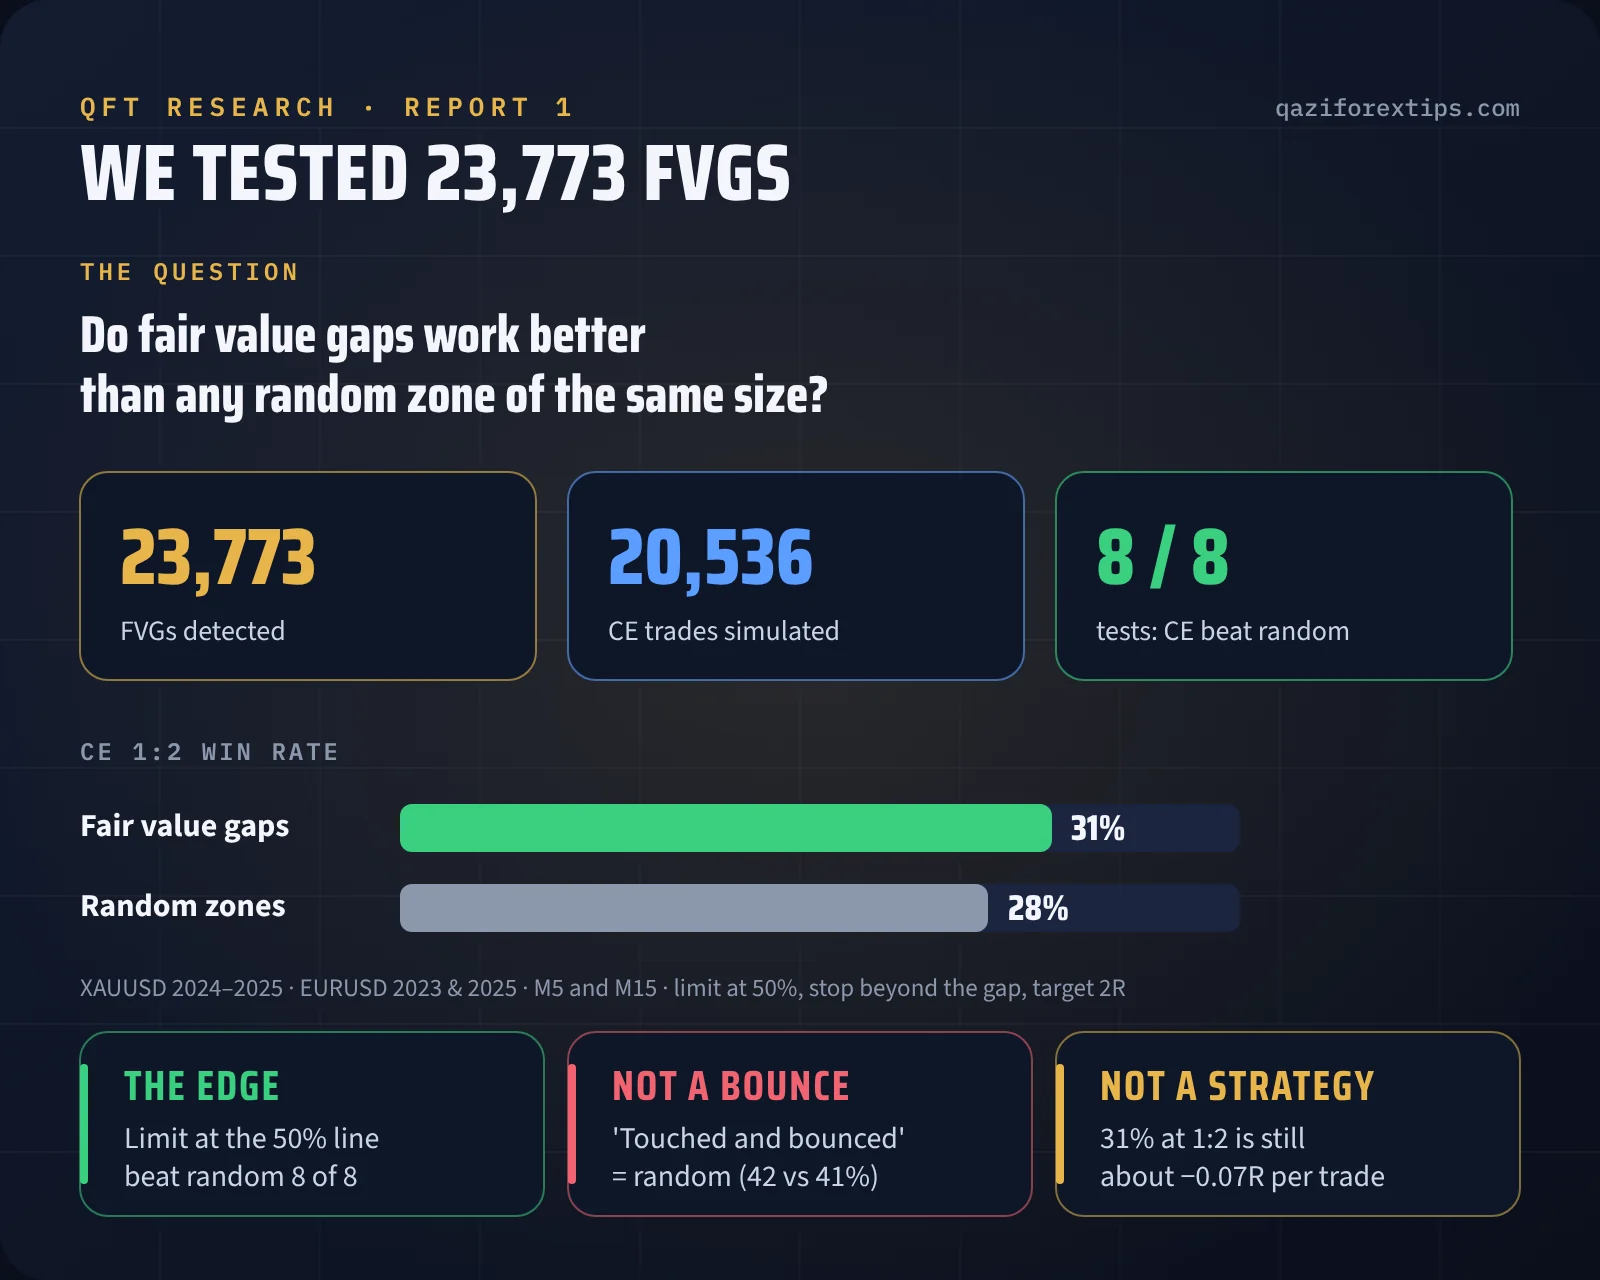
- The edge is at the 50% line. A limit order at the consequent encroachment (CE) of a gap won more 1:2 trades than the same order on a random zone in all 8 tests, by 1 to 5 points (31% vs 28% overall).
- "Price touched the gap and bounced" is not an edge. After the first touch, gaps and random zones of the same size reacted almost equally (about 42% vs 41%).
- The edge is small. At 1:2 the break-even win rate is 33.3%. With 31% wins the CE trade alone averaged about −0.07R per trade before spread. A fair value gap is a zone, not a complete strategy.
- Popular filters did not help on average. Trading with the higher-timeframe trend or inside the killzones did not improve the CE trade in this data.
- Small samples lie. A few thousand candles can show 43% or 29% for the same idea. Judge a setup on thousands of trades, not dozens.
Why we ran this test
Fair value gaps are one of the most popular ideas in ICT and Smart Money Concepts trading, and most FVG indicators show a "respected" or "filled" percentage. The problem is that any zone close to price gets touched and bounces some of the time. A respect rate on its own has nothing to compare with.
So before we released our free QFT FVG Pro indicator, we tested its exact detection logic against a fair baseline: random zones with the same size and the same distance from price, put through exactly the same tests.
Data and method
- Markets and years: Gold (XAUUSD) 2024 and 2025, EURUSD 2023 and 2025.
- Timeframes: M5, M15 and H1, built from HistData.com one-minute bars. 23,773 gaps were detected in total: 23,523 on M5 and M15 (the 8 data sets below) and 250 on H1. With so few gaps the H1 sets are too small for a reliable comparison, so the results below use the 8 M5 and M15 sets.
- Gap detection: the same logic as QFT FVG Pro: a three-candle gap, only bigger than the average of the last 100 gaps, with a real impulse, overlapping gaps from one move merged, and only closed candles used (no repaint).
- Random baseline: for every gap, 3 random zones with the same size and the same distance from price (both measured in ATR) at pseudo-random later candles, with a fixed seed so the result can be repeated.
- Test 1, respected after touch: after the first touch, does price move 1 ATR away in the gap's direction before trading through the whole gap?
- Test 2, CE trade: a limit order at the 50% line, stop 0.1 ATR beyond the far edge, target 2R. 20,536 of these trades were simulated.
- Costs: results are before spread, commission and slippage.
Results in all 8 tests (M5 and M15)
| Market · year · timeframe | Gaps | Respected FVG | Random | CE 1:2 win FVG | Random | Edge (pts) |
|---|---|---|---|---|---|---|
| XAUUSD 2024 · M15 | 1,336 | 42% | 44% | 32% | 28% | +4 |
| XAUUSD 2024 · M5 | 4,571 | 41% | 40% | 31% | 29% | +2 |
| XAUUSD 2025 · M15 | 1,392 | 43% | 43% | 34% | 30% | +4 |
| XAUUSD 2025 · M5 | 4,464 | 41% | 40% | 32% | 29% | +3 |
| EURUSD 2023 · M15 | 1,172 | 43% | 42% | 29% | 26% | +3 |
| EURUSD 2023 · M5 | 4,020 | 41% | 41% | 30% | 28% | +2 |
| EURUSD 2025 · M15 | 1,460 | 44% | 42% | 34% | 29% | +5 |
| EURUSD 2025 · M5 | 5,108 | 42% | 41% | 29% | 28% | +1 |
Download the summary as a CSV file.
Finding 1: a bounce is not proof
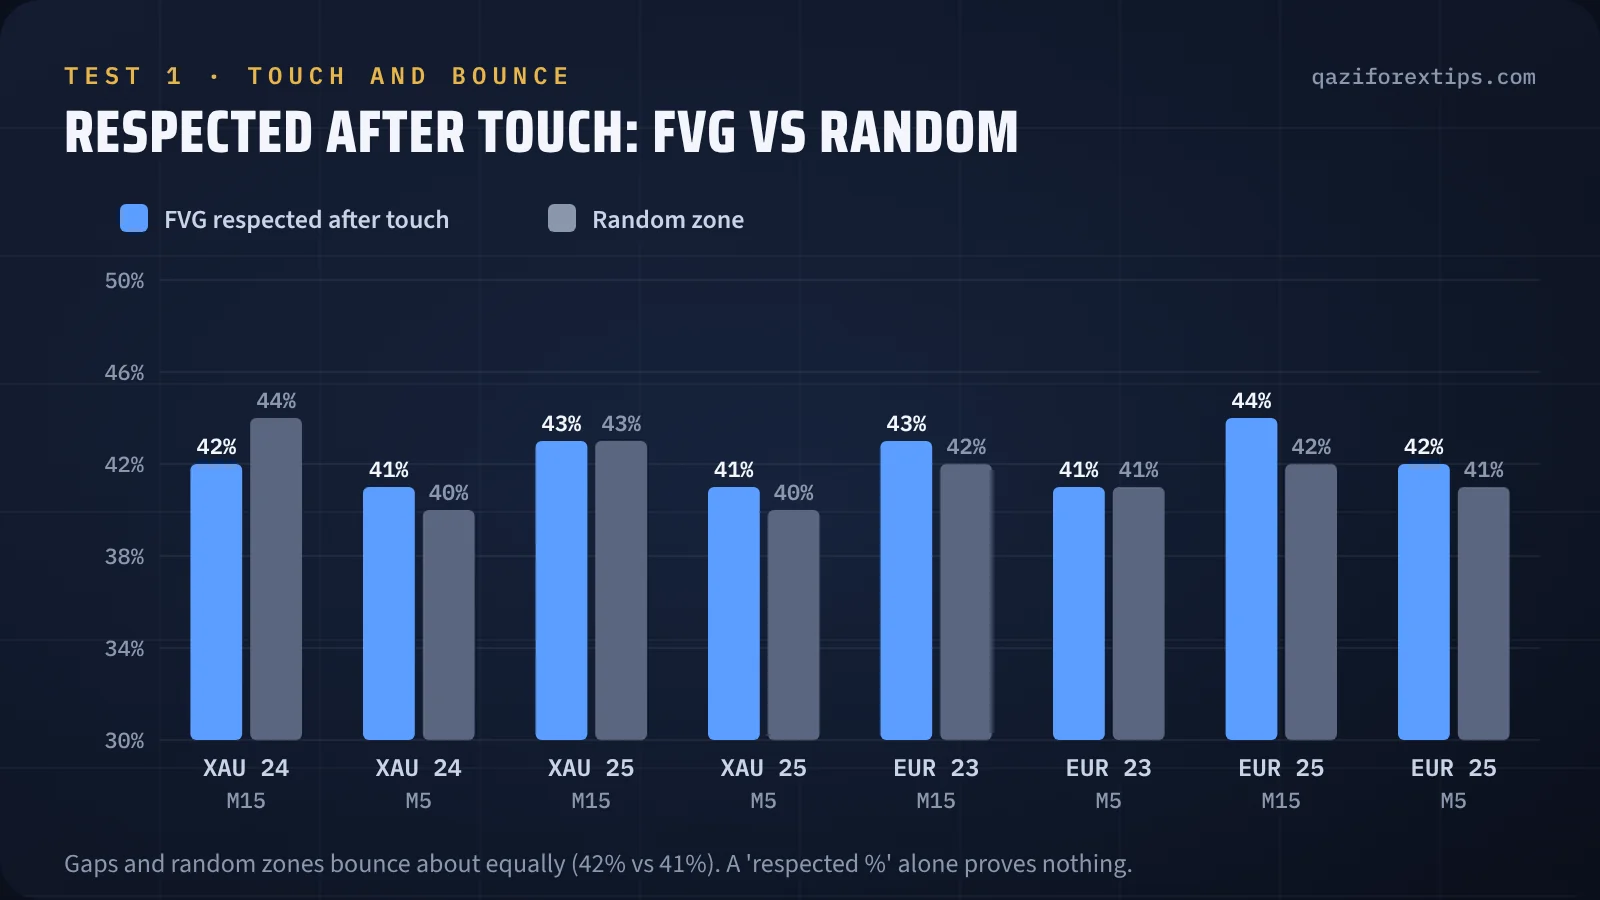
Across the 8 sets, gaps were "respected" after the first touch about 42% of the time and random zones about 41%. In one set (Gold 2024, M15) the random zones were even slightly ahead. This is the number most indicators show, and on its own it does not separate a fair value gap from any other area near price.
Finding 2: the 50% line is where the edge is
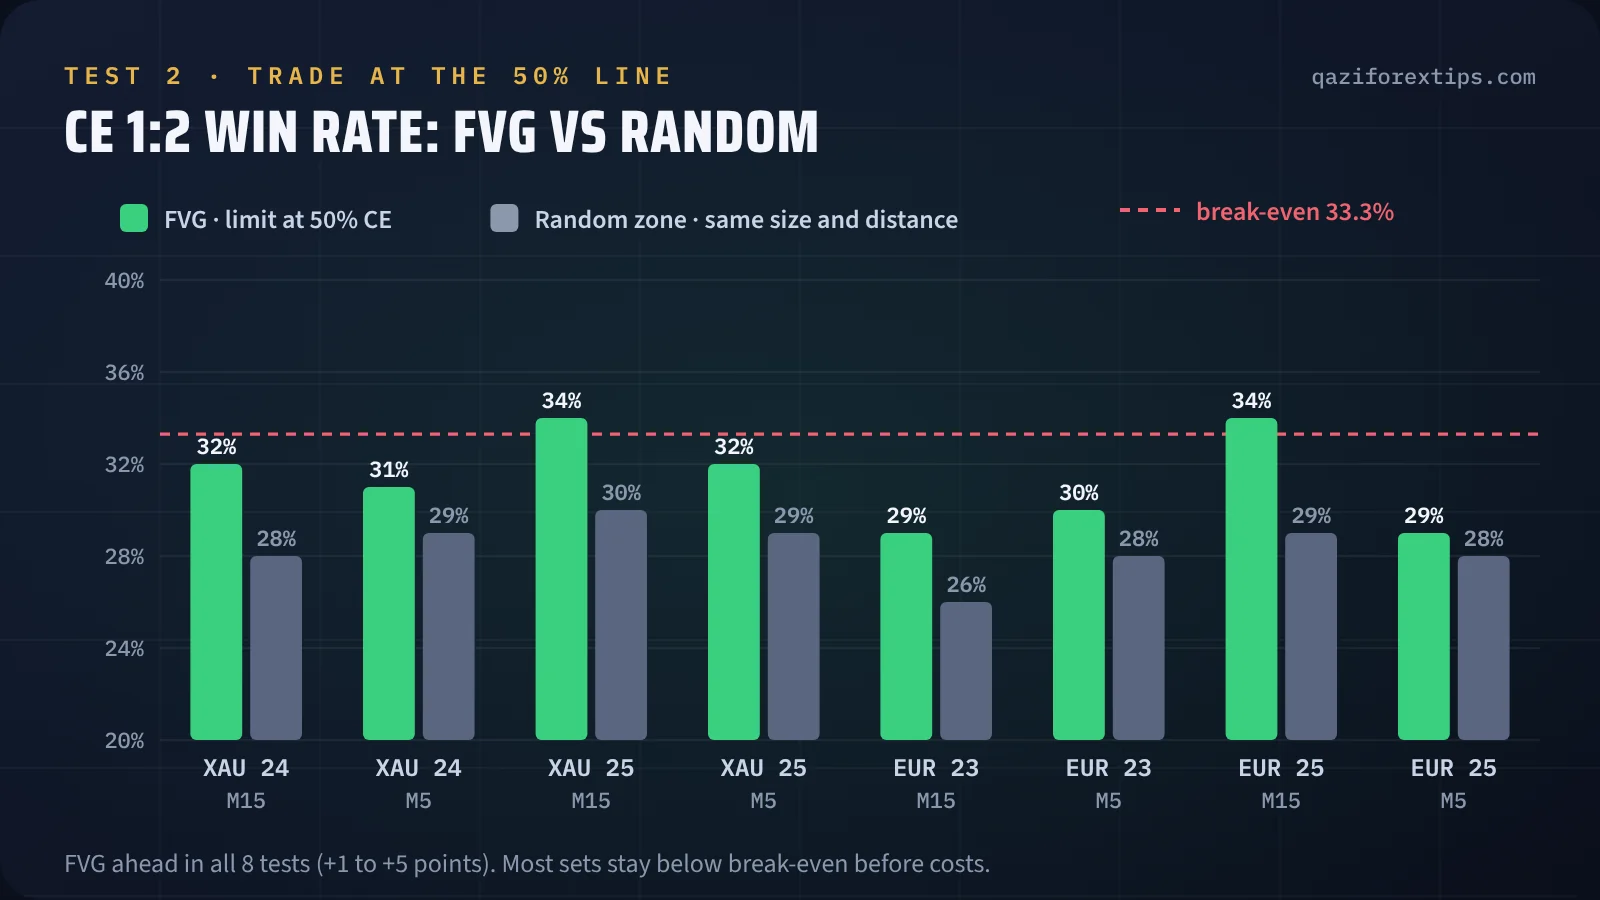
The CE trade told a different story. In every one of the 8 sets the fair value gap won more often than random zones, by 1 to 5 percentage points. Eight out of eight in the same direction is unlikely to be luck, so the 50% level of a gap does carry information.
Finding 3: a real edge, but not a strategy
At 1:2 you need to win 33.3% of trades just to break even before costs. The CE trade won about 31%, which works out to roughly 0.31 × 2 − 0.69 = −0.07R per trade before spread. Two sets (Gold 2025 M15 and EURUSD 2025 M15) reached 34%, still only a little above break-even.
In plain words: entering every fair value gap at 50% is not a way to make money by itself. The gap is a good place to look for a trade; the decision still needs market structure, liquidity and risk management.
Finding 4: trend and killzone filters did not help
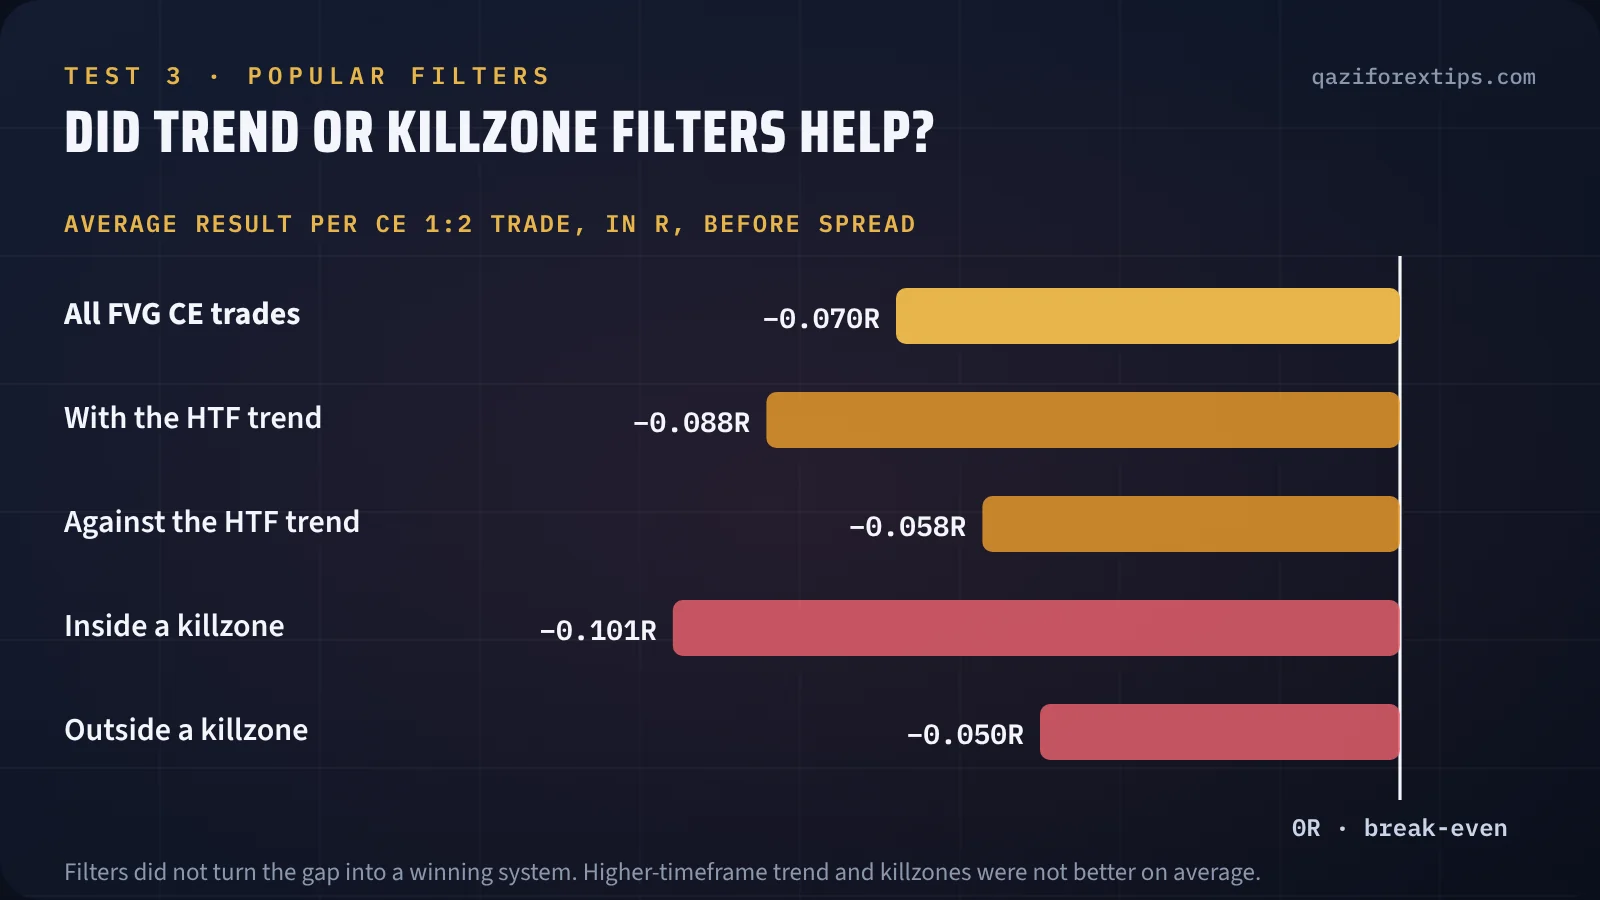
We also checked the filters many traders add. On average, CE trades taken with the higher-timeframe EMA 50 trend did not do better than those against it (about −0.088R vs −0.058R), and trades inside the London, New York and London Close killzones did worse than outside them (about −0.101R vs −0.050R). Other confluences we tried (a liquidity sweep before the gap, a break of structure, premium/discount, a higher-timeframe FVG nearby, a strong third candle, volume, impulse size) did not give a consistent improvement either.
This does not mean these ideas are useless in your trading; it means that, as simple mechanical filters on every gap, they did not add an edge in this data.
Finding 5: small samples mislead
When we looked at shorter windows of about 3,000 candles, the same CE test swung widely: on Gold M15 one window showed 43% for gaps against 31% for random zones, another showed 29% against 31%. Results from a few dozen trades, or from screenshots, can point either way. That is why the FVG Pro panel asks for 10,000 or more candles and colours a result only when the difference is larger than two standard errors.
What this means for your trading
- Plan fair value gap entries at the 50% (CE) line rather than at the first touch.
- Use the gap as a location, then require a reason: a liquidity sweep, a change of character, a higher-timeframe level. See our FVG guide and SMC guide.
- Keep the risk per trade small and fixed; a small edge only shows over many trades. Read risk:reward and break-even.
- Do not trust a "respected %" without a baseline, from any indicator, ours included.
- Test your own version: practise it candle by candle in a replay simulator and check the self-test panel on your symbol.
Limitations
- Two symbols, three years in total, M5 and M15 only. Other pairs, indices and timeframes can behave differently.
- HistData prices differ a little from any broker's feed; spread, commission and slippage are not included.
- The rules are mechanical. A discretionary trader who filters gaps by context is not tested here.
- Past data does not guarantee future results.
Run the test on your own chart
The free QFT FVG Pro indicator for MT5 and MT4 runs the same comparison live: for every gap it creates three random zones of the same shape and shows, on your symbol and timeframe, whether gaps beat them on the respected test and on the CE 1:2 trade test.
Khulasa (Roman Urdu / Hindi)
- Humne Gold aur EURUSD par 23,773 fair value gaps test kiye (2023–2025, M5 aur M15), har gap ko usi size ke random zones ke saath.
- 50% (CE) line par limit entry ne 8 mein se 8 tests mein random zones ko hara diya: 31% vs 28% (1:2 par).
- Sirf "touch karke bounce" random jaisa hi tha (42% vs 41%), is liye sirf "respected %" par bharosa na karein.
- Edge chhota hai: 1:2 par break-even 33.3% hai, is liye FVG akela strategy nahi. Structure, liquidity aur risk management saath lazmi.
- Trend aur killzone filter ne average mein faida nahi diya. Apne chart par FVG Pro ke self-test se khud check karein.
Questions
Do fair value gaps really work?
In our test of 23,773 gaps on Gold and EURUSD (2023–2025, M5 and M15), a limit order at the 50% line of a fair value gap won more often than the same trade on random zones in all 8 tests (31% vs 28% at 1:2). A simple touch-and-bounce was no better than random. So the edge is real but small: an FVG is a useful zone, not a complete strategy.
What is the best entry in a fair value gap?
In our data the 50% level, called consequent encroachment (CE), was the only entry that beat random zones in every test. Entering at the first touch of the gap did not.
Does trading FVGs in the killzone or with the trend improve results?
Not on average in our data. CE trades inside killzones averaged about −0.101R against −0.050R outside, and trades with the higher-timeframe trend about −0.088R against −0.058R against it. Test any filter on your own symbol before you rely on it.
Is a 31% win rate profitable at 1:2?
No. At 1:2 the break-even win rate is 33.3% before costs, so 31% is about −0.07R per trade before spread. That is why a fair value gap needs structure, liquidity and strict risk management around it.
Can I run this test on my own chart?
Yes. The free QFT FVG Pro indicator for MT5 and MT4 runs the same comparison against random zones on your symbol and timeframe. Use 10,000 or more candles so the numbers are reliable.
Research for education only, not financial advice. Results come from past data and mechanical rules, before trading costs, and do not guarantee future results. Trading forex, Gold and CFDs carries a high risk of loss.