 Qazi Forex Tips

My own entry rule on the M5 chart: an engulfing candle whose body fully covers the previous candle's body, with at least two opposite candles before it. The more opposite bodies it covers, the better the setup, and a doji counts for both sides.
Dr. Qazi's own entry rule
Read what the chart is doing now, on several timeframes, before any indicator or signal.
How Dr. Qazi teaches
What price action is
A price action trader makes decisions from the bars on the chart: the levels where price reacted before, the direction of the swings and the candles that form at those levels. Indicators are calculated from the same prices, later. Price action reads the source directly.
It works on forex pairs, Gold, indices and crypto, on any timeframe, because every market leaves the same footprints: trends, ranges, levels and reactions. Start with price action and technical analysis (Lecture 2 of our basic course).
1. Candles: what each bar tells you
- Body shows who won the period: a big green body means buyers were in control from open to close.
- Wicks show where price was rejected. A long lower wick at support says sellers pushed down and buyers pushed back.
- Rejection candle (pin bar): a small body with a long wick into a level.
- Engulfing / momentum candle: a body that covers the previous candle's body, showing a strong shift.
A candle means little on its own; the same pin bar is strong at a higher-timeframe level and meaningless in the middle of a range. Lesson: rejection and momentum candles.
2. Swings and market structure
Mark the swing highs and lows first. Higher highs and higher lows make an uptrend; lower highs and lower lows make a downtrend; overlapping swings make a range.
When an uptrend fails to make a new high and then breaks its last higher low, the structure has changed. Trade with the structure, and treat a break against it as a warning, not an instant reversal. Lessons: market structure and trend reversal. The same ideas, with new names, are the base of Smart Money Concepts.
3. Levels: where to trade
- Horizontal support and resistance: clear swing points where price turned more than once. Old resistance often becomes new support after a breakout (role reversal).
- Supply and demand zones: the base of a strong move, drawn as a zone, not a thin line.
- Trendlines and channels: dynamic levels that follow the swings.
- Round numbers and the previous day's high and low, where many orders sit.
Fewer, cleaner levels are better than many. Lessons: support and resistance, types of levels, trendlines and price channels.
4. Multiple timeframes: direction, setup, entry
- Higher timeframe (Daily or H4): trend and the main levels.
- Middle timeframe (H1): the setup, price arriving at a level in the trend direction.
- Lower timeframe (M15 or M5): the entry candle and a tight stop.
A buy signal on M5 that runs straight into H4 resistance is a poor trade. Lessons: multi-timeframe analysis and top-down analysis.
5. Entry triggers
- Rejection at a level in the trend direction.
- Engulfing candle after a pullback into the level.
- Breakout and retest: price breaks a level, comes back to test it from the other side, and holds.
- False breakout: price breaks a level, fails and closes back inside, trapping breakout traders.
Wait for the candle to close before you act on it. Lessons: breakout strategy and false breakouts.
6. Chart patterns
Patterns are price action on a bigger scale. Each one has a clear place to enter, a stop and a target:
| Pattern (video lesson) | Usually |
|---|---|
| Head and shoulders | Reversal at the end of an uptrend |
| Inverse head and shoulders | Reversal at the end of a downtrend |
| Triangles | Breakout, often in the trend direction |
| Wedges | Reversal or continuation, depending on the trend |
| Flags | Continuation after a strong move |
| Quasimodo (QM) | Reversal after a liquidity grab |
7. Fibonacci as confluence
Fibonacci retracement measures how deep a pullback goes. The 38.2%, 50% and 61.8% levels are watched by many traders, but a Fibonacci level alone is not a reason to trade. It becomes useful when it lines up with a support or resistance level in the trend direction. Lessons: Fibonacci retracement and the step-by-step guide.
8. Stop loss, target and lot size
- Stop loss beyond the level or the swing that proves the idea wrong, with a small buffer.
- Target at the next real level, ideally at least twice the stop distance.
- Lot size from your fixed risk and the stop distance, never the other way round.
Lessons and guides: stop loss and take profit, risk management and the lot size calculator.
Worked example on EURUSD
A hypothetical example with round numbers, to show the steps and the arithmetic. It is not a trade signal.
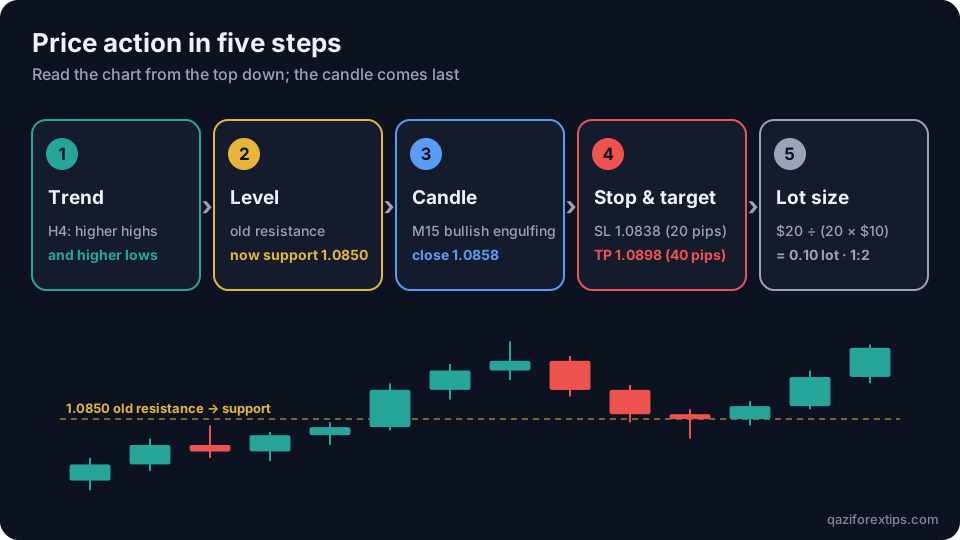
- H4: uptrend with higher highs and higher lows. The last breakout cleared resistance at 1.0850, and the 61.8% Fibonacci level of the latest swing sits close to it.
- H1: price pulls back to 1.0850, the old resistance that should now act as support.
- M15: a bullish engulfing candle forms at the level and closes at 1.0858.
- Entry 1.0858. Stop loss 1.0838, below the pullback's swing low: 20 pips. Target 1.0898, the previous high: 40 pips. Risk:reward 1:2.
- Lot size for a $20 risk: a standard lot of EURUSD is about $10 per pip, so 20 pips cost $200 per lot. $20 ÷ $200 = 0.10 lot.
If the engulfing candle never comes, there is no trade. If price closes back below the level, the stop takes the planned $20 loss.
Price action for your style
- Scalping (M1–M5): the same levels and candles, smaller stops and stricter hours. Price action scalping.
- Day trading (M15–H1): one or two setups a day around the London and New York sessions. Price action day trading.
- Swing trading (H4–Daily): fewer trades, wider stops, smaller lots.
For scalpers on Gold, see our Gold trading guide and the best hours to scalp.
Common price action mistakes
- Drawing a level at every small turn until the chart is full of lines.
- Trading a perfect candle in the middle of nowhere instead of at a level.
- Fighting the higher-timeframe trend.
- Entering before the candle closes.
- Placing the stop exactly at the level, where everyone else's stop is.
- Changing the method after three losses instead of testing it on 50–100 examples.
More in key points for price action traders.
Learn price action step by step
Our three free courses follow this order, in Urdu / Hindi with written notes for every lecture:
- Price Action Mastery Basic (11 lectures): basics, support and resistance, trendlines, candles, Fibonacci and entries.
- Price Action Mastery Advance (9 lectures): channels, triangles, wedges, head and shoulders, market structure and the Quasimodo.
- Trading Strategies (10 lectures): complete strategies with rules, including breakout and Gold scalping.
- Then test your rules on past data: backtesting and the replay simulator.
Khulasa (Roman Urdu / Hindi)
- Price action: indicators ke baghair seedha chart parhna: level kahan hai, swings kis taraf ja rahe hain, aur level par candle kya bata rahi hai.
- Candle: body batati hai kaun jeeta, wick batati hai kahan rejection hua. Pin bar aur engulfing sirf level par maana rakhte hain.
- Swings: HH aur HL = uptrend, LH aur LL = downtrend, aapas mein milte swings = range.
- Levels: support/resistance, purani resistance naya support (role reversal), supply/demand zone, trendline, round number aur pichle din ka high/low.
- Kam aur saaf levels behtar hain. Chart lakeeron se na bharein.
- Timeframes: Daily/H4 par trend aur levels, H1 par setup, M15/M5 par entry candle.
- Entry: level par rejection, pullback ke baad engulfing, breakout ke baad retest, ya false breakout. Candle close ka intezar karein.
- Patterns: head and shoulders aur inverse = reversal, triangle aur flag = aksar continuation, wedge dono, QM = liquidity grab ke baad reversal.
- Fibonacci 38.2/50/61.8% akela kafi nahi; jab level ke sath mile tab faida deta hai.
- SL us level ya swing se aage jo idea ghalat sabit kare; target agla asal level, kam az kam 1:2; lot size risk aur SL se.
- Misaal: EURUSD 1.0858 par buy, SL 1.0838 (20 pips), TP 1.0898 (40 pips) = 1:2. $20 risk par 0.10 lot.
- Seekhne ki tarteeb: Basic (11) → Advance (9) → Strategies (10) lectures, phir backtest aur simulator par practice.
Questions
What is price action trading?
Trading decisions made from the price chart itself: levels, the direction of the swings and the candles at those levels, without depending on indicators.
Can I learn price action in Urdu or Hindi?
Yes. Our three free courses teach price action in Urdu / Hindi on YouTube, and every lecture has written notes and questions on this website. This guide also has a Roman Urdu / Hindi summary.
Is price action better than indicators?
Indicators are calculated from price and react later. Many traders use price action for decisions and at most one or two indicators as a filter. What matters most is written rules and risk management.
Which timeframe is best for price action?
Use a higher timeframe such as H4 or Daily for direction and levels, and M15 or M5 for entries. Scalpers go down to M1, swing traders stay on H4 and Daily.
What are the best price action entry signals?
A rejection or engulfing candle at a higher-timeframe level in the trend direction, and a breakout followed by a retest. The level matters more than the candle.
Does price action work for Gold (XAUUSD)?
Yes. Gold respects levels, structure and sessions like forex pairs, but moves more per day, so stops and lot sizes must be adjusted.
Is Smart Money Concepts the same as price action?
SMC is price action with its own names: a liquidity sweep is a false breakout, an order block is a supply or demand zone, and a CHoCH is a change of market structure.
How long does it take to learn price action?
The basics take a few weeks; consistent use takes months of practice. Backtest your rules on 50–100 examples before trading them with real money.
Is price action trading profitable?
No method is profitable by itself. Results depend on clear rules, risk management and discipline. Practise on a demo account or in a simulator first.
Watch the video lessons
 What is price action, and why technical analysis mattersVideo lesson · 40:35
 Support and Resistance: how to draw it, and why it failsVideo lesson · 25:34
 Market structure explained: the key to direction and entriesVideo lesson · 39:13
 Rejection and momentum candles for a precise entryVideo lesson · 32:31
 Rule-based multi-timeframe analysis (top-down)Video lesson · 1:09:20
 The most important points for a price action traderVideo lesson · 22:51
 Breakout trading strategy with market structureVideo lesson · 20:41
 Price action strategy for day traders and scalpers
Education only, not financial advice. Trading forex, Gold and CFDs carries a high risk of loss. Contract sizes, spreads and leverage differ by broker; check your own broker's specifications.