 Qazi Forex Tips

Why backtest?
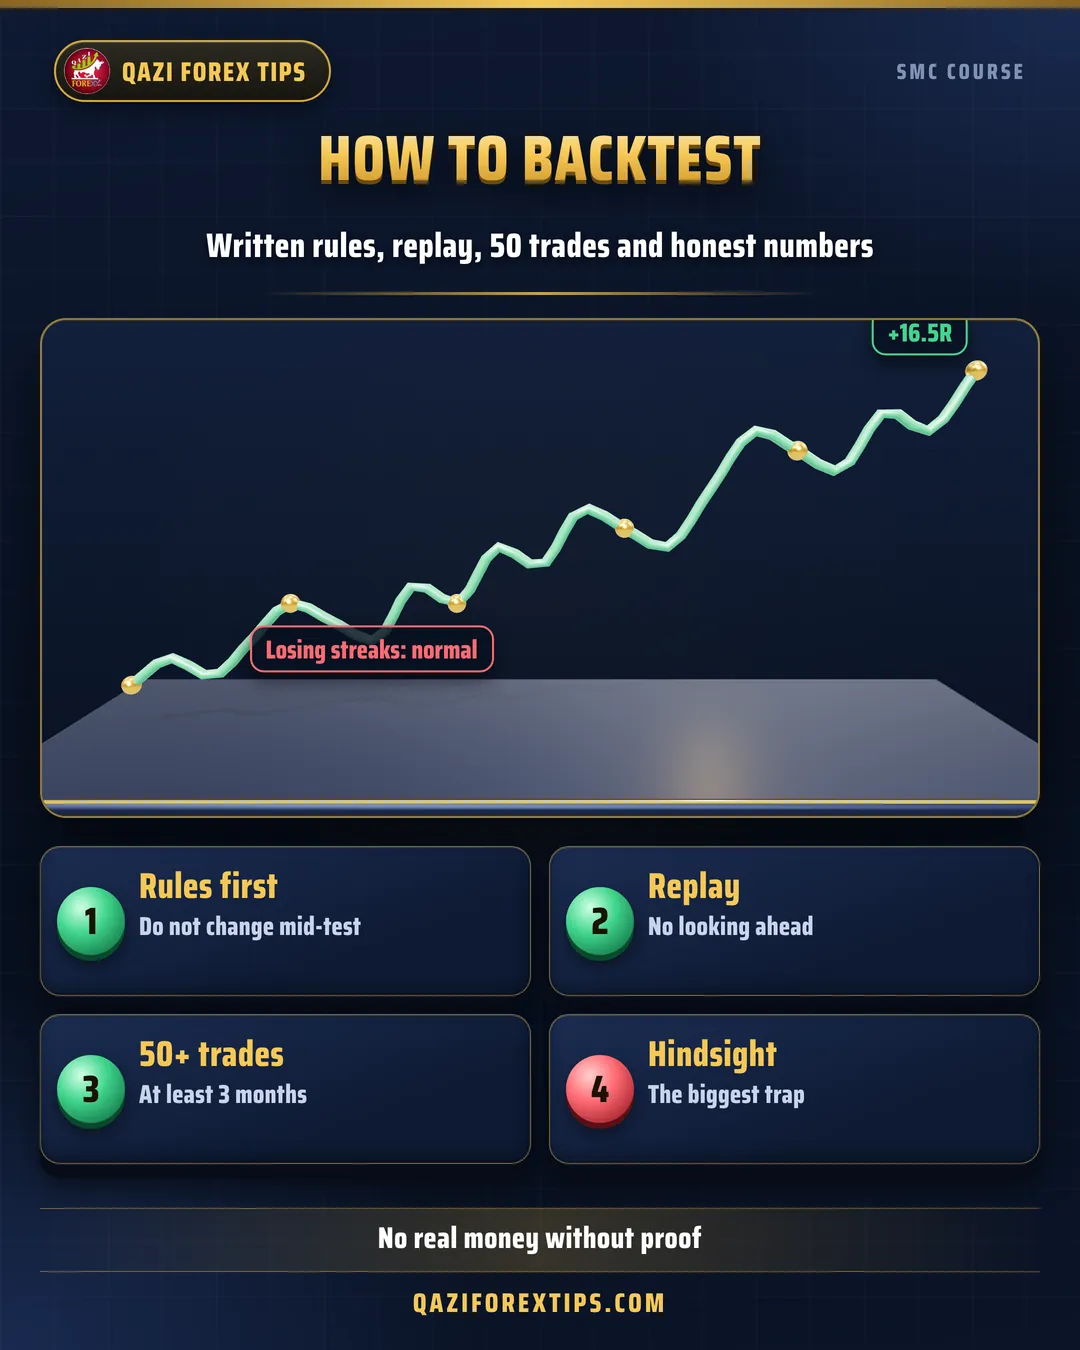
Trading live without a backtest is travelling without a map. A backtest gives you three things:
- Proof: whether your rule actually has an edge.
- Numbers: win rate, average RR, losing streaks, so a bad week live does not panic you.
- Skill: after 100 backtested trades your eye recognises setups much faster.
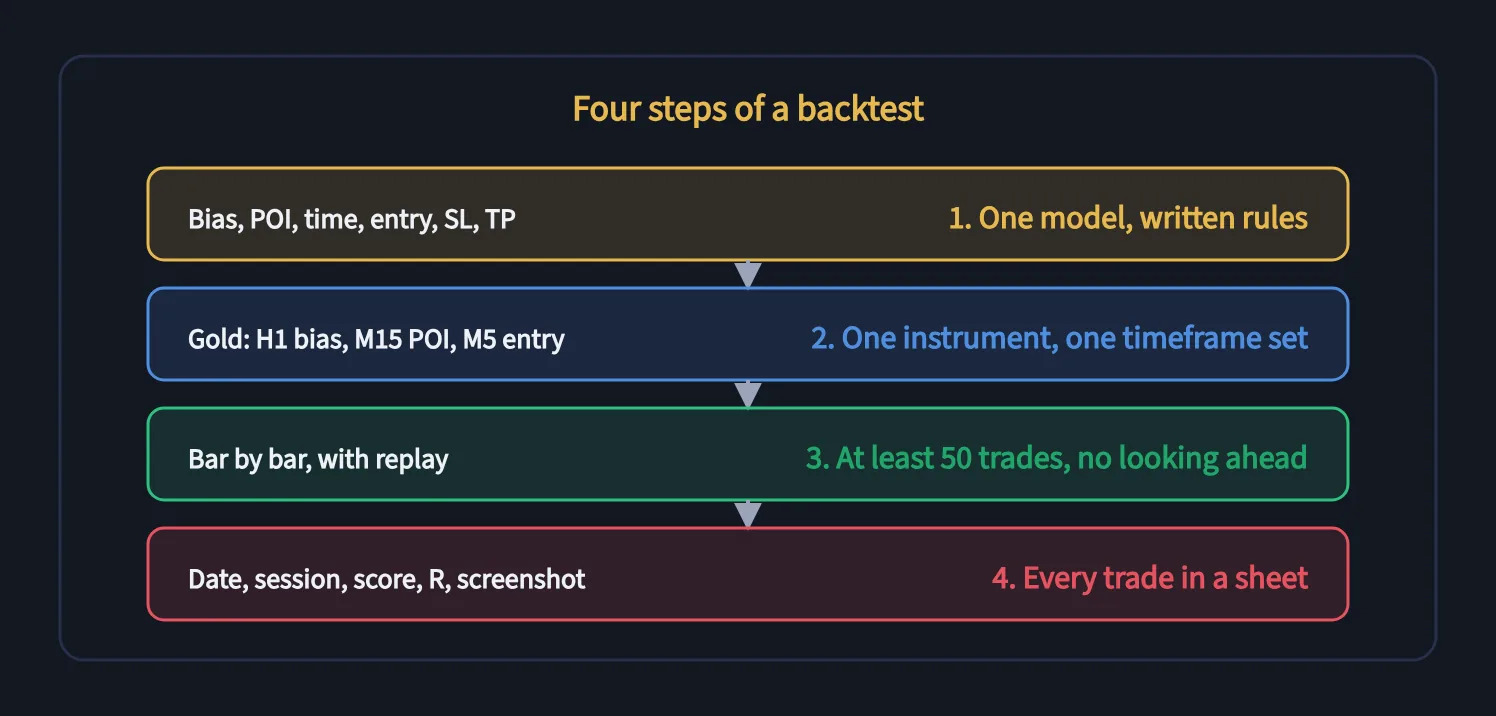
Four steps of a backtest
1. Write the rules first
Write your one-page rule (lesson 5.5) before starting. Do not change it during the backtest. If you want to change it, start a new backtest.
2. One instrument, one timeframe set
Only Gold, and one set (for example H4, H1, M15, M5). Mixing instruments tells you nothing.
3. No looking ahead, bar by bar
- TradingView: use "Bar Replay" to jump to a past date and move forward candle by candle.
- MT5: the strategy tester's visual mode or a manual backtesting tool.
- Most important: keep the right side of the chart hidden. If you see where price went, your brain will pick the "right" setups automatically. This is hindsight bias.
4. Log every trade
A sheet with: date, day, session, model, POI score, entry, SL, TP, result in R, screenshot link, note.
How many trades are enough?
| Trades | What you can say |
|---|---|
| Under 20 | Nothing; could be luck |
| 50 | An early estimate |
| 100 | A reliable picture |
| 200+ | Covers different conditions (trend, range, news) |
At least 50 trades over at least 3 months of data, so both trending and ranging markets are included.
Which numbers to look at
| Number | Meaning | Good |
|---|---|---|
| Win rate | Percentage of winners | Read it with RR |
| Average RR | Average win in R | 2 or more |
| Expectancy | Win rate × average win − loss rate | +0.3R or more |
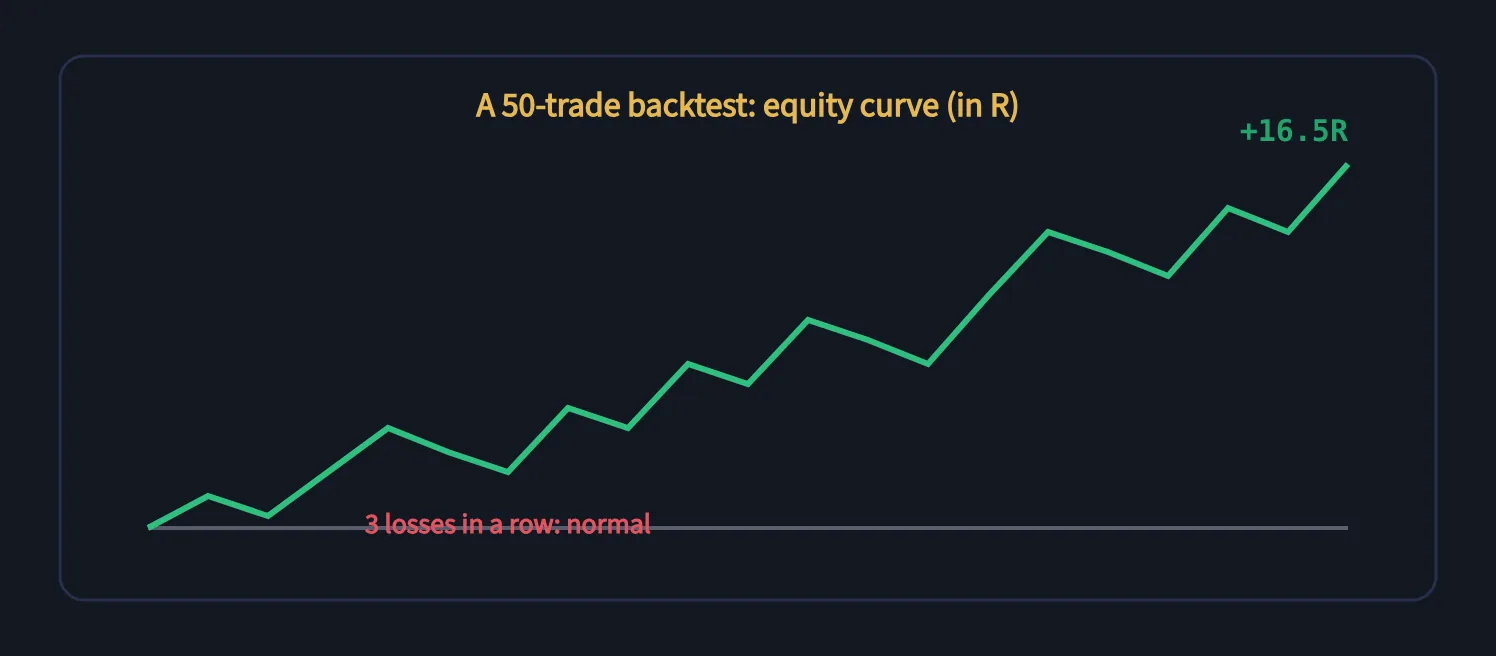
| Longest losing streak | Longest run of losses | For mental preparation |
| Maximum drawdown | Largest drop (in R) | Compare with your risk limits |
| Session and day | Where it is better or worse | Remove weak sessions |
Backtesting traps
What to do with the result
- Expectancy positive (+0.3R or more): move to a demo forward test (lesson 7.3).
- Near zero: find which session, day or POI type loses most. Make one change and test a new 50 trades.
- Negative: the rule is not ready. Check the basics: bias or POI quality.
Gold example: a 50-trade summary
Model B, H1 POI with M5 CHoCH, London and New York killzones only, 3 months:
- Trades: 50 | Wins: 21 (42%) | Losses: 29
- Average win: +2.6R | Loss: −1R
- Expectancy: 0.42 × 2.6 − 0.58 × 1 = +0.51R
- Total: about +25.6R; at 1% risk roughly +25% in three months (without compounding)
- Longest losing streak: 6 | Maximum drawdown: −7R
- Sessions: London +18R, New York +7.6R
Lesson: a drawdown of up to 7% is possible at 1% risk; knowing this, you will not abandon the system in panic after 6 losses live.
Real Gold chart examples
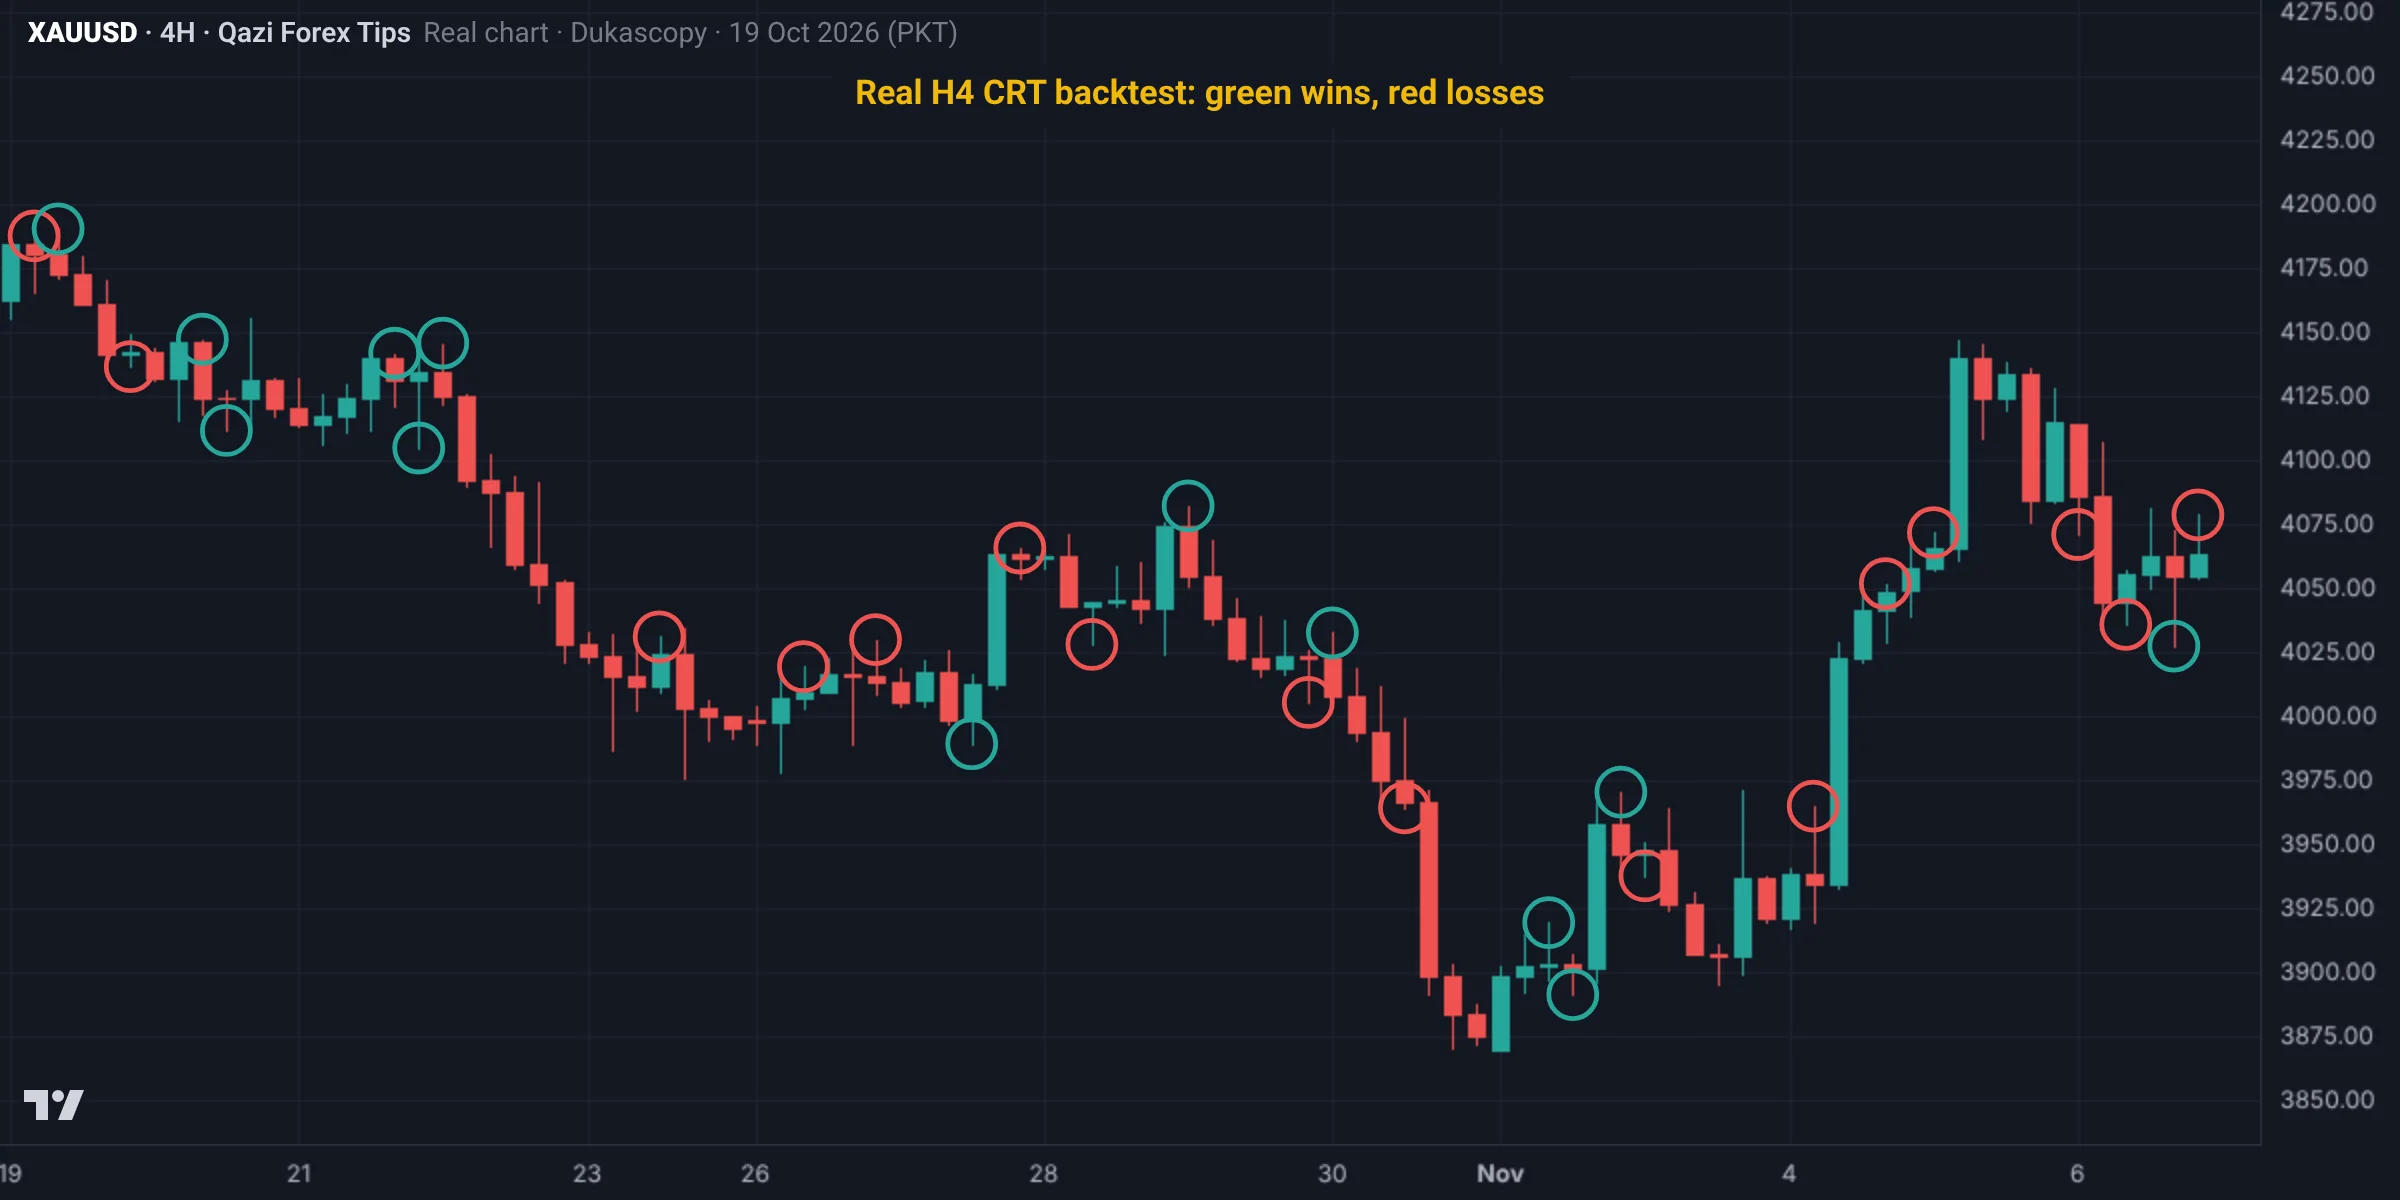
This is a real backtest: a mechanical model E (CRT) rule on Gold H4, from 17 Sep 2026 to 10 Nov 2026 (data: Dukascopy, bid price; Pakistan time). Rule: candle 1 at least $20; candle 2 sweeps one edge and closes inside; entry at candle 2's close; SL beyond candle 2's extreme; TP at candle 1's other edge; zero if nothing happens within 6 candles. No bias, time or liquidity filter.
| Number | Result |
|---|---|
| Total trades | 62 |
| Wins | 26 (42%) |
| Losses | 36 |
| Average win | +1.3R |
| Total | -3.2R |
| Expectancy | -0.05R per trade |
| Longest losing streak | 6 |
Result: unfiltered CRT lost slightly over these two months. We also tried an RR filter (at least 1:1 and 1:1.5) and it was still negative. That is the value of a backtest: before risking real money, you learn this rule is not enough on its own. Next step: add one filter (only in the H4 bias direction, or only sweeps in a killzone) and retest on more months. Two months and 62 trades are an early estimate, not a final verdict.
Second example: results by direction
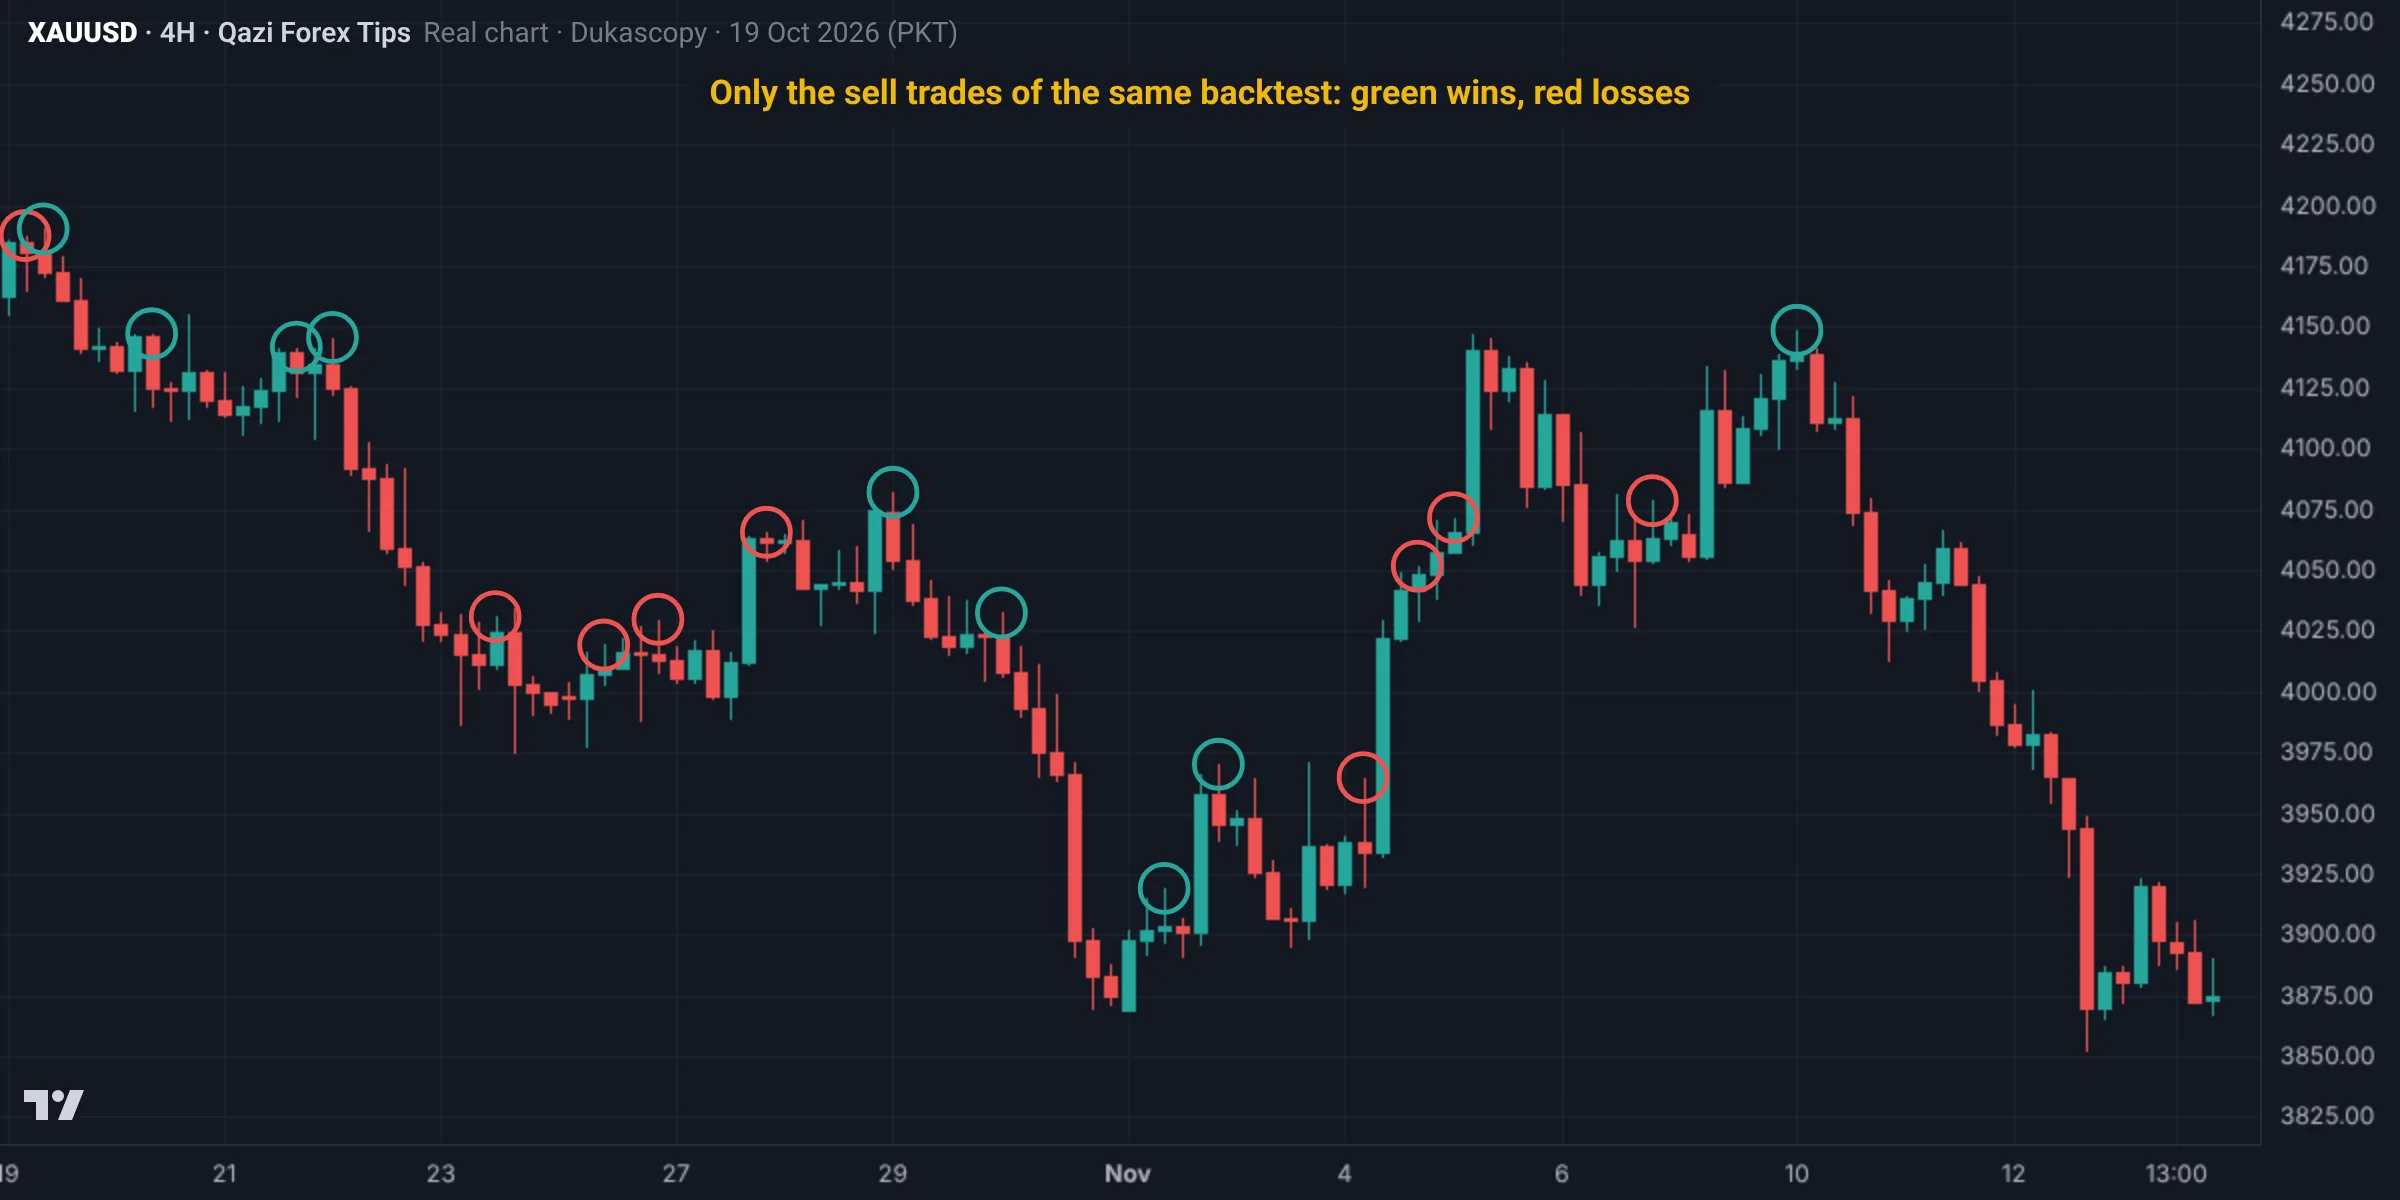
The first example was the full CRT backtest. Now we split the same data by direction, because one direction often behaves very differently from the other (data: Dukascopy, bid price; Pakistan time):
| Number | Sells only (bearish CRT) | Buys only (bullish CRT) |
|---|---|---|
| Trades | 35 | 27 |
| Wins | 16 (46%) | 10 (37%) |
| Total | 3.1R | -6.3R |
| Expectancy | 0.09R per trade | -0.23R per trade |
How to read it: over these two months Gold mostly fell, so the sell CRTs did better than the buy CRTs. That is a glimpse of the "trade with the trend" rule, not proof: there are only 35 and 27 trades, all from one period. The next step is the one from the first example: write down one filter (such as H4 bias) in advance and retest on new months. Choosing a filter after seeing the result is fooling yourself.
Summary
- Write the rule first and do not change it mid-test.
- One instrument, one timeframe set, replay without looking ahead.
- At least 50 trades over 3 months; check win rate, average RR, expectancy, losing streak and drawdown.
- Avoid hindsight, overfitting, chosen dates and forgetting the spread.
Free downloads
Print them or keep them on your phone. No sign-up, no email.
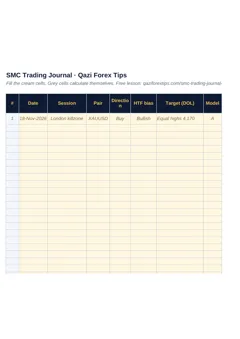
Trading Journal Sheet (Excel)
One row per trade with dropdowns and automatic maths: win rate, total R, expectancy, drawdown, results by session and emotion, weekly review. Works in Excel and Google Sheets.
Free downloadاردو میںTry this lesson on your own chart
Qazi Forex Tips' own tools that make this lesson easier. A tool helps; your rules make the decision.
QFT Replay Simulator
Free demo · MT5 & MT4Replay any past day candle by candle, up to 4 pairs at once, with killzones and news on the chart and a report with equity curve and Monte Carlo test.
Details and downloadSpot it on the chart: practice
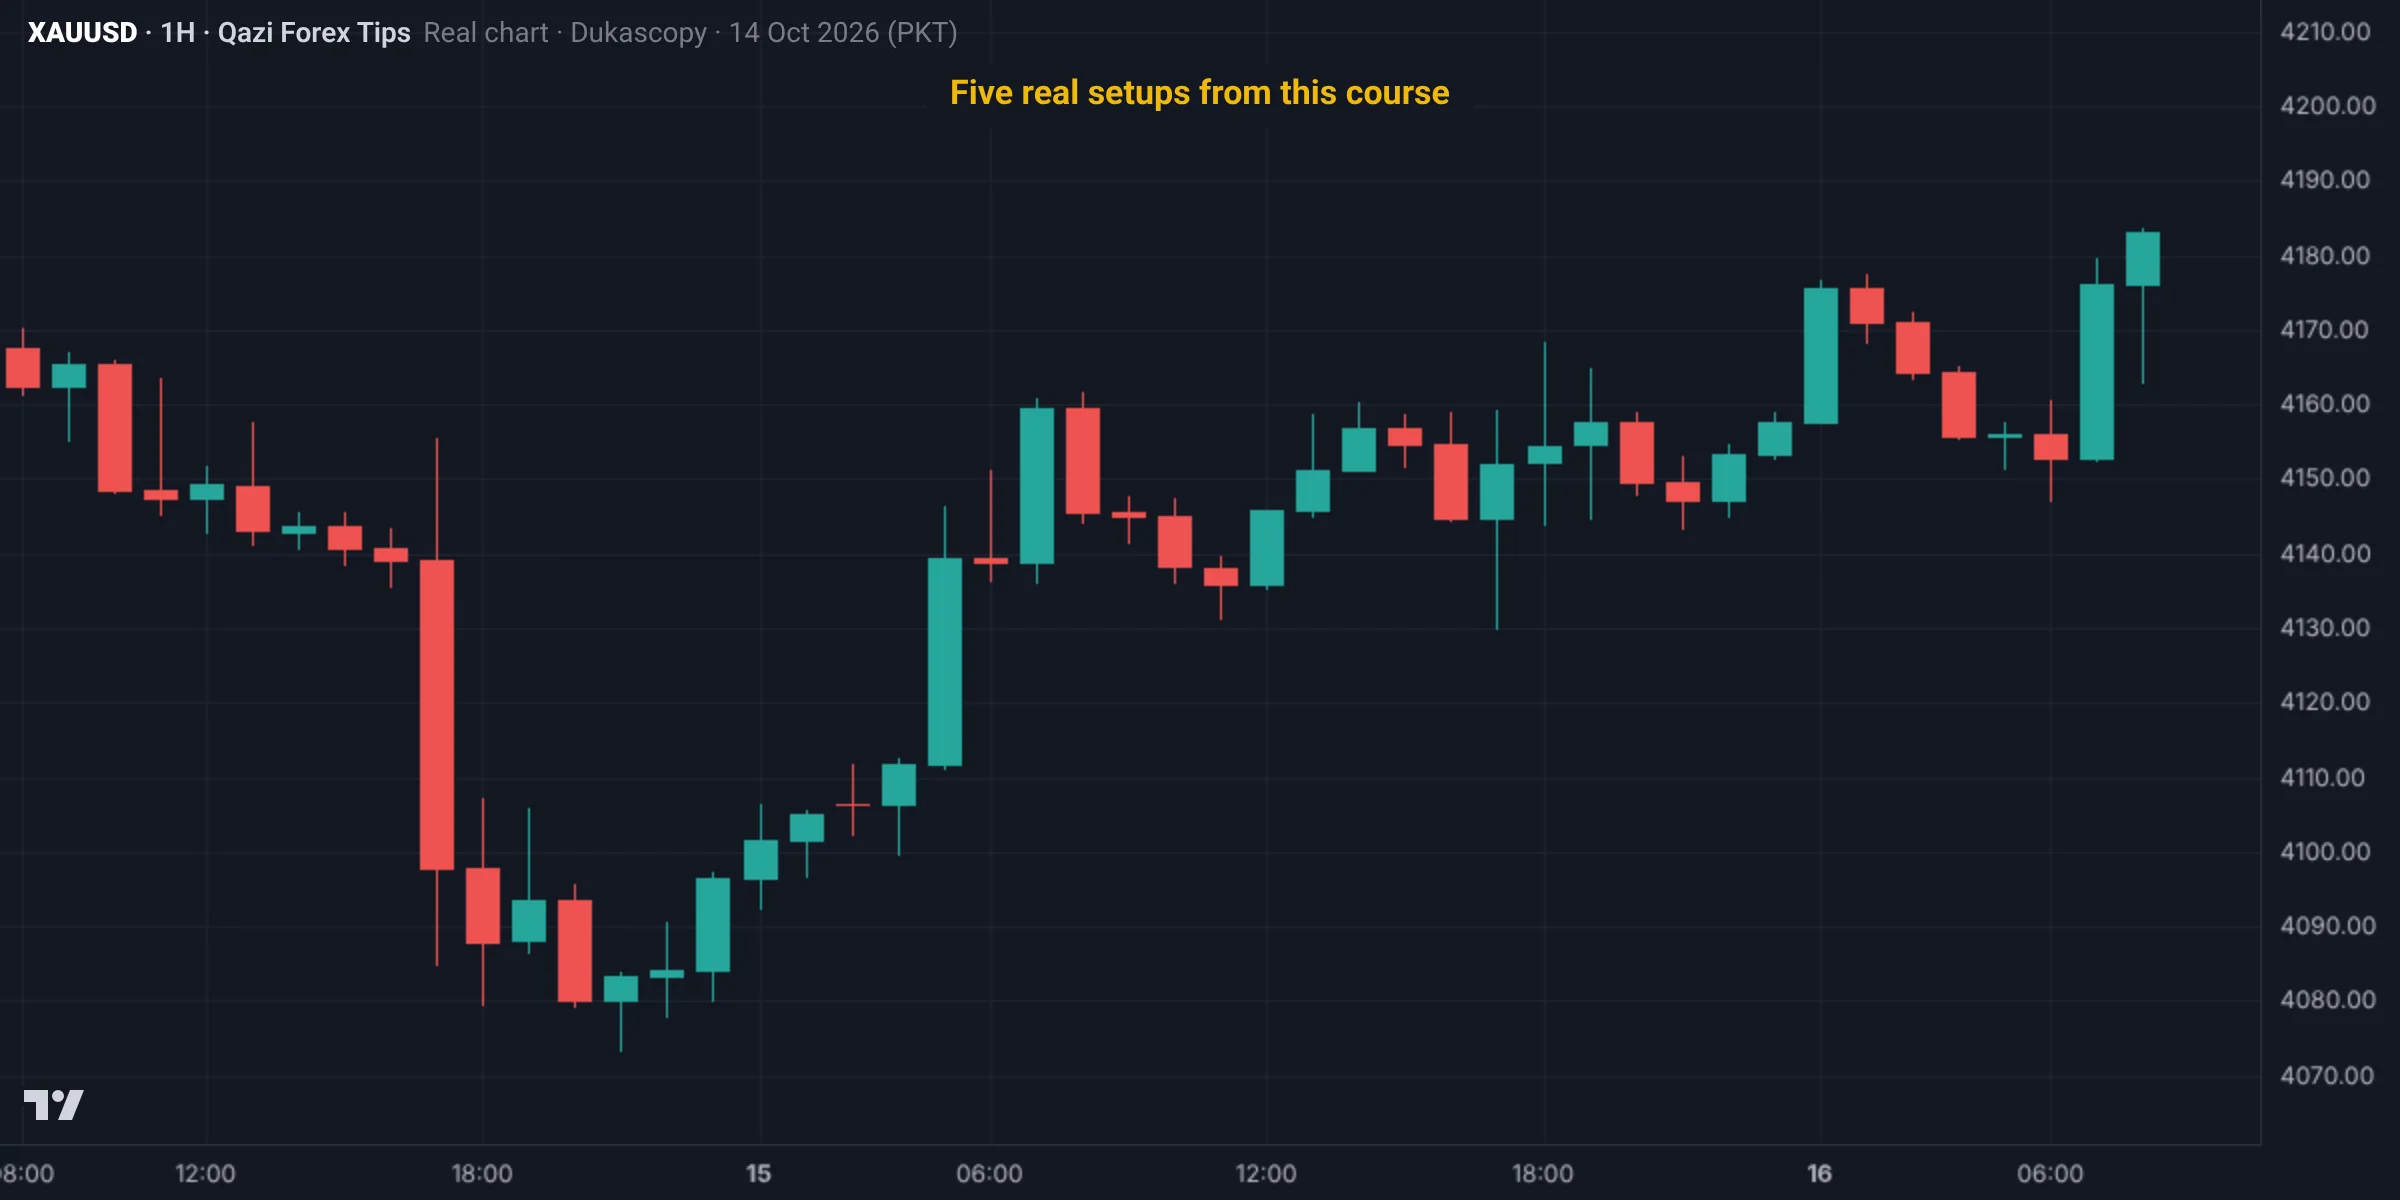
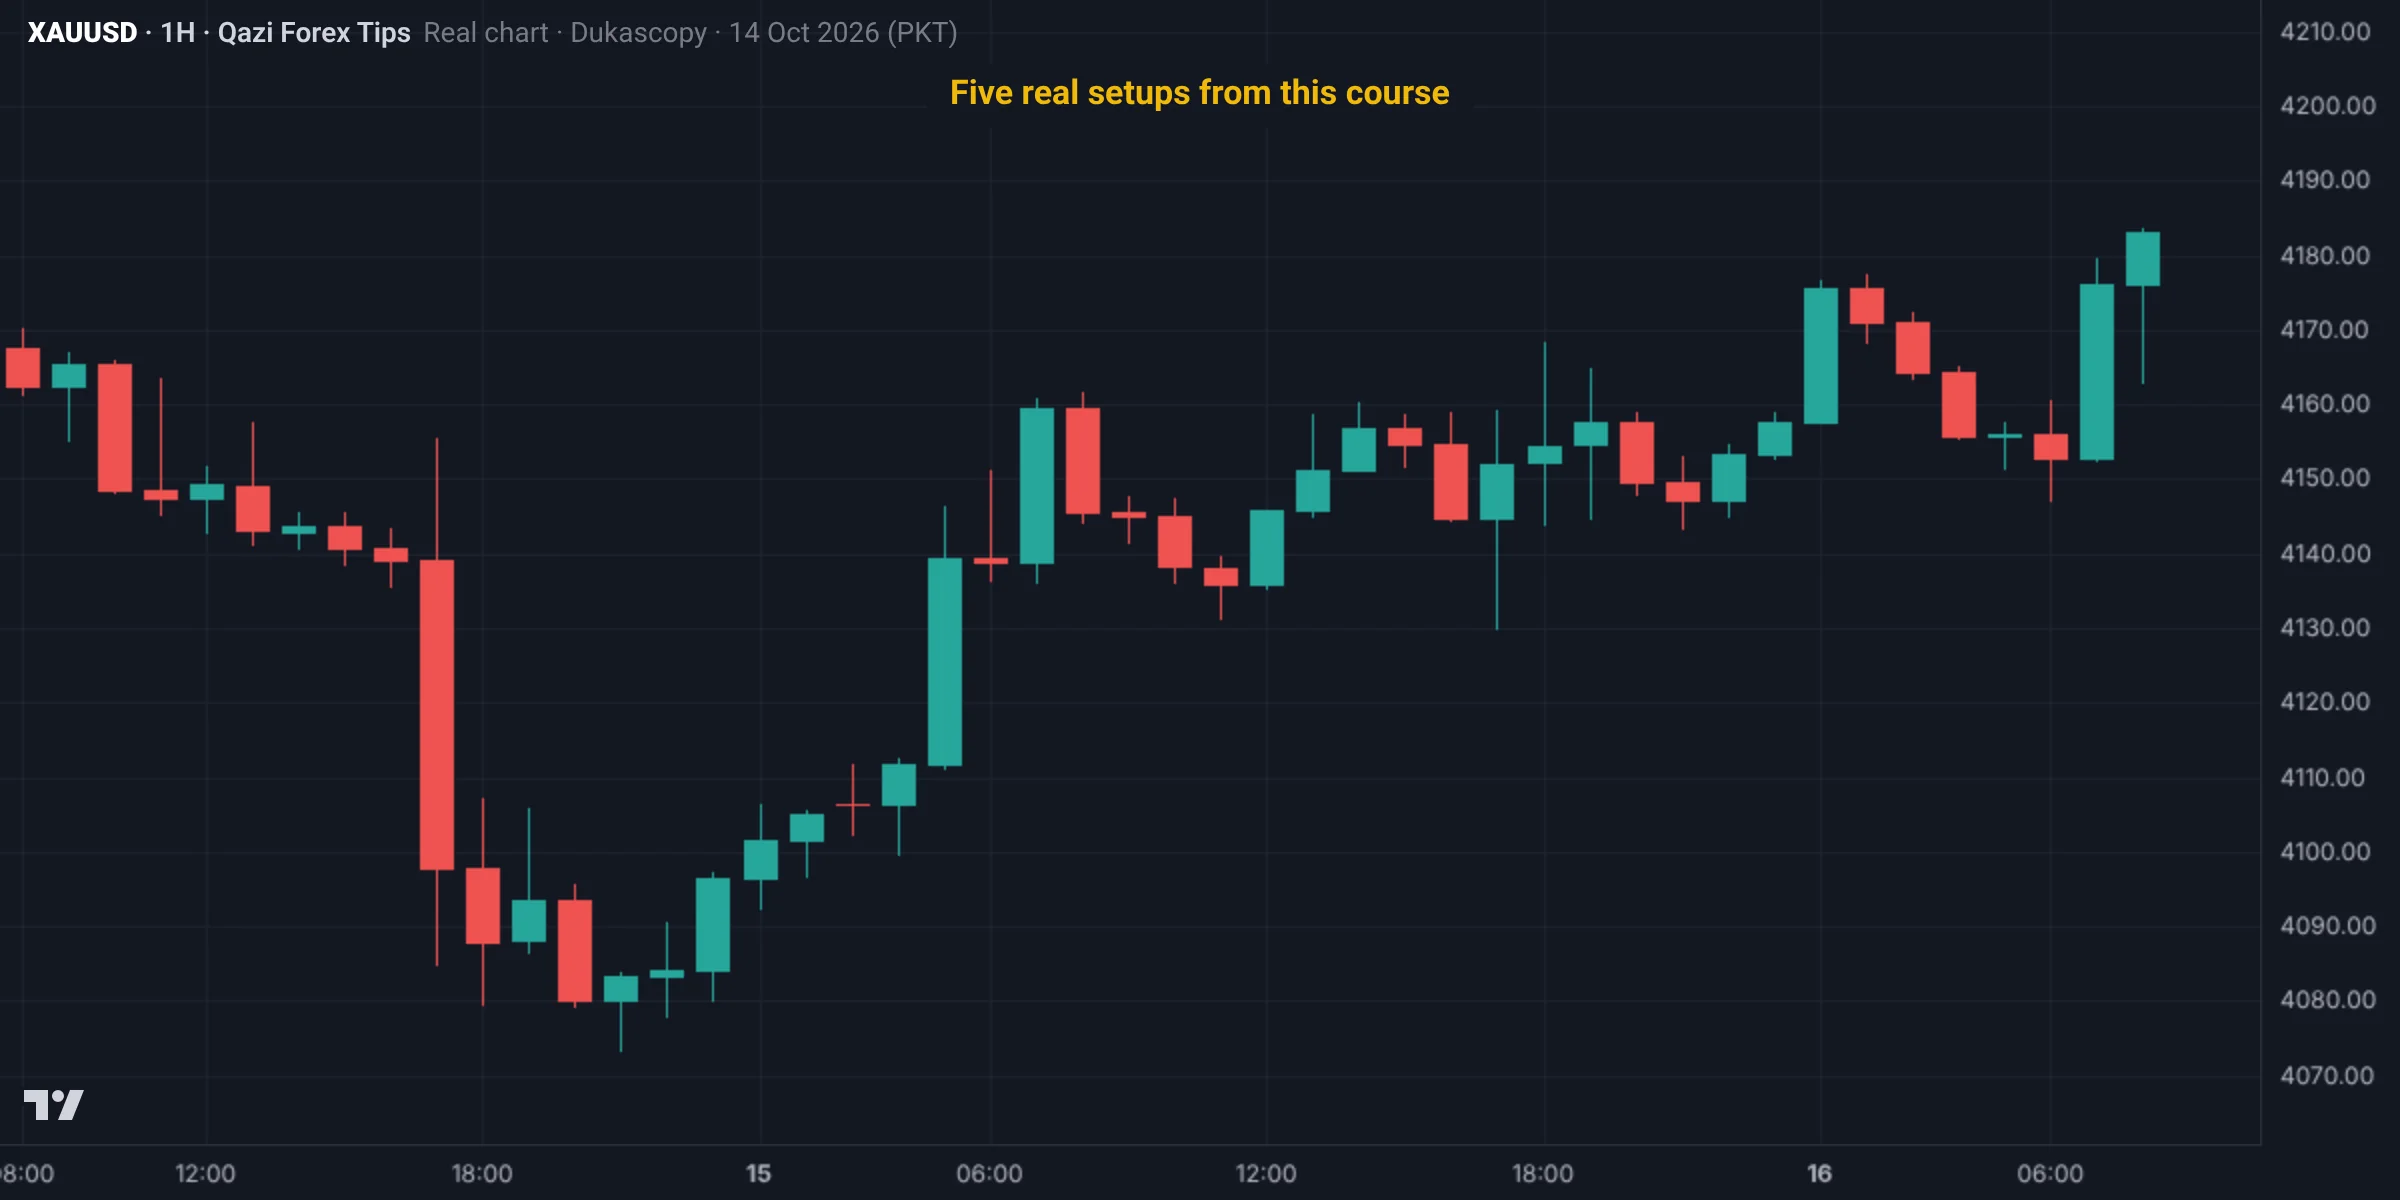
This is a real Gold chart (Dukascopy data, Pakistan time). Study it and pick an answer. After you answer, the fully marked chart and the explanation appear.
Five backtest trades returned: +3.2R, -1.0R, +2.5R, -1.0R, -1.0R. What is the expectancy (average per trade)? (Formula: win rate × average win − loss rate)
Win rate 40%, average win 2.85R, loss rate 60%: 0.4 × 2.85 − 0.6 = 0.54R per trade. But remember: 5 trades can be luck; a reliable picture needs at least 50 to 100 trades.
The marked chart
Test yourself: Lesson 7.1 quiz
9 questions. Pick one answer for each and you will see at once whether it is right and why. Your score and grade appear at the end. You need 70% to pass.
0 correct · 0 / 9
Question 1What three things does a backtest give you?
Trading live without a backtest is travelling without a map.
Question 2If you want to change the rules during a backtest?
Adding a filter after every loss is overfitting: rules fitted to the past, not the future.
Question 3What is hindsight bias and how do you avoid it?
Use TradingView Bar Replay or MT5 visual mode.
Question 4At how many trades do you get a reliable picture?
Under 20 could be luck; 50 is an early estimate; 200+ covers conditions; at least 50 trades over 3 months.
Question 5What is the expectancy formula?
+0.3R or more is good.
Question 6How do you account for spread and slippage in a backtest?
Record partial profits exactly as you would live.
Question 7What if expectancy is near zero?
If positive (+0.3R+), move to a demo forward test; if negative, check the basics.
Question 8Model B, 50 trades: 42% wins, average win +2.6R. What is the expectancy?
0.42 × 2.6 − 0.58 = 0.51; longest losing streak 6, maximum drawdown −7R.
Question 9What is the benefit of knowing your drawdown and losing streak?
At 1% risk a drawdown of up to 7% is possible; knowing it keeps you prepared.
Lesson checklist
Tick each point once you understand it. Your ticks are saved in this browser.
Assignment
- Build a backtest sheet (date, session, model, score, entry, SL, TP, R, screenshot, note).
- Start TradingView replay on Gold from a date three months ago.
- Complete 50 trades on your rule.
- Calculate win rate, average RR, expectancy, losing streak and drawdown.
- Post your summary numbers in the group.
Post your assignment screenshots with your reasons in our free Facebook group, where your charts will be checked.
Join the free group
Who wrote this lesson
Dr. Qazi Abdul Basit, Ph.D
Ph.D in Business Administration and a forex and Gold trader since 2013. Founder of Qazi Forex Tips, which teaches traders in Pakistan and India price action, risk management and trading psychology in their own language: 65 student batches so far, free courses on YouTube, and MT5 tools for traders (QFT Replay Simulator, QFT Trade Assistant).
- 2013 trading since
- 75K+ Facebook group members
- 65 student batches
- 15K+ YouTube subscribers
How this lesson was made: the content follows Dr. Qazi's teaching method and years of trading. Real charts are built from Dukascopy Gold (XAUUSD) data, and backtest results are shown as they came out, even when negative. We do not sell signals, manage accounts or take money from any broker. Last updated: 19 November 2026.
Questions
How do you backtest SMC?
Write your rules first, use bar replay on one instrument and one timeframe set without looking ahead, log every trade, and test at least 50 trades over three months.
What numbers matter in a backtest?
Win rate, average reward to risk, expectancy per trade, longest losing streak and maximum drawdown.
What is hindsight bias?
Choosing setups after seeing what price did next, which makes a backtest look better than reality.
Is there free backtesting software for MT5?
MT5's own Strategy Tester (visual mode) is free and replays old charts candle by candle. Our QFT Replay Simulator goes further, with 4 pairs at once and a full report, and has a free demo.
What is the difference between backtesting and forward testing?
Backtesting is on past charts; forward testing is in today's market on demo or a small account. Go live only when both give similar results.
Read more
Education only, not financial advice. Trading forex, Gold and CFDs carries a high risk of loss. SMC concepts describe tendencies, not guarantees. Lesson 35 of 38.