 Qazi Forex Tips

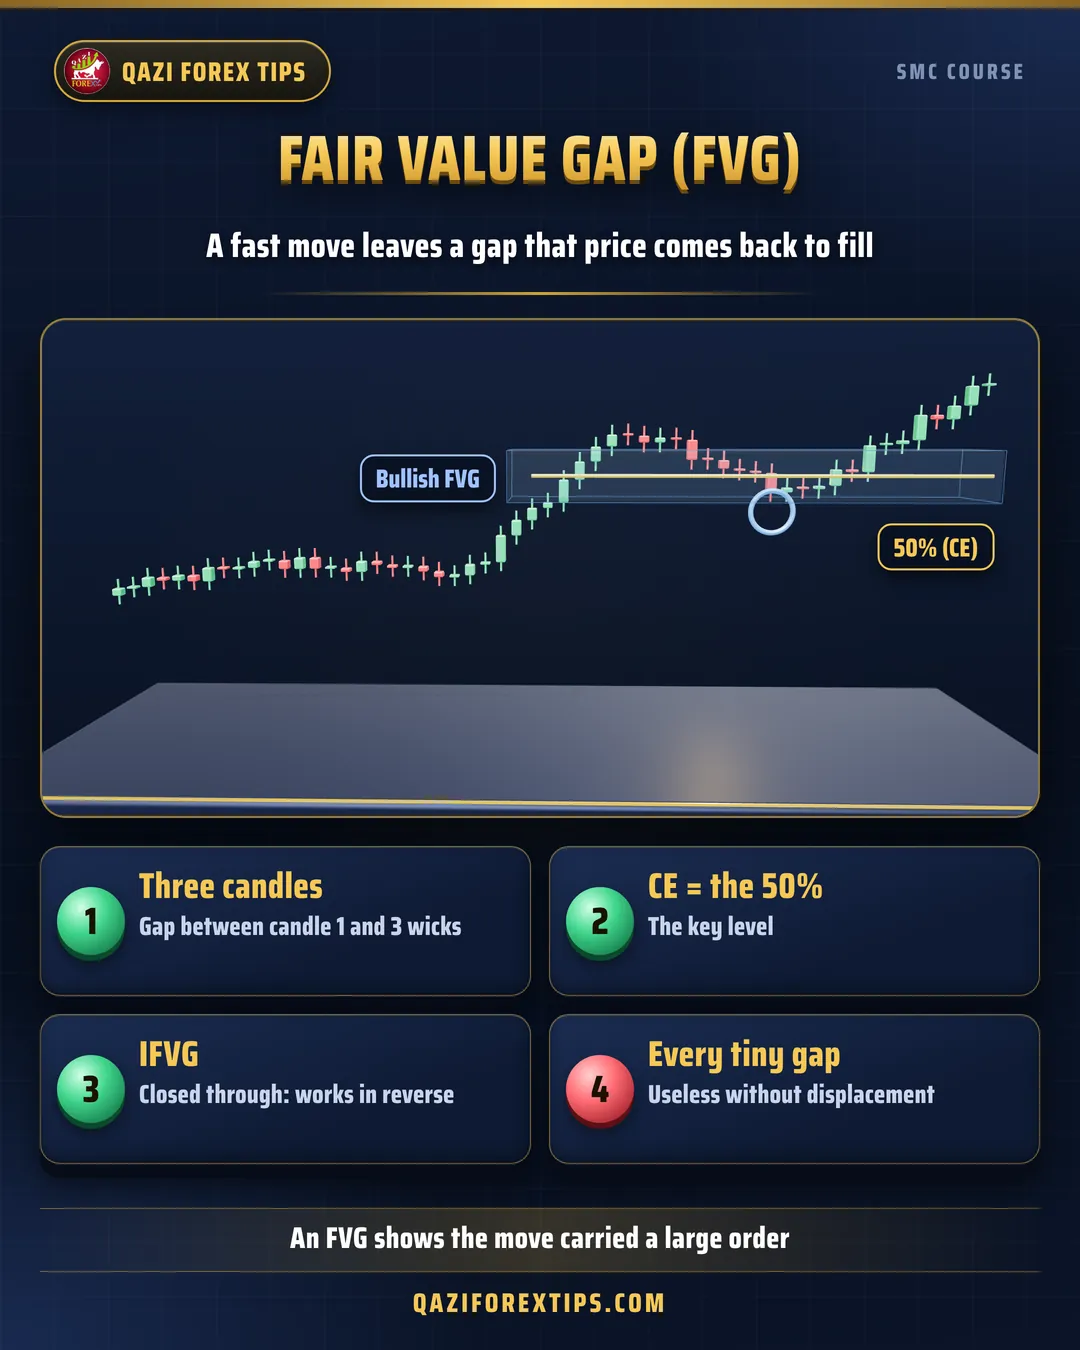
FVG in simple words
Normally, as price moves up and down, every level gives both buyers and sellers a chance to trade. But when a large order arrives, price leaves so fast that some prices in between only see one-sided trading. This unbalanced area is the FVG (fair value gap), also called an imbalance. The market does not like these gaps. Price often returns later to fill (rebalance) them and then continues in its real direction.
The three-candle rule
An FVG is always made of three candles:
- Candle 1: the candle before the move.
- Candle 2: the large, strong-bodied move candle (displacement).
- Candle 3: the candle after the move.
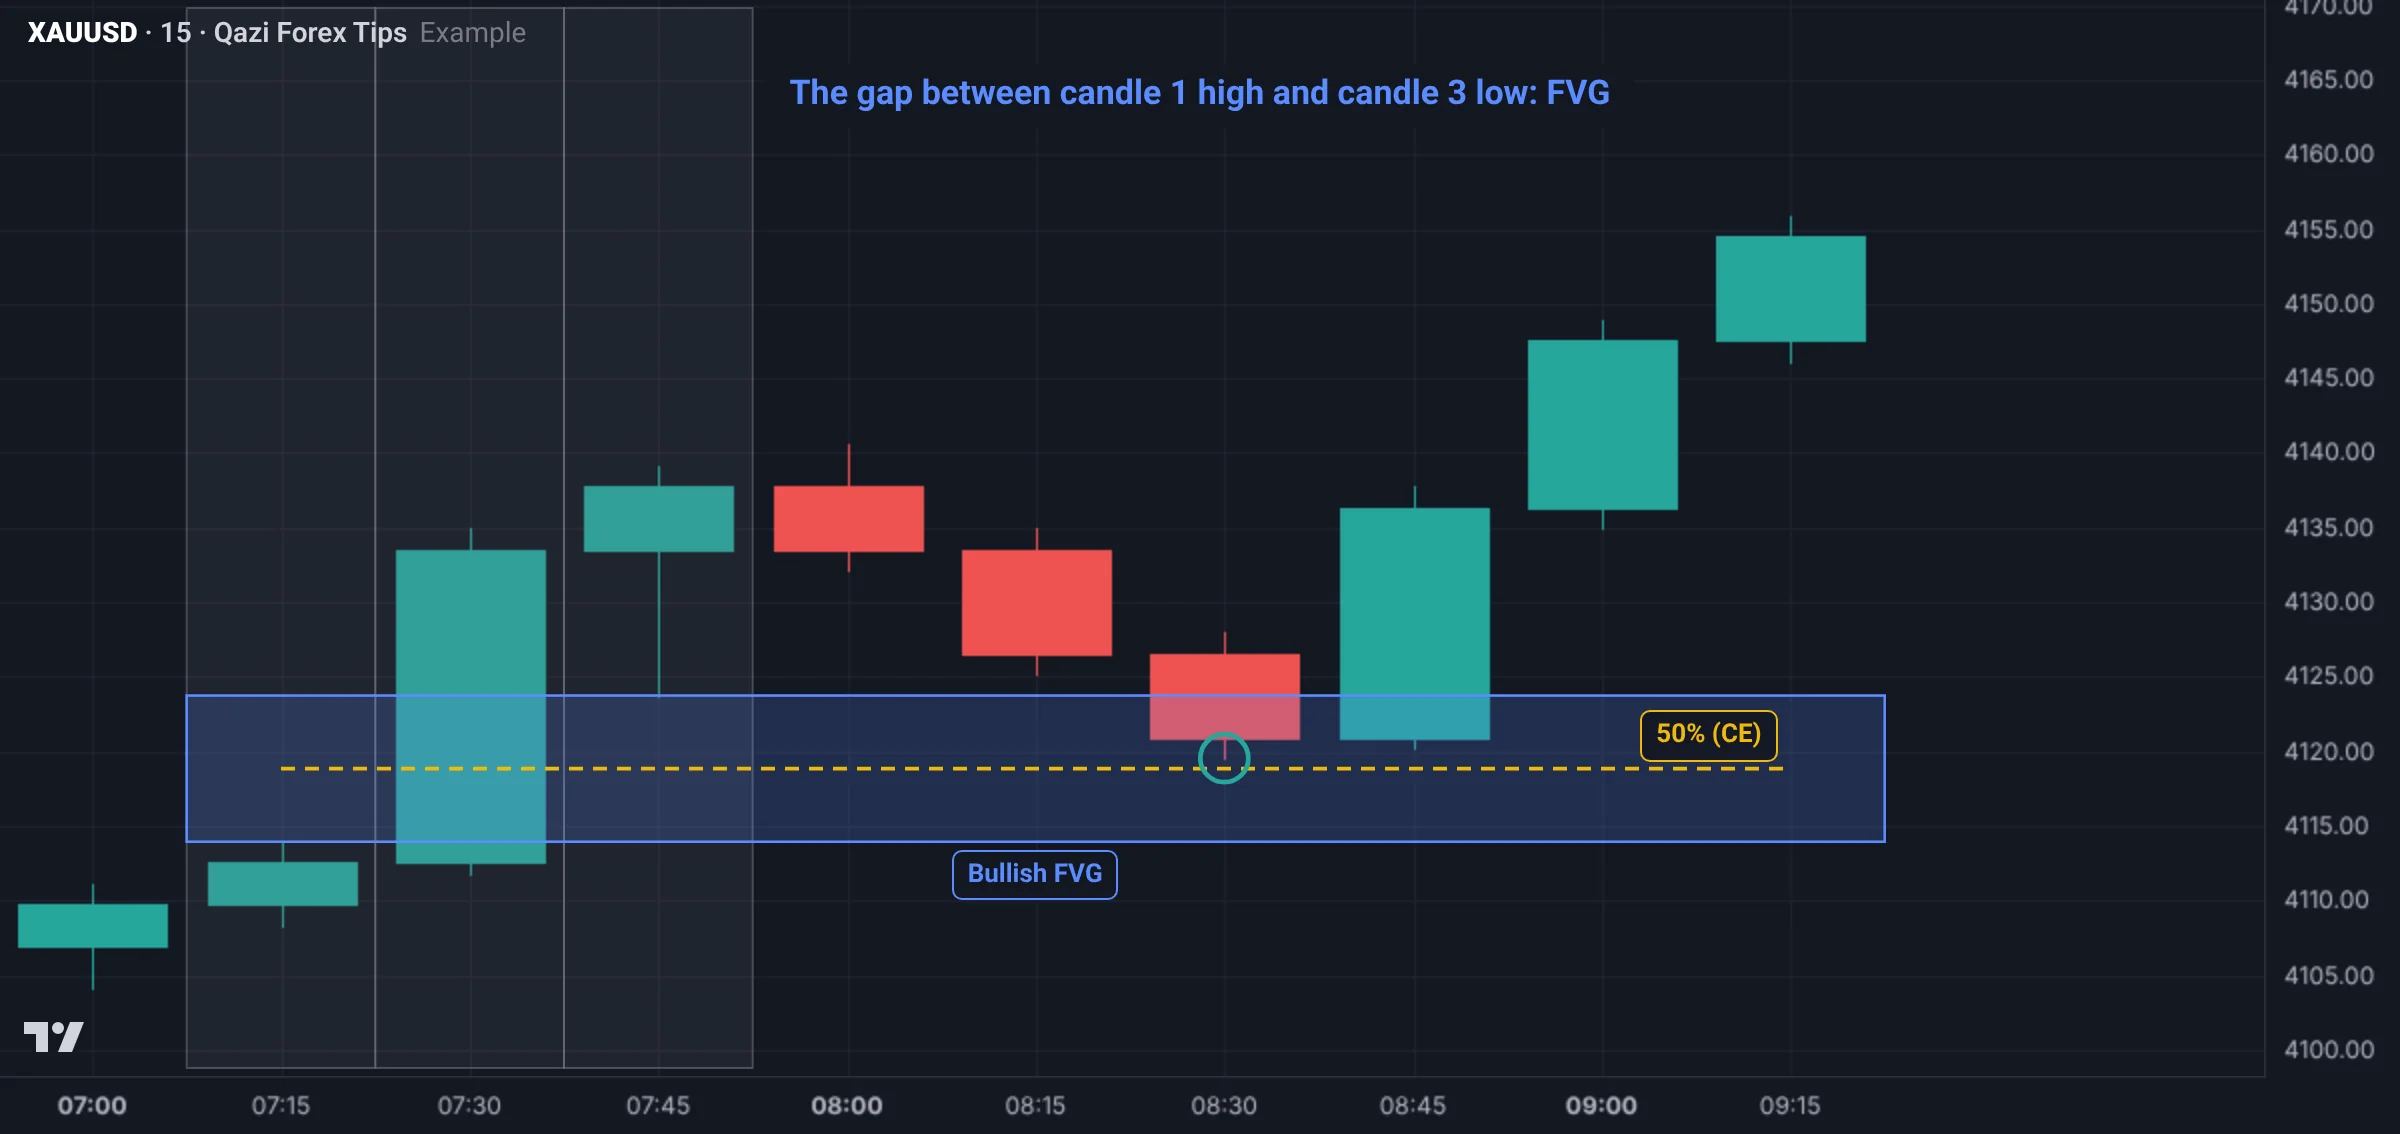
Bullish FVG: the gap between candle 1's high and candle 3's low, when the two do not touch. Bearish FVG: the gap between candle 1's low and candle 3's high.
CE: the 50% of an FVG
The exact middle of an FVG is called CE (consequent encroachment). It is the most important level of the gap:
- In a strong FVG, price often reaches the CE and turns.
- If a body closes beyond the CE, the FVG has weakened.
- If a body closes beyond the whole FVG, it has failed; it may now become an IFVG.
Judging FVG quality
| Sign | Strong FVG | Weak FVG |
|---|---|---|
| Middle candle | Big body, small wicks | Small body, long wicks |
| Structure | The move made a BOS or MSS | No high or low broke |
| Location | With the bias, in discount or premium | In the middle of the range |
| Touch | Not filled yet | Already half or fully filled |
| Size | Reasonable | Tiny (noise) or huge (big stop loss) |
FVG and order block together
The best order block is one that left an FVG right after it (lesson 3.1). Together they make a strong POI:
- The FVG shows the move carried a large order.
- The order block shows where that order started.
- Price often fills the FVG first, then touches the order block and turns. So entering in the FVG with the stop behind the order block is a good approach.
IFVG: the inverse FVG
Sometimes price does not just fill an FVG but closes through it with a strong body. That means the large order behind that FVG lost. Now the same zone works the other way:
- A close above a bearish FVG turns it into support: a bullish IFVG.
- A close below a bullish FVG turns it into resistance: a bearish IFVG.
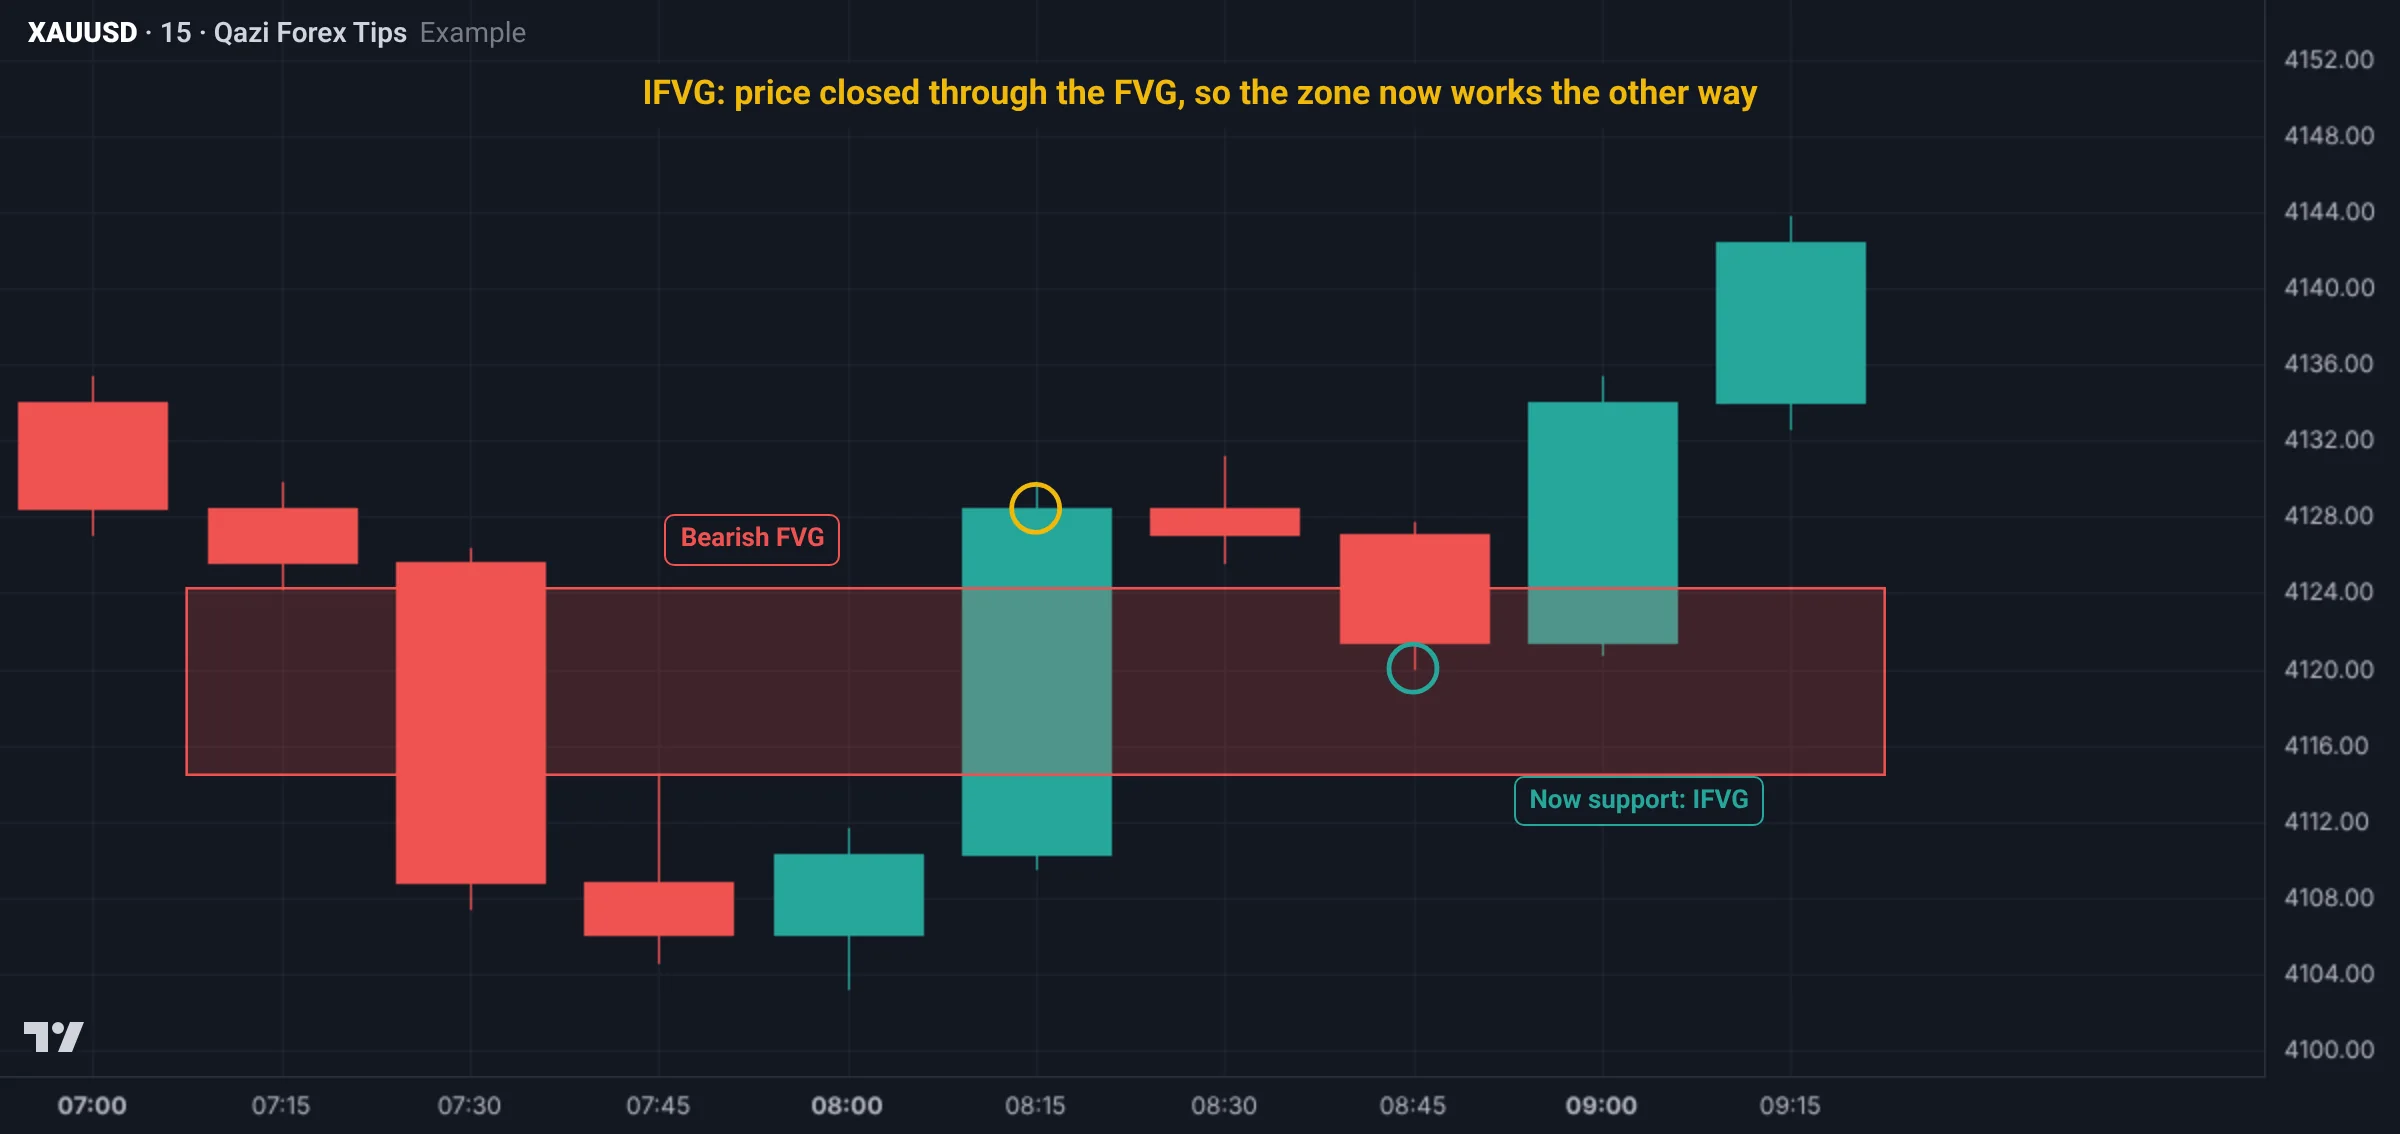
An IFVG is especially powerful when a liquidity sweep came before it and the candle that closed through the FVG also made an MSS. That is a clean reversal sign.
Planning an FVG trade
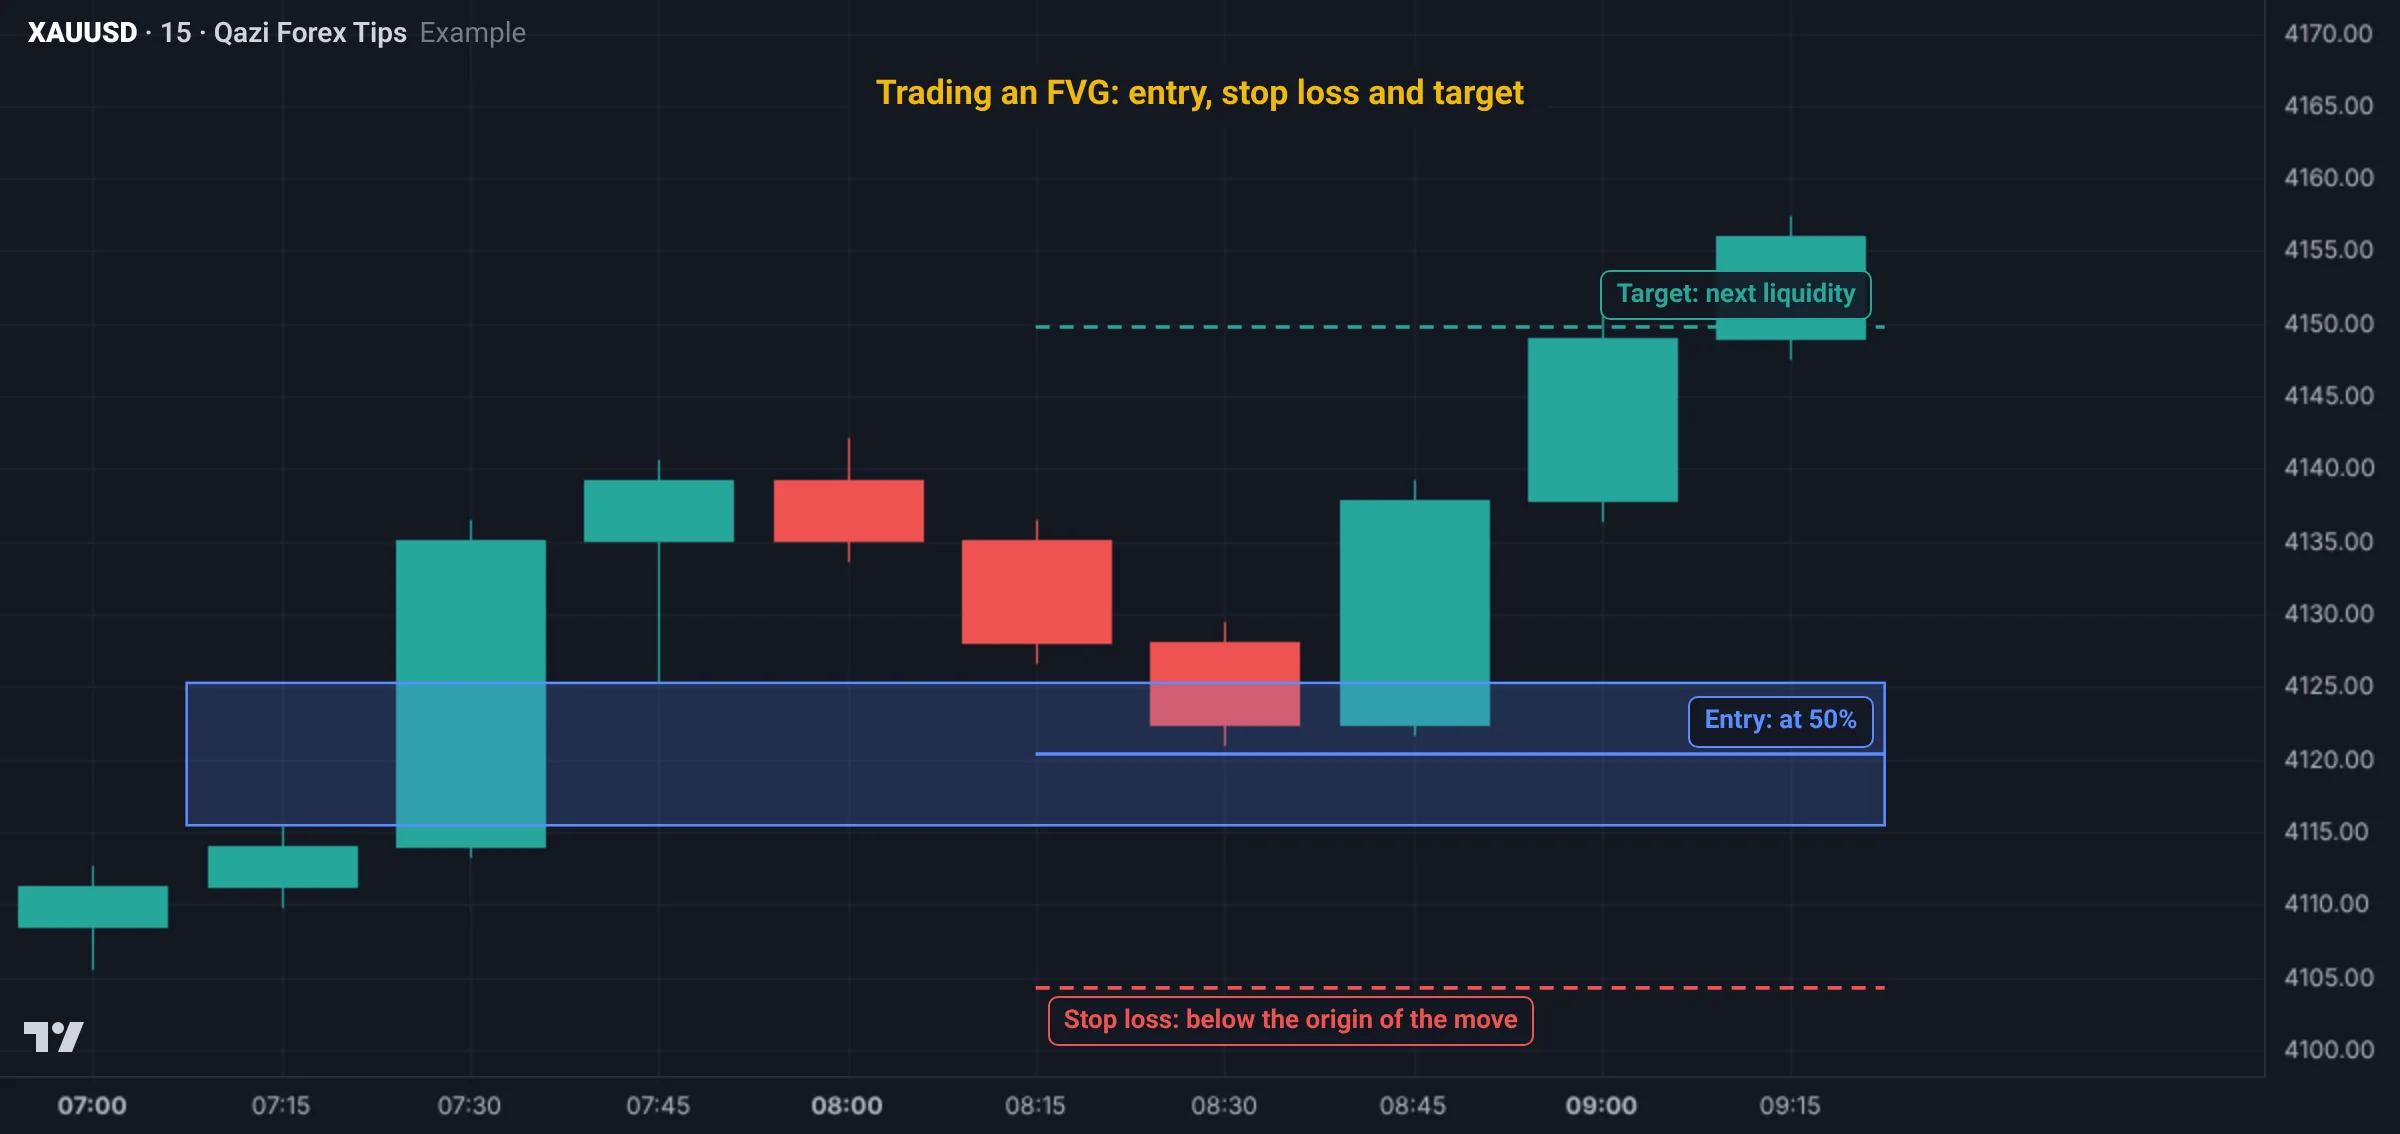
- Set the bias and the draw on liquidity.
- Find an FVG in the bias direction that formed in the move that made the BOS.
- Entry: a limit at the CE (50%), or M1 confirmation inside the FVG.
- Stop loss: below the origin of the move (the order block or swing low). A stop just under the FVG is often hit.
- Target: the next liquidity. If price closes through the CE, fills the whole FVG and still does not turn, be careful.
Gold example
On Gold M5, price jumped from 4,121 to 4,136 with one large green candle.
- Candle 1's high is 4,125 and candle 3's low is 4,132. Bullish FVG: 4,125 to 4,132, CE about 4,128.5.
- The move also broke the 4,130 high, so there is a BOS.
- Price ran to 4,140, then pulled back to 4,129. Entry with a limit at 4,128.5, stop below the origin of the move at 4,119, risk $9.5.
- Target: the buy-side liquidity above at 4,148, about $19.5, or 1:2.
- If any M5 candle had closed with its body below 4,125, the FVG would have failed, and we would now look at the zone as a bearish IFVG.
Real Gold chart examples
Gold M15 on 27 Oct 2026 (data: Dukascopy, bid price; Pakistan time):
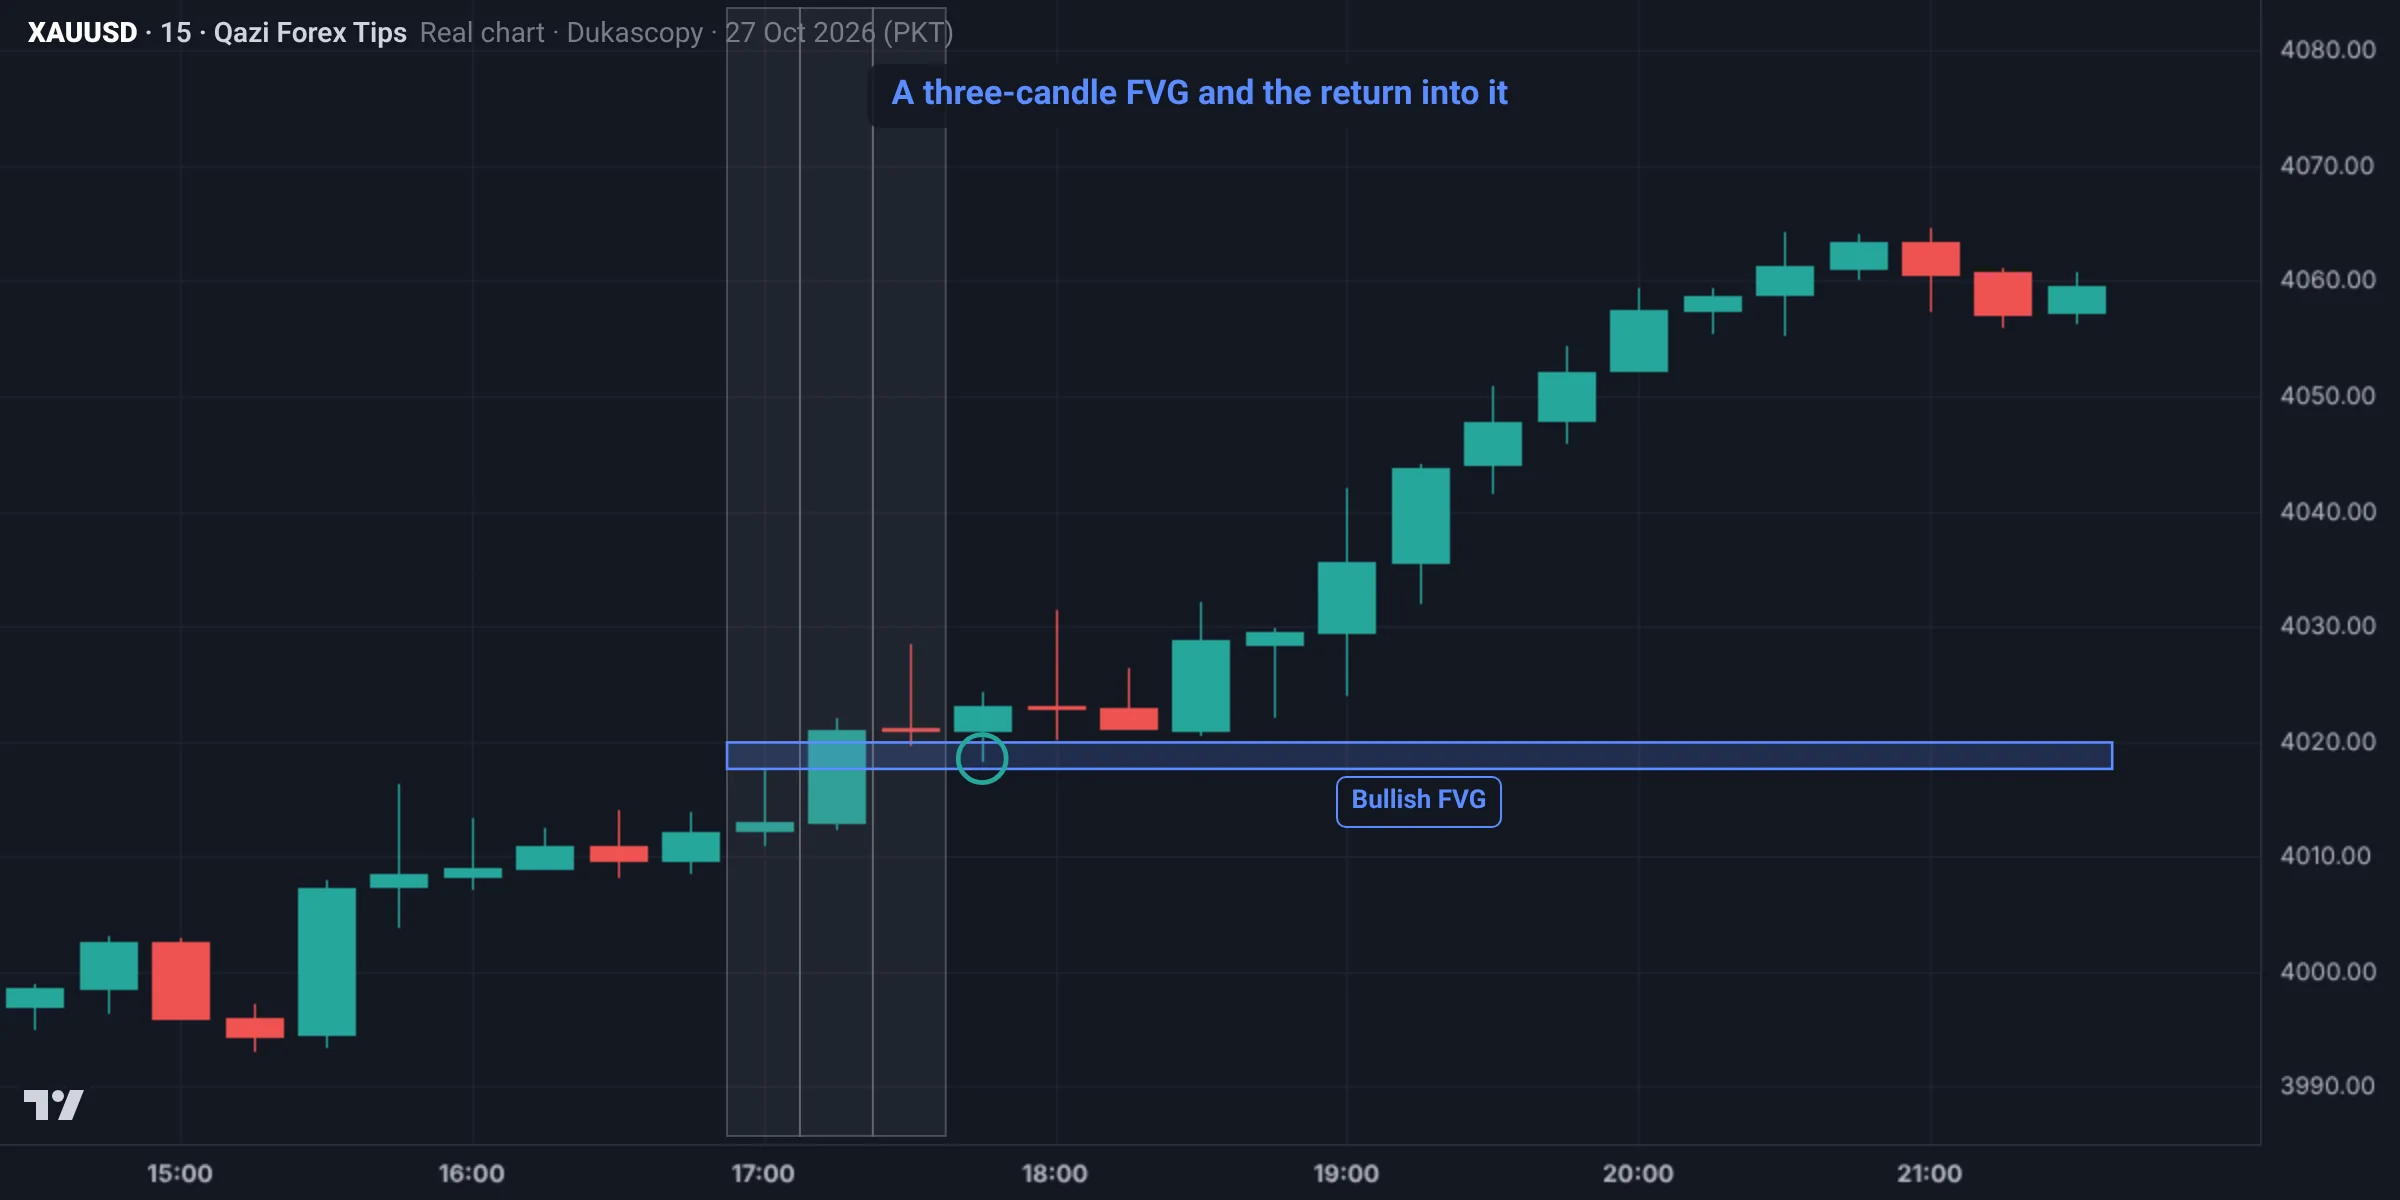
- Candle 1 (17:00): high 4,017.6.
- Candle 2 (17:15): a big green candle, from 4,013.0 to 4,021.0.
- Candle 3 (17:30): low 4,019.9.
- The gap between candle 1's high and candle 3's low, 4,017.6 to 4,019.9, is the FVG. Its CE is about 4,018.8.
- At 17:45 price came back to 4,018.5 (just below the CE), did not close below the FVG, and then ran to 4,064.5 by night.
The FVG was small ($2.3) but formed inside a strong move, which is why it worked.
Second example: a bearish FVG (22 Oct)
Gold M15 on 22 Oct 2026 (data: Dukascopy, bid price; Pakistan time). The first example was a bullish FVG; this is a bearish FVG:
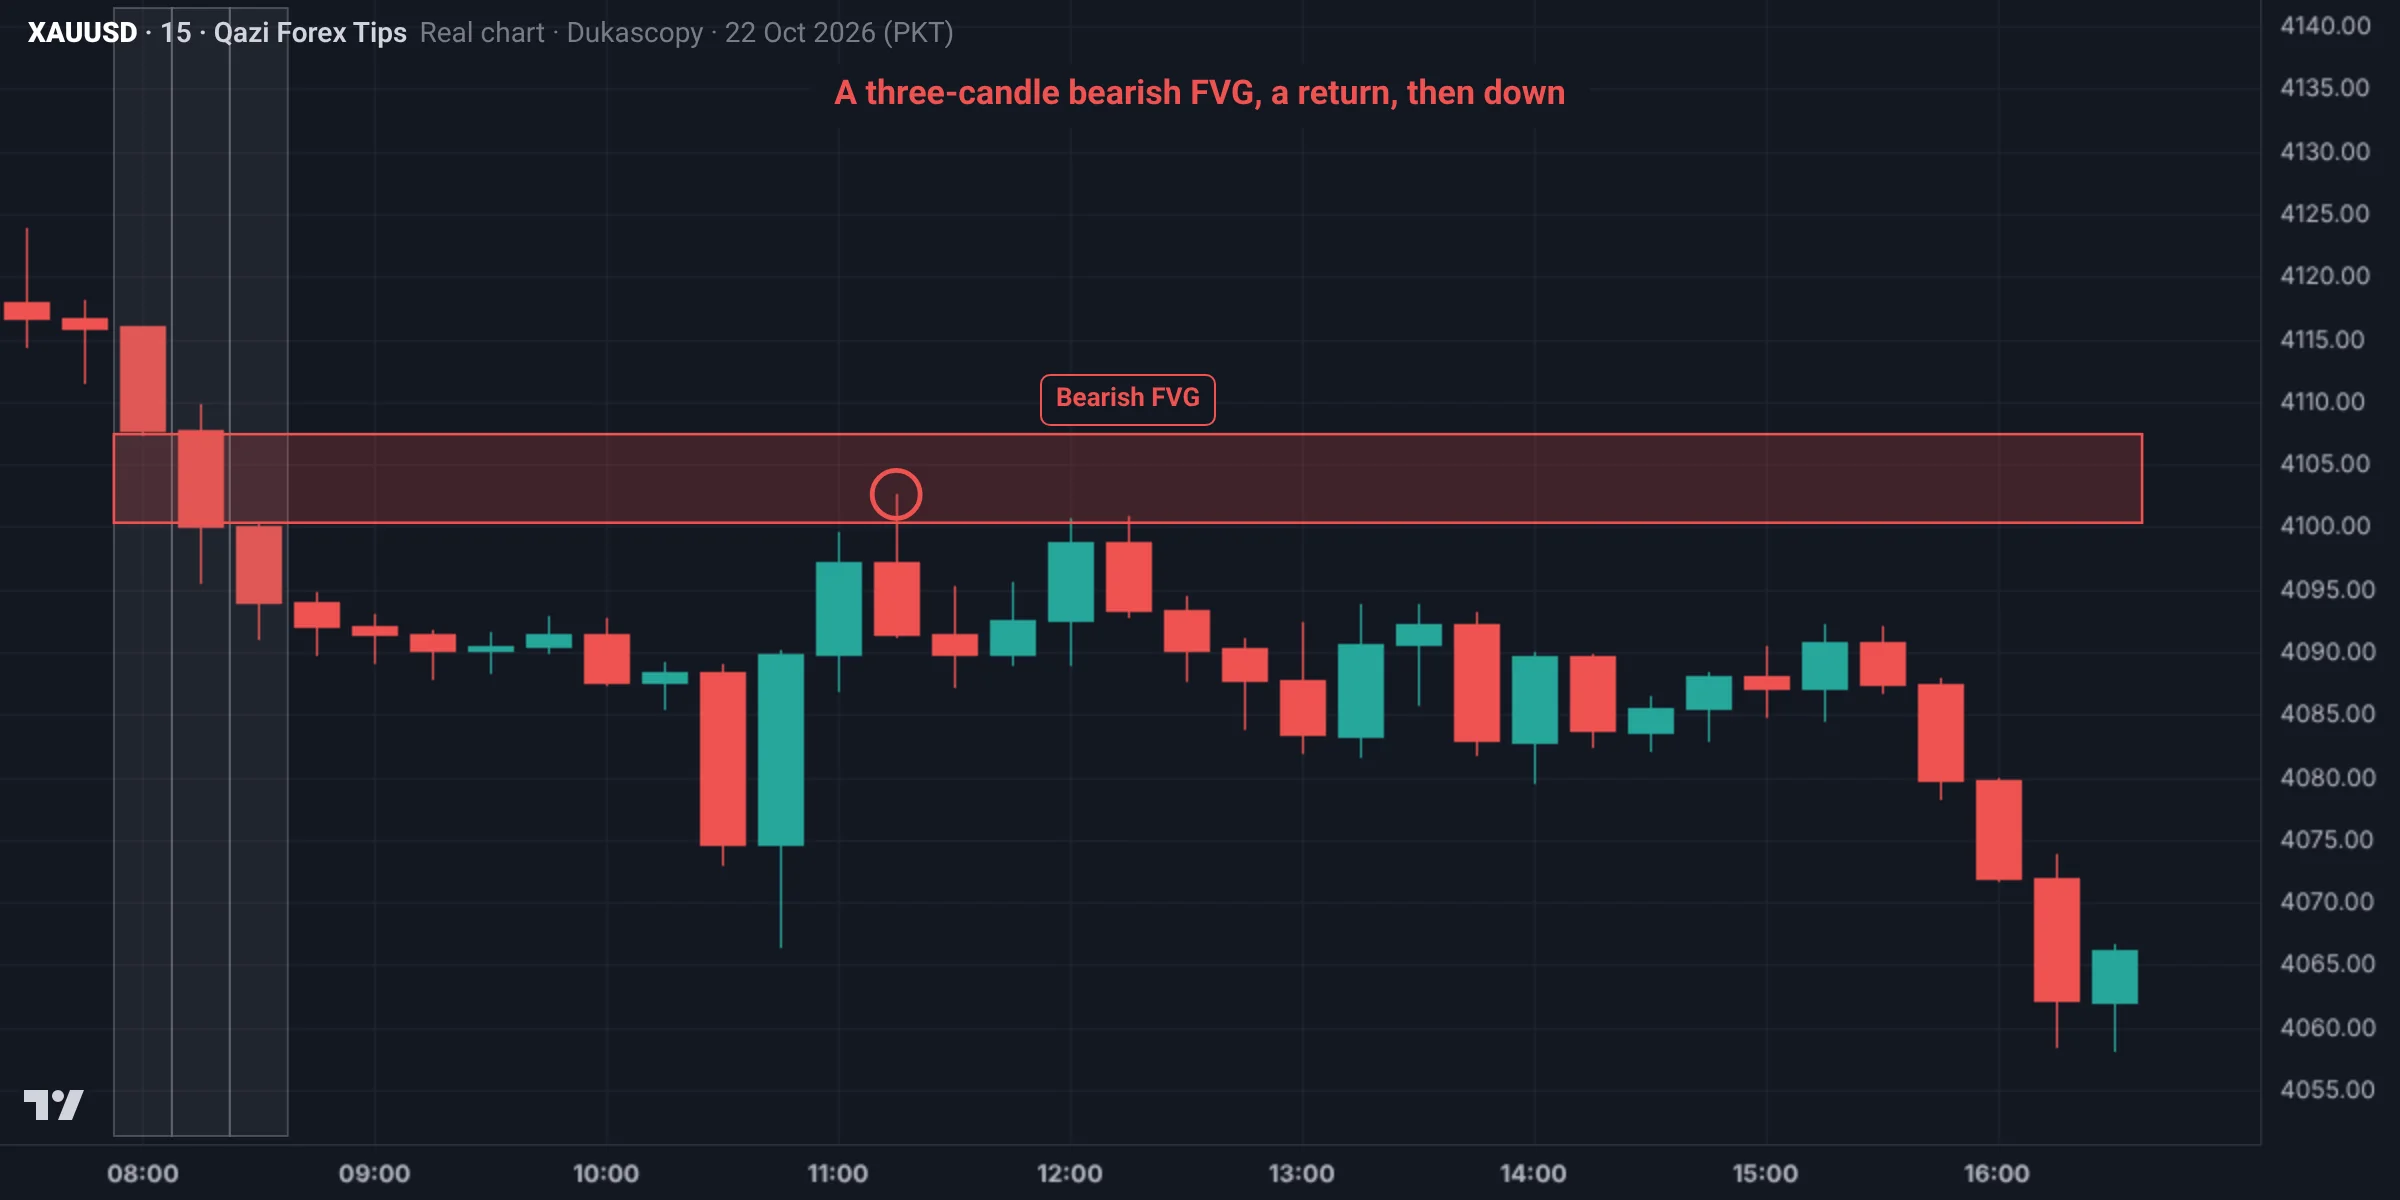
- Candle 1 (08:00): low 4,107.4.
- Candle 2 (08:15): a big red candle, from 4,107.8 to 4,100.0.
- Candle 3 (08:30): high 4,100.3.
- The gap between candle 1's low and candle 3's high, 4,100.3 to 4,107.4, is the bearish FVG. Its CE is about 4,103.9.
- At 11:15 price came back to 4,102.6, inside the FVG, but no candle closed above it. By evening Gold was at 4,058.2.
In a bearish FVG price returns into the gap from below; a close above the gap means the FVG failed (and may become an IFVG).
Common mistakes
Summary
- An FVG is made of three candles: the gap between the wicks of candle 1 and candle 3.
- The CE, or 50%, is the most important level.
- A strong FVG has displacement, a structure break, the bias behind it, and is still unfilled.
- If a body closes through the whole FVG, it becomes an IFVG and works the other way.
Try this lesson on your own chart
Qazi Forex Tips' own tools that make this lesson easier. A tool helps; your rules make the decision.
QFT FVG Pro indicator
100% free · MT5 & MT4Draws FVGs, IFVGs, BPRs and higher timeframe FVGs on your chart automatically, with the 50% (CE) line: everything in this lesson, on your own chart.
Details and downloadSpot it on the chart: practice
This is a real Gold chart (Dukascopy data, Pakistan time). Study it and pick an answer. After you answer, the fully marked chart and the explanation appear.
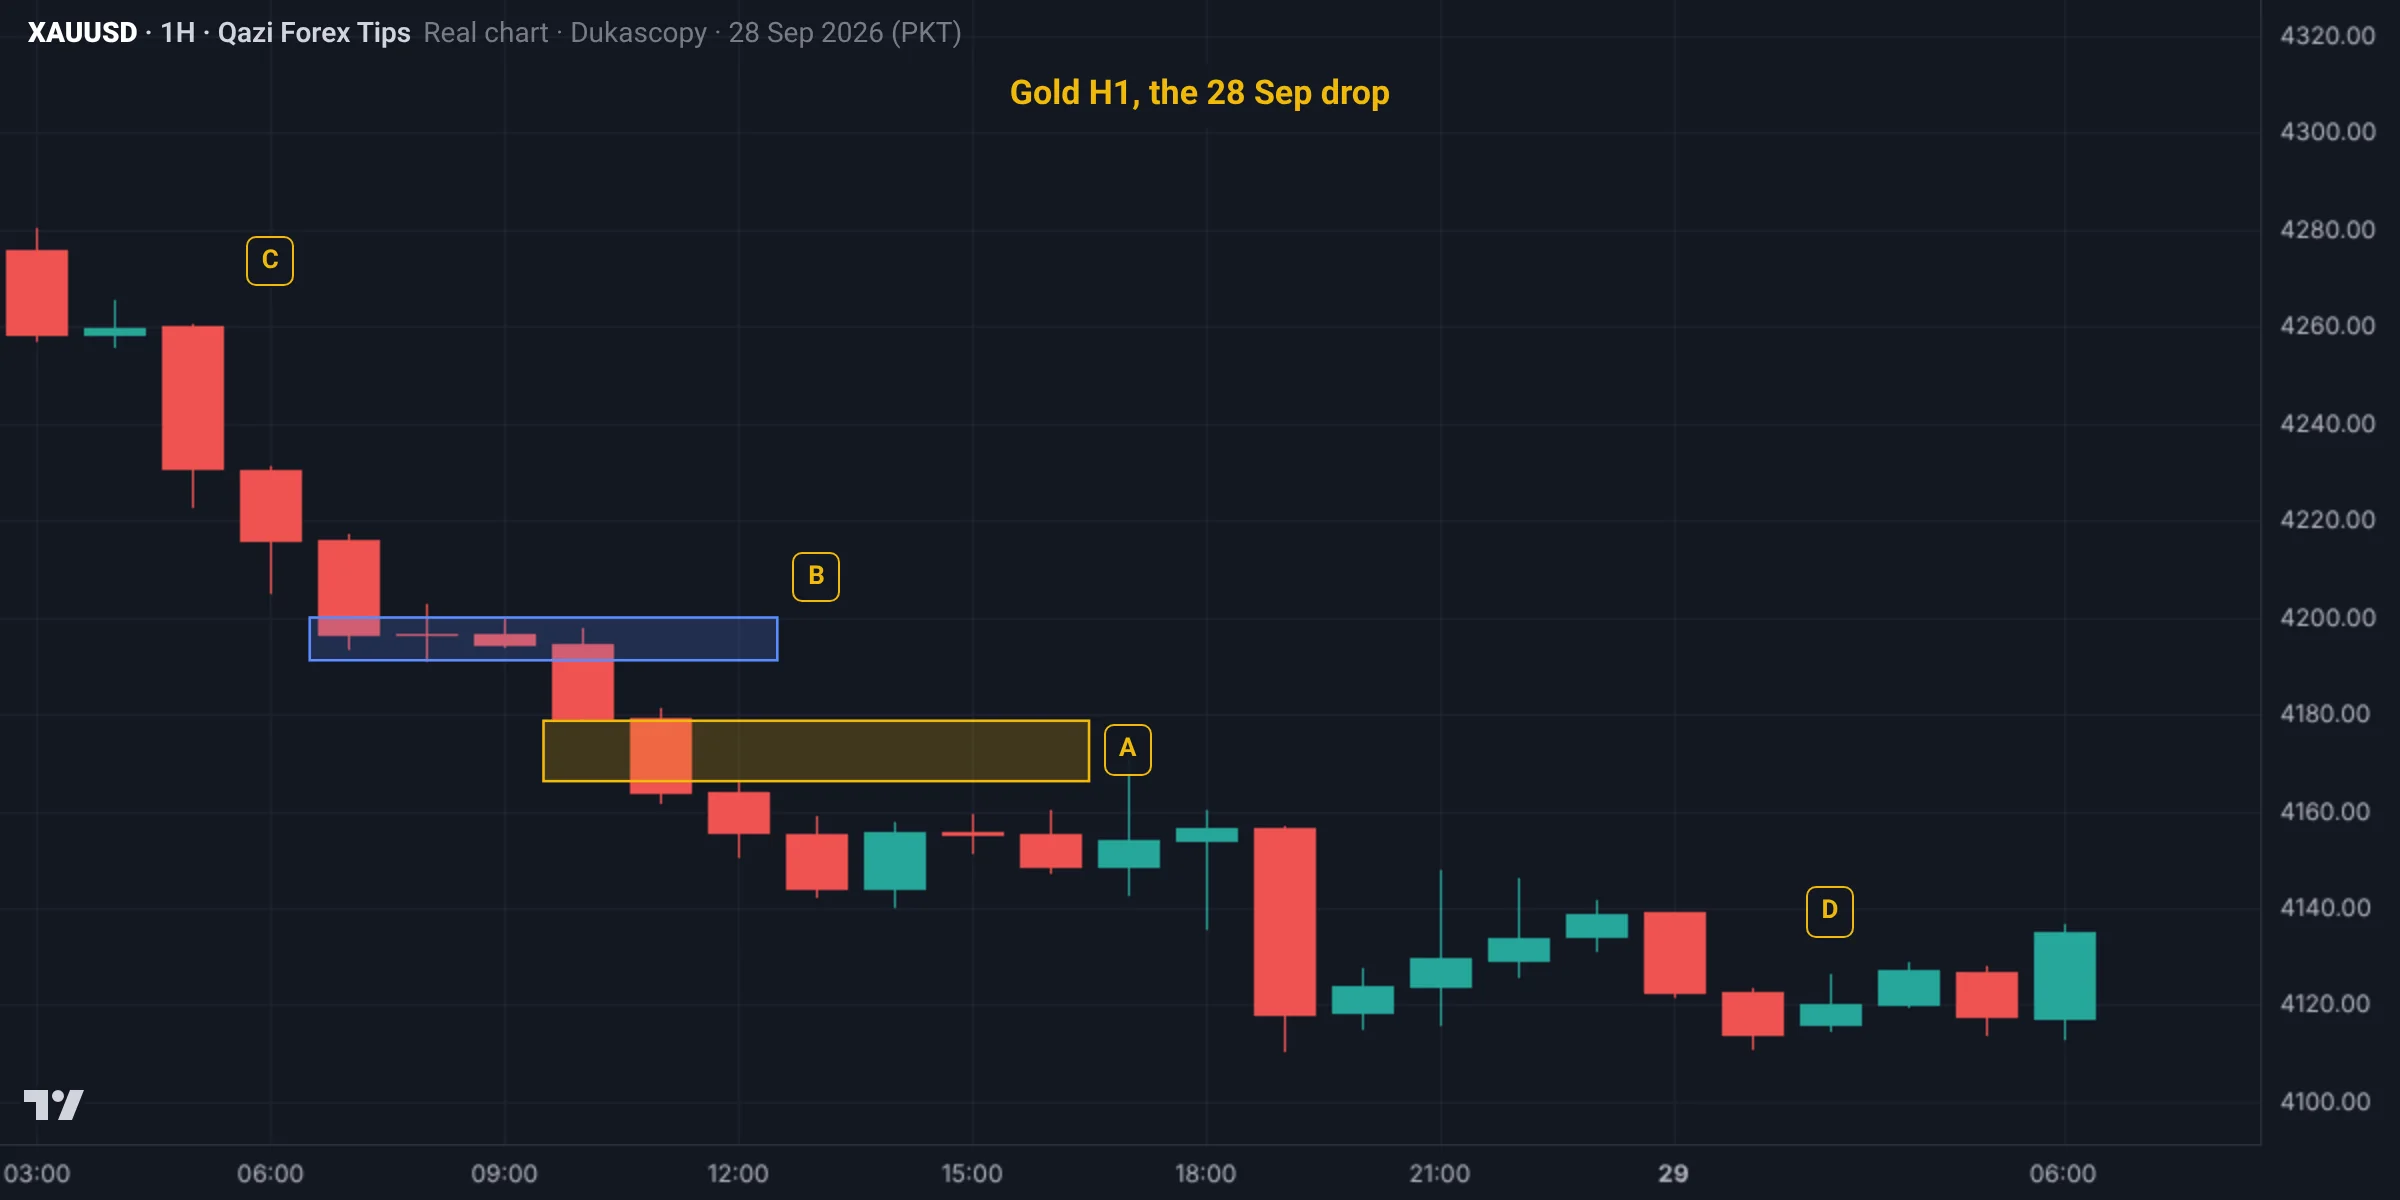
Which of these is a bearish FVG?
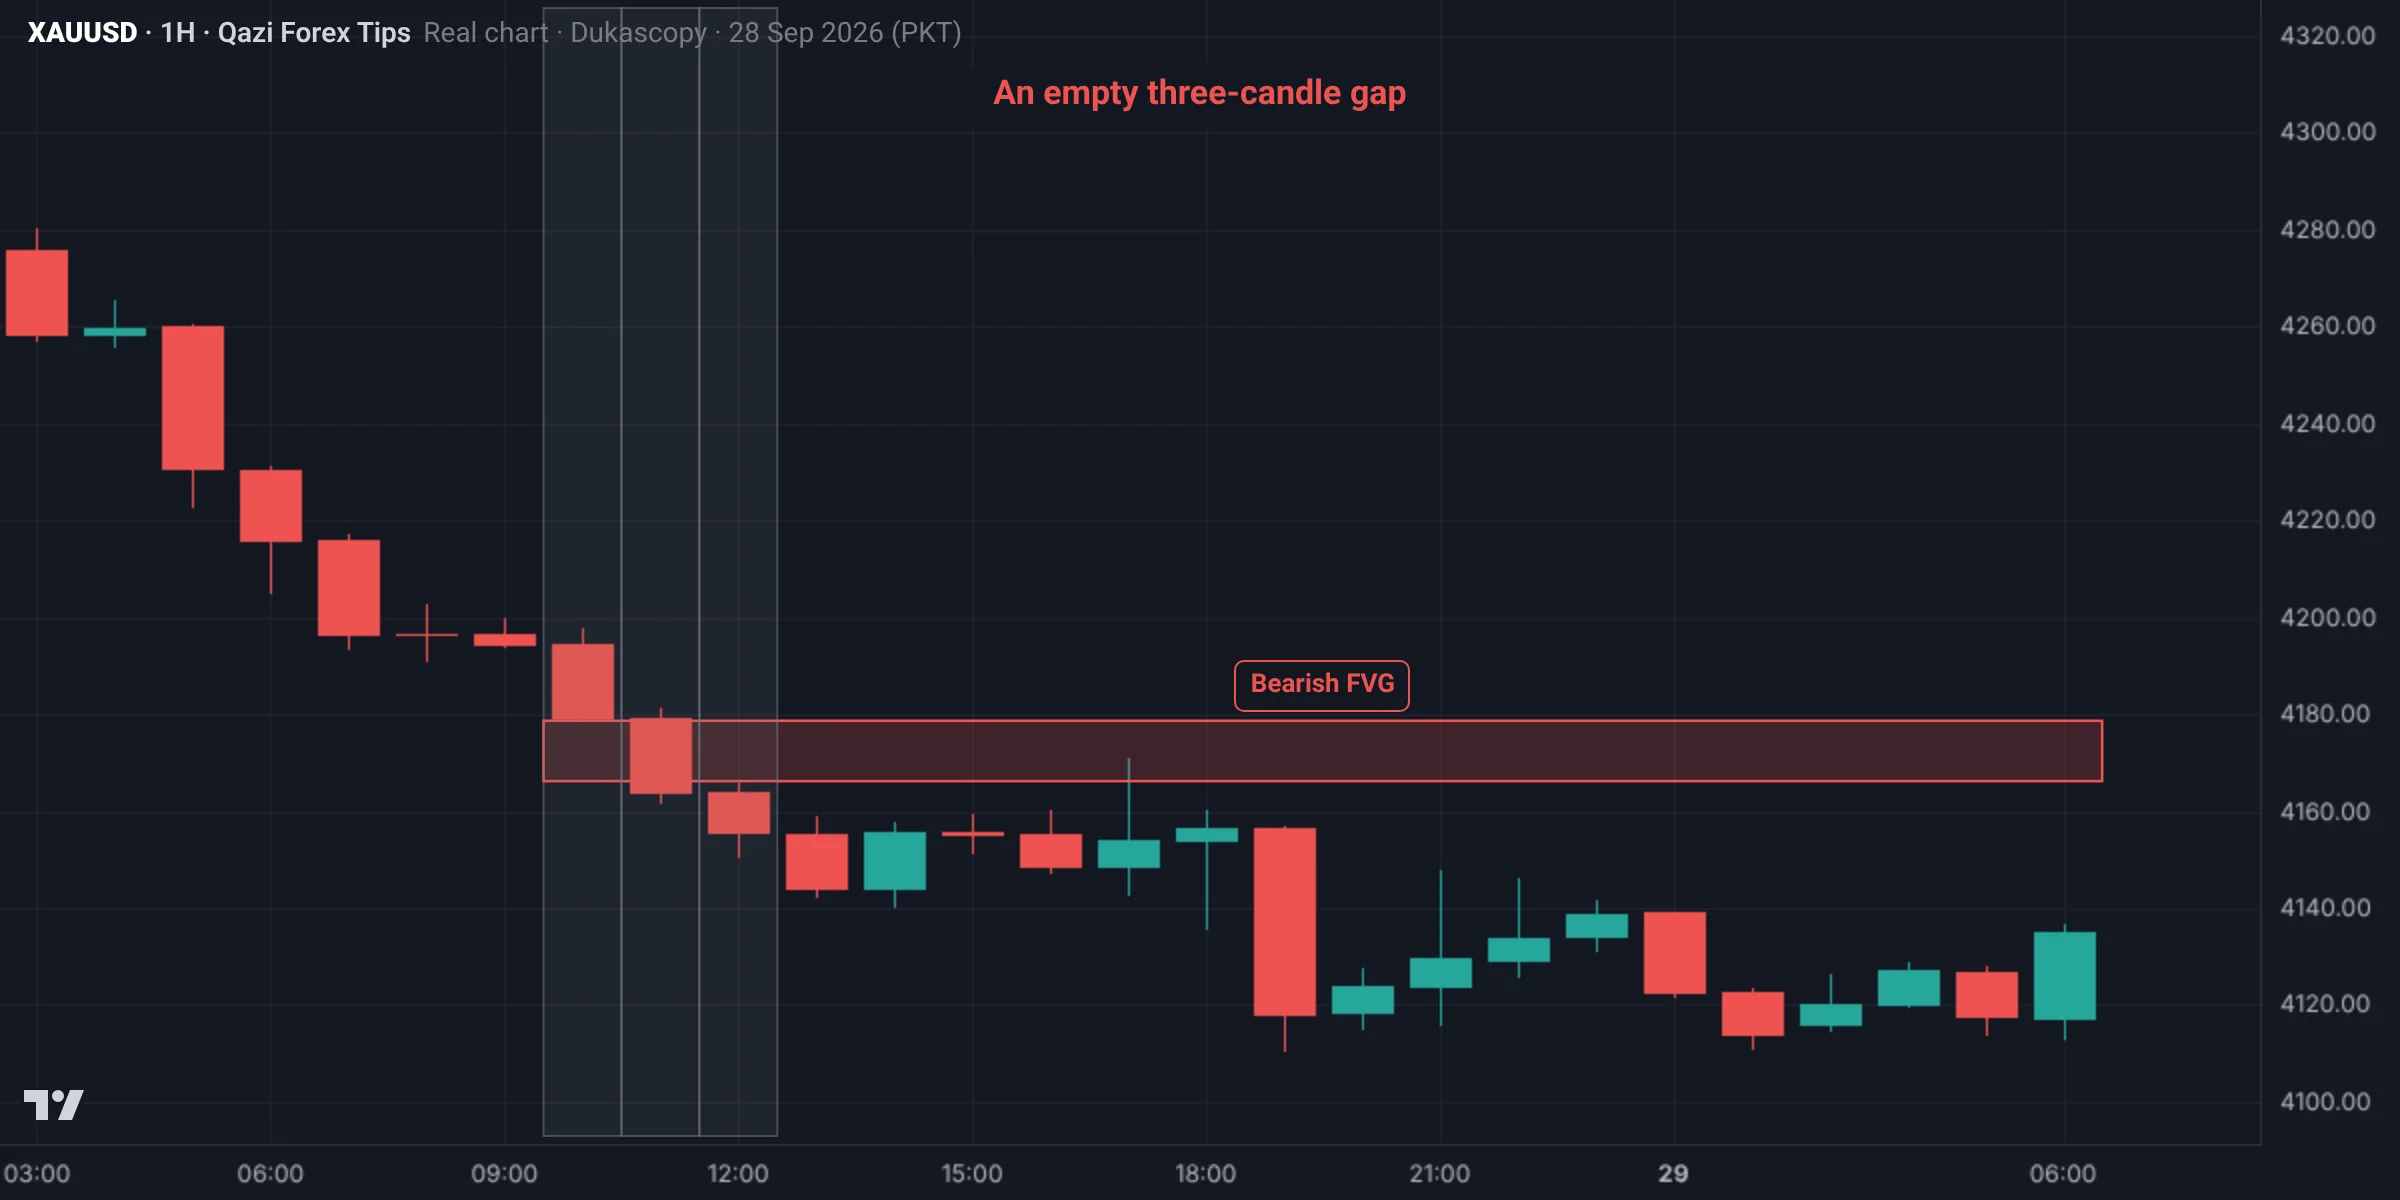
A: the 10:00 candle on 28 Sep has a low of 4,178.6 and the 12:00 candle a high of 4,166.2, with the big red 11:00 candle between them. They don't touch, so there is a 12.5-dollar bearish FVG from 4,166.2 to 4,178.6. In B the candles overlap (no gap); C and D are just candles.
The marked chart
Test yourself: Lesson 3.2 quiz
9 questions. Pick one answer for each and you will see at once whether it is right and why. Your score and grade appear at the end. You need 70% to pass.
0 correct · 0 / 9
Question 1How many candles make an FVG?
Candle 1, the big displacement candle in the middle, and candle 3.
Question 2Where is a bullish FVG?
Bearish FVG: between candle 1's low and candle 3's high.
Question 3What is the CE of an FVG?
In a strong FVG price often turns at the CE; a body close beyond it weakens the FVG.
Question 4Which is a sign of a weak FVG?
A strong FVG is with the bias, comes with a BOS and is a reasonable size.
Question 5What is an IFVG?
A close above a bearish FVG turns it into support (a bullish IFVG).
Question 6Where is the better stop in an FVG trade?
A stop just under the FVG is often hit.
Question 7When an FVG and an order block sit together, what is a good approach?
Price often fills the FVG first, then touches the order block and turns.
Question 8Gold M5: candle 1 high 4,125, candle 3 low 4,132. What are the FVG and CE?
If an M5 body had closed below 4,125, the FVG would have failed and become a bearish IFVG.
Question 9Must every FVG be filled?
Not every small gap is an FVG; only those with displacement and a structure break matter.
Lesson checklist
Tick each point once you understand it. Your ticks are saved in this browser.
Assignment
- Mark 10 important FVGs on the last three days of Gold M15 and add the CE to each.
- Count how many filled, how many reacted at the CE and how many failed.
- Find 2 IFVGs where the zone flipped after failing.
- Find a POI where an order block and an FVG sit together.
- Write the entry, stop loss and target for it and work out the RR.
- Post your chart in the group.
Post your assignment screenshots with your reasons in our free Facebook group, where your charts will be checked.
Join the free group
Who wrote this lesson
Dr. Qazi Abdul Basit, Ph.D
Ph.D in Business Administration and a forex and Gold trader since 2013. Founder of Qazi Forex Tips, which teaches traders in Pakistan and India price action, risk management and trading psychology in their own language: 65 student batches so far, free courses on YouTube, and MT5 tools for traders (QFT Replay Simulator, QFT Trade Assistant).
- 2013 trading since
- 75K+ Facebook group members
- 65 student batches
- 15K+ YouTube subscribers
How this lesson was made: the content follows Dr. Qazi's teaching method and years of trading. Real charts are built from Dukascopy Gold (XAUUSD) data, and backtest results are shown as they came out, even when negative. We do not sell signals, manage accounts or take money from any broker. Last updated: 19 November 2026.
Questions
What is an FVG?
A three-candle pattern where the wicks of candle 1 and candle 3 do not overlap, leaving an empty gap between them.
What is CE?
The 50% level of the FVG; in a strong FVG price often turns there.
What is an IFVG?
An FVG that price closes through with a body; after that the zone works in the opposite direction.
Does every FVG get filled?
No. In a strong trend many FVGs remain unfilled.
Is there an FVG indicator for MT5?
Yes, our free QFT FVG Pro indicator (MT5 and MT4) draws FVGs, IFVGs, BPRs, higher timeframe FVGs and the 50% CE line automatically. The link is in the tools section of this page.
Is an FVG the same as an imbalance?
Mostly yes: an FVG is a three-candle imbalance where one side's orders were not matched. ICT calls it an FVG; many traders say imbalance or inefficiency.
Read more
Education only, not financial advice. Trading forex, Gold and CFDs carries a high risk of loss. SMC concepts describe tendencies, not guarantees. Lesson 18 of 38.