 Qazi Forex Tips

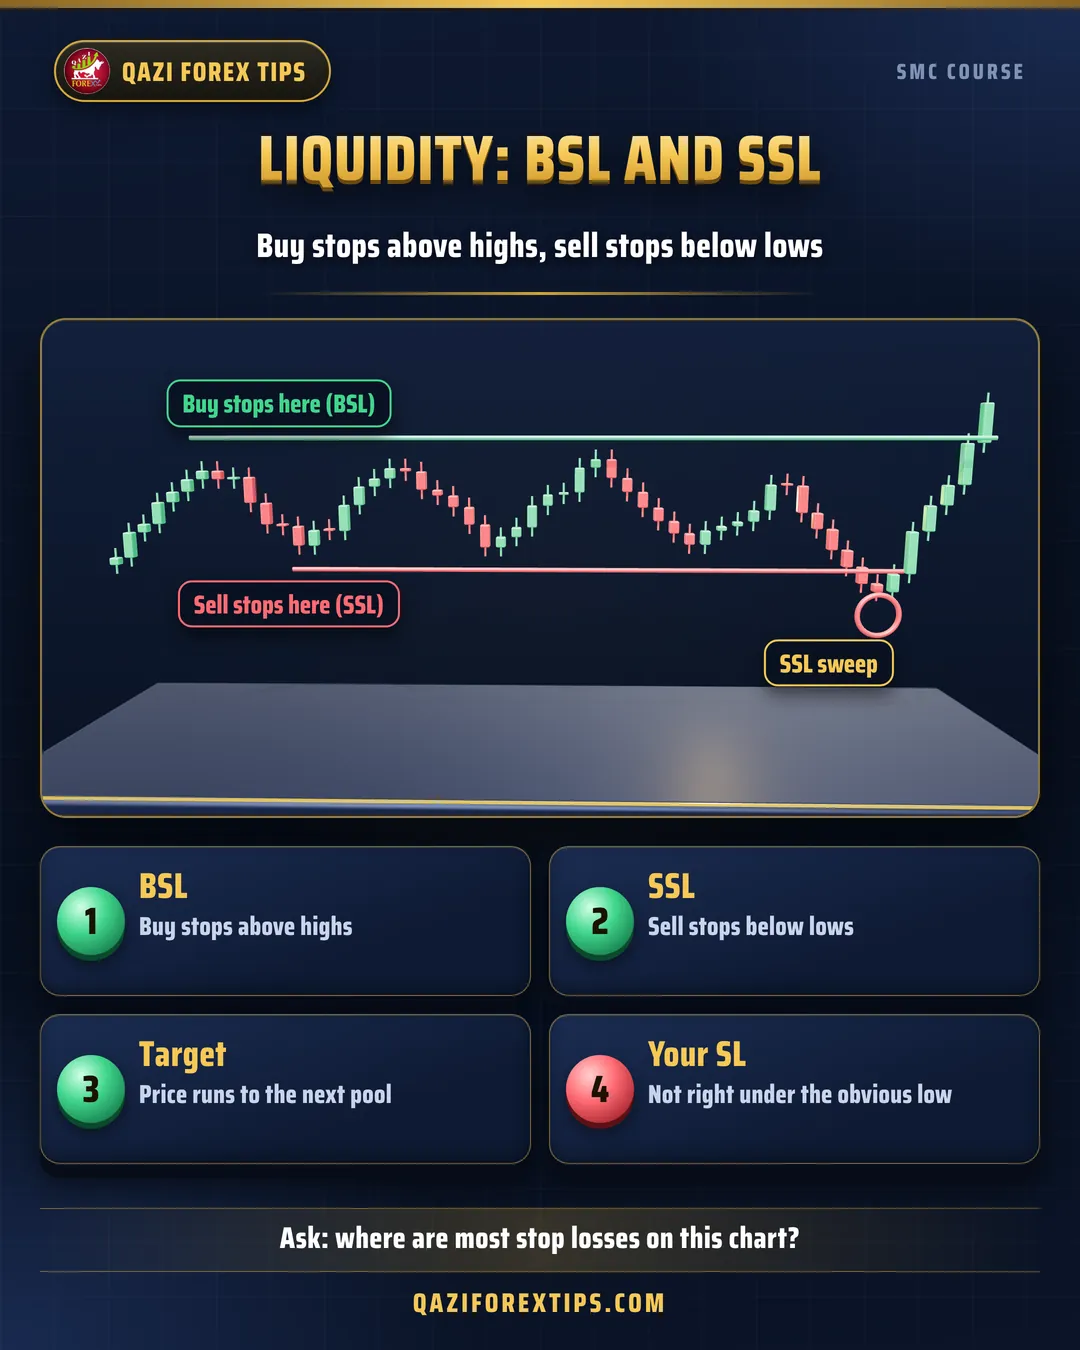
Liquidity in simple words
In everyday language, liquidity is how many orders are available to buy or sell at a price. A market with plenty of orders at every price lets even a very large position open smoothly. SMC looks at liquidity in a more specific way: the places where many stop losses and pending orders are resting. These places are visible on the chart, because most traders put their stops at the same kind of levels.
Why does a large player need liquidity?
Imagine a bank or large fund wants to open a very big buy position in Gold. It needs that much selling on the other side. If it simply buys at market at a random moment, its own order pushes price up and it gets a worse fill. So a big buyer looks for a place where many sell orders appear at once: below an obvious low, where all the buyers' stop losses sit. When a long position's stop is hit it becomes a sell order, and those sell orders fill the big buyer. In the same way, a big seller works above an obvious high, where the sellers' stops turn into buy orders that fill its sell.
BSL and SSL
- BSL (Buy Side Liquidity): sits above highs. Sellers' stop losses and breakout traders' buy stops rest here. When triggered, they all become buy orders.
- SSL (Sell Side Liquidity): sits below lows. Buyers' stop losses and breakout traders' sell stops rest here. When triggered, they all become sell orders.
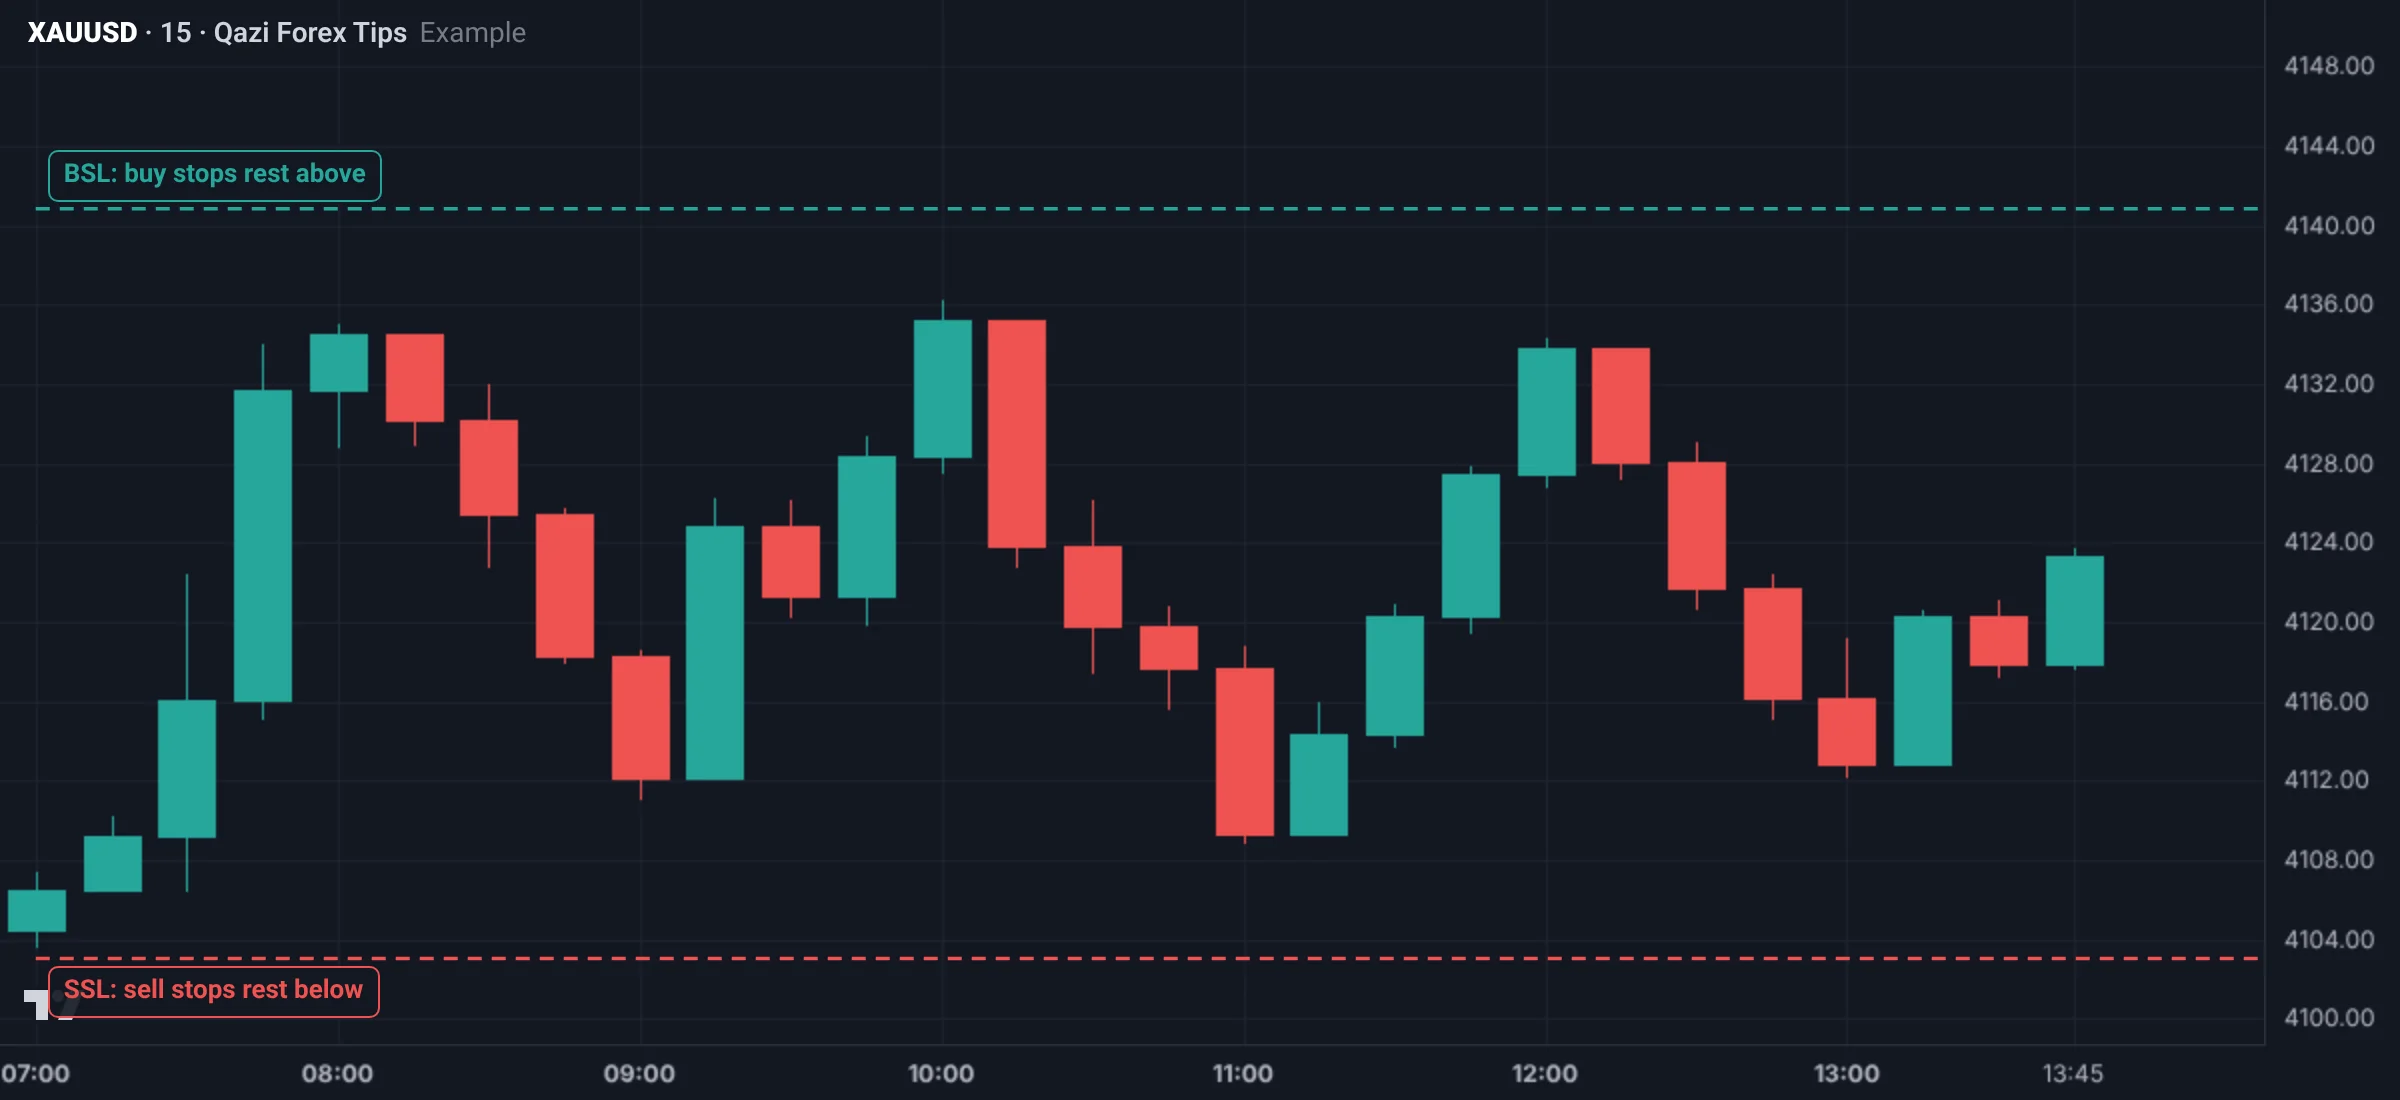
An easy way to remember the names: the orders at BSL turn into buys, and the orders at SSL turn into sells.
Whose orders are these?
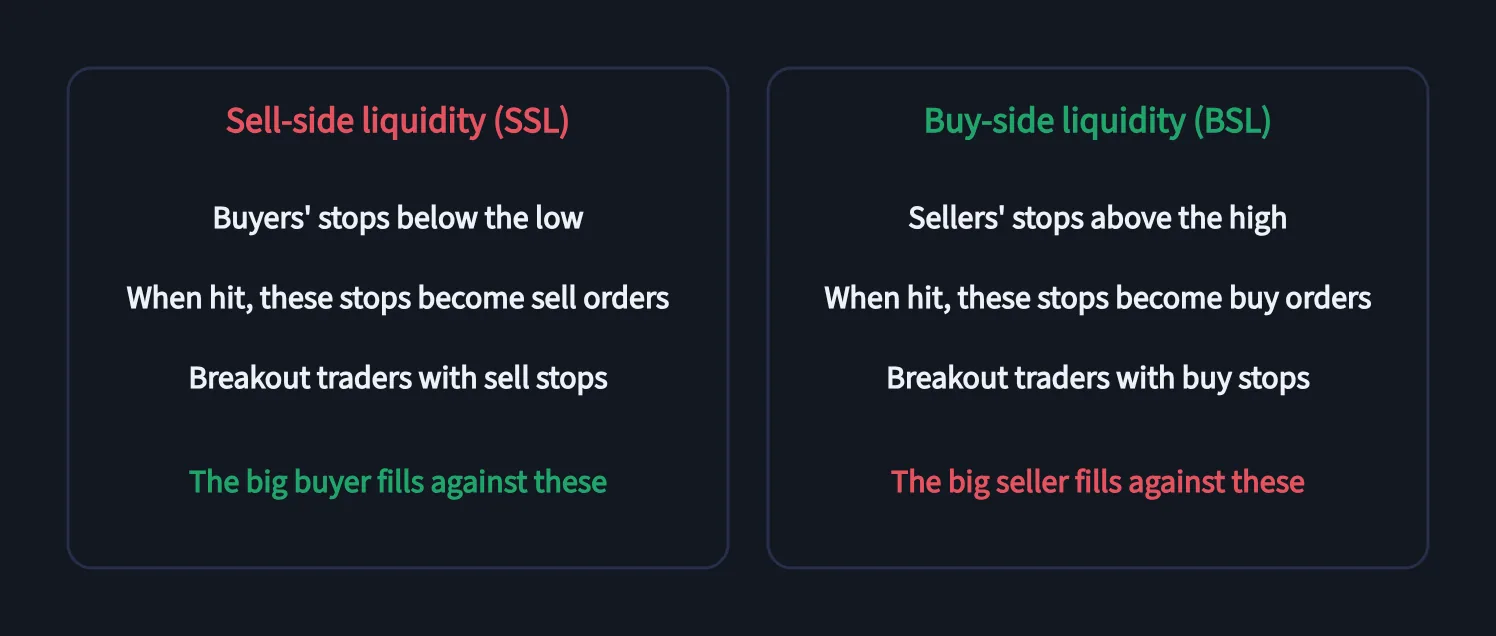
- Trend traders buy every pullback in an uptrend and put their stop below the last low. They build SSL.
- Traders selling resistance sell under a high with a stop above it. They build BSL.
- Breakout traders place buy stops above highs and sell stops below lows, adding liquidity on both sides.
- The large player fills its big order against all of these.
Remember: a big buyer buys near SSL, where sell orders are plentiful; a big seller sells near BSL, where buy orders are plentiful.
Where does liquidity build up?
| Place | Why |
|---|---|
| Obvious swing highs and lows | Everyone sees them and puts stops there |
| Equal highs or lows (EQH/EQL) | Two or three touches: many stops in one place |
| Beyond a trendline | Trendline traders' stops |
| Previous day and week high and low | Higher timeframe traders watch them |
| Session highs and lows (Asia, London) | Intraday traders' stops |
| Round numbers (such as 4,100.00) | Many traders put targets and stops on round numbers |
Each of these gets its own lesson next. The rule is the same everywhere: the more traders can see a level, the more liquidity sits behind it.
Three ways an SMC trader uses liquidity
1. As a target
Price often travels to the next obvious liquidity. If you are long, the BSL above is your natural target; if you are short, the SSL below.
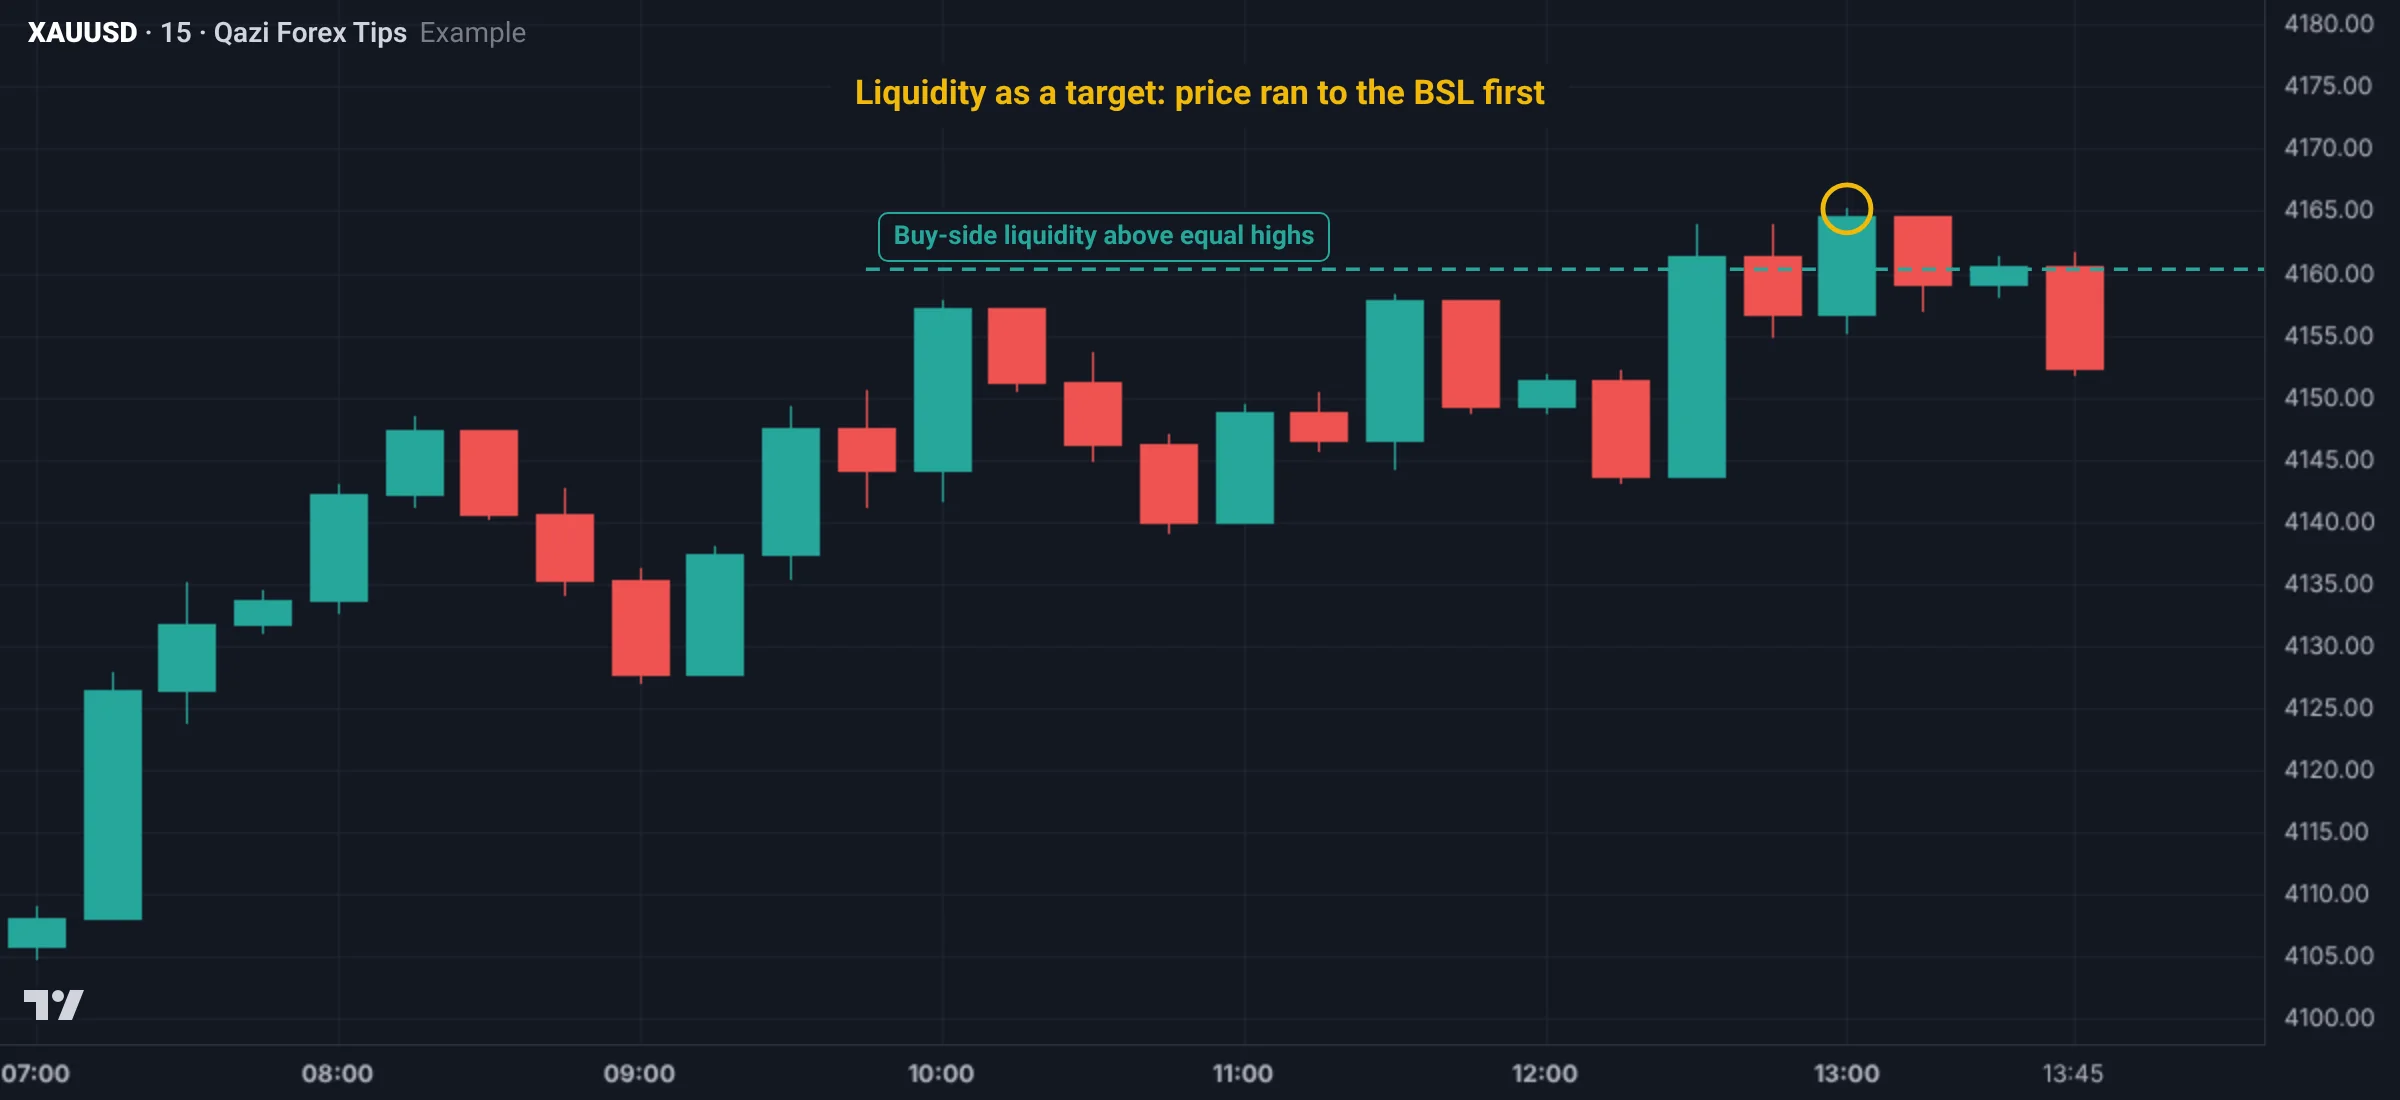
2. As an entry clue
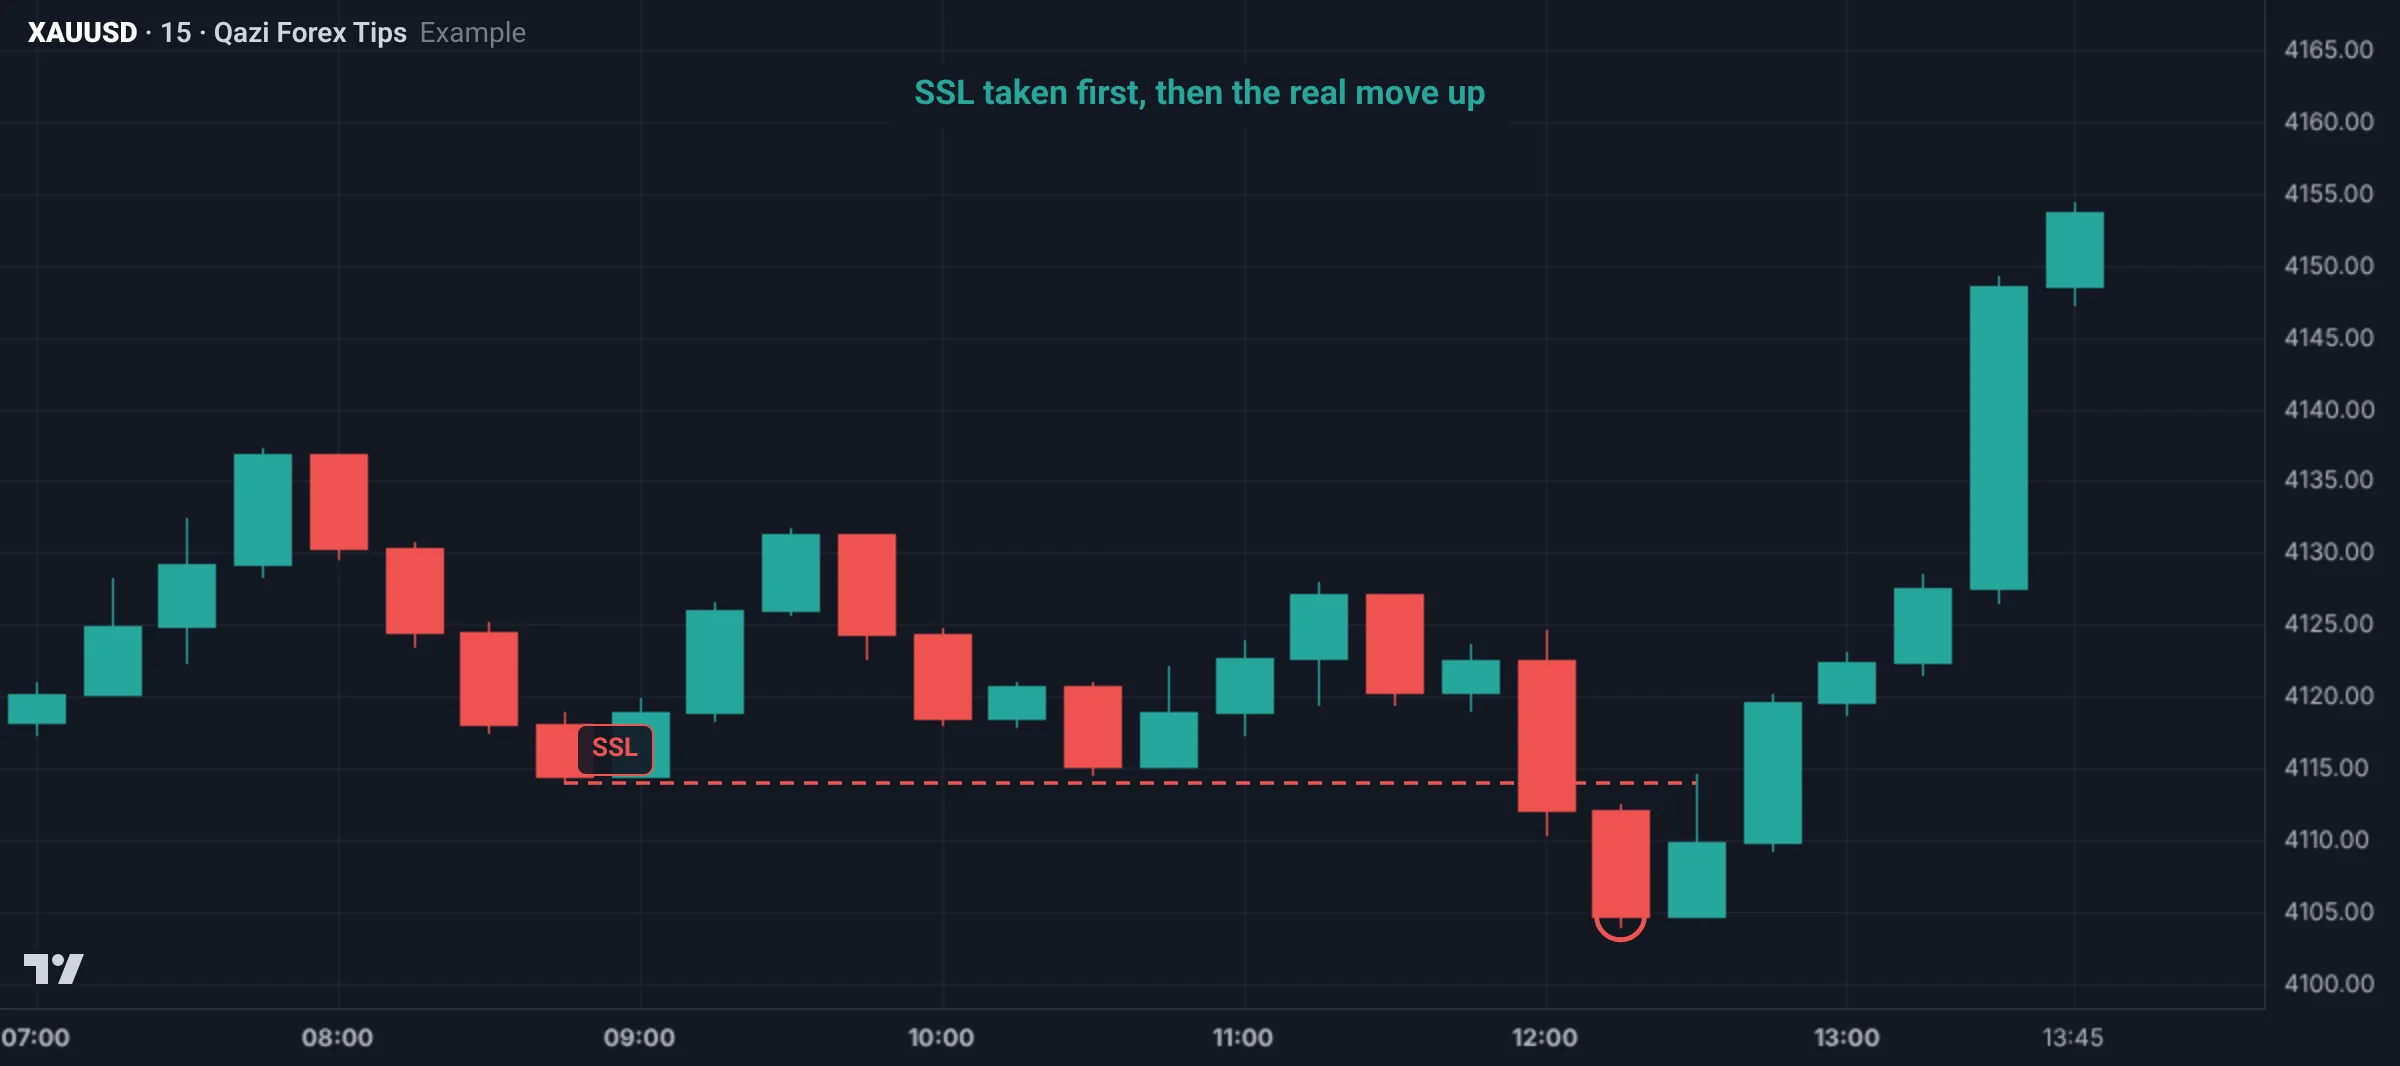
When price takes liquidity (a sweep) and quickly comes back, a move in the opposite direction often follows. A lower timeframe CHoCH after the sweep is the entry signal. Full details are in lesson 2.4.
3. To protect your own stop
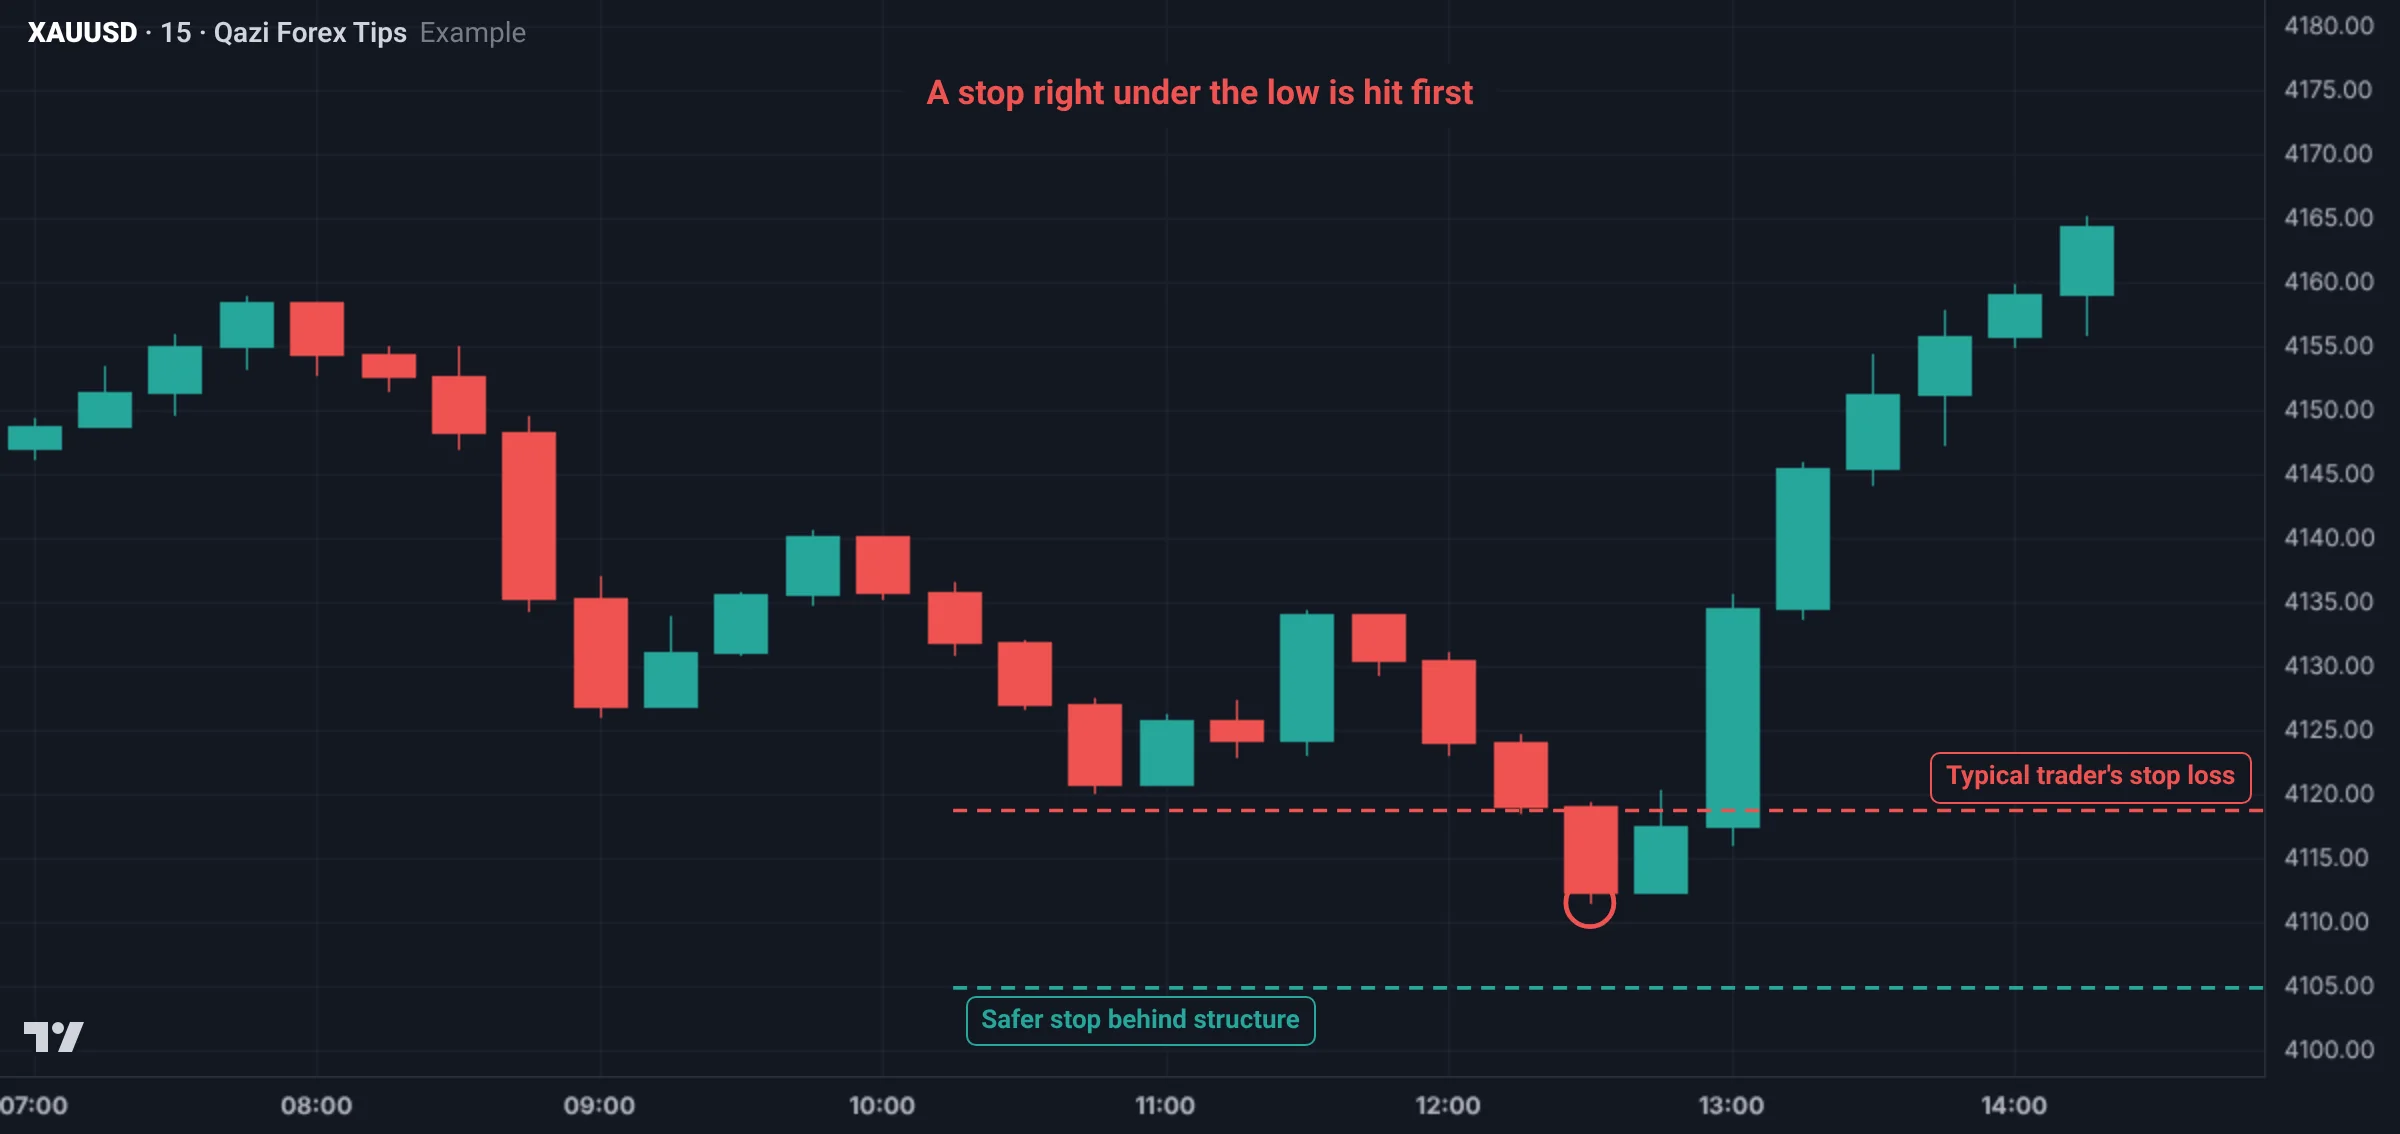
Don't place your stop right under the obvious low like everyone else; that is where the sweep comes first. Put it where price reaching it would really prove your idea wrong: behind structure, with some room.
A Gold example
Suppose Gold on H1 has been ranging between 4,120 and 4,150 for two days. It touched 4,150 three times and bounced from 4,120 twice.
- Above 4,150 (say 4,151 to 4,153) sit many sellers' stops and breakout buy stops: this is BSL.
- Below 4,120 sit buyers' stops and sell stops: this is SSL.
- If the H4 bias is bullish, price may first take the SSL under 4,120 and then head for the BSL at 4,150. The sweep under 4,120 is the buying opportunity, and the area near 4,150 is the target.
- If you buy at 4,121 with a stop at 4,119, the sweep may take your stop and price can then rally without you.
Real Gold chart examples
Gold H1 from 5 to 10 Nov 2026 (data: Dukascopy, bid price; Pakistan time):
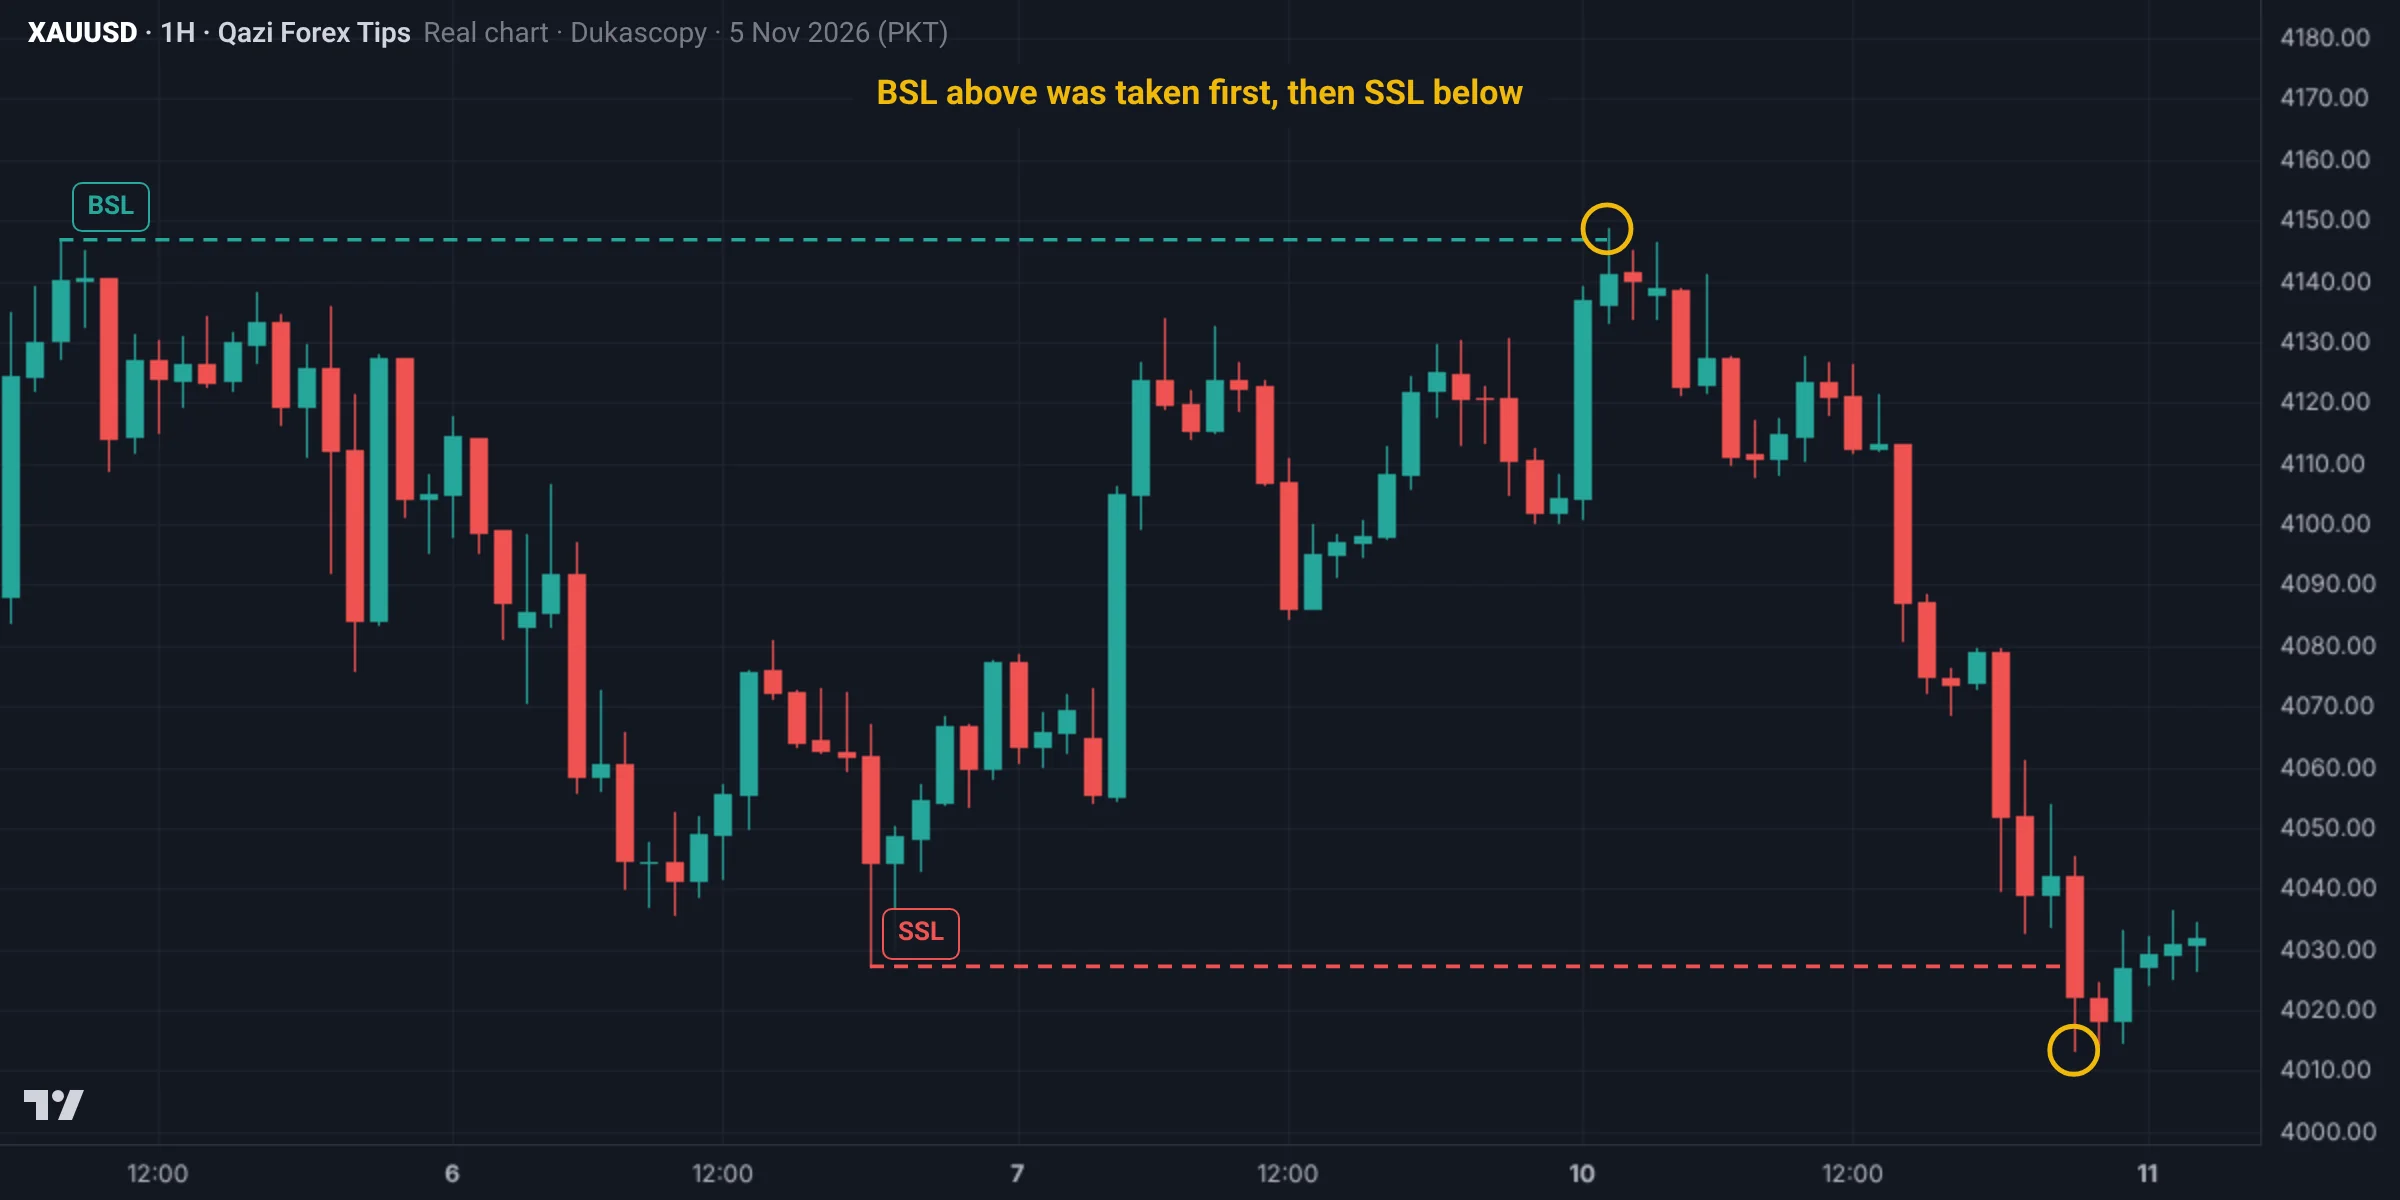
- The 5 Nov high at 4,146.8 was an obvious high. Sellers' stops and breakout buy stops gathered above it: BSL.
- The 6 Nov low at 4,027.2 (the NFP low) was an obvious low. Buyers' stops sat below it: SSL.
- At 01:00 on 10 Nov price reached 4,148.6: the BSL was taken, and price turned from there.
- At 21:00 the same day price reached 4,013.4: the SSL was taken too.
Both sides were cleared within days. Orders always gather behind obvious highs and lows.
Second example: BSL first, then SSL (29 Oct)
Gold H1 on 28 and 29 Oct 2026 (data: Dukascopy, bid price; Pakistan time):
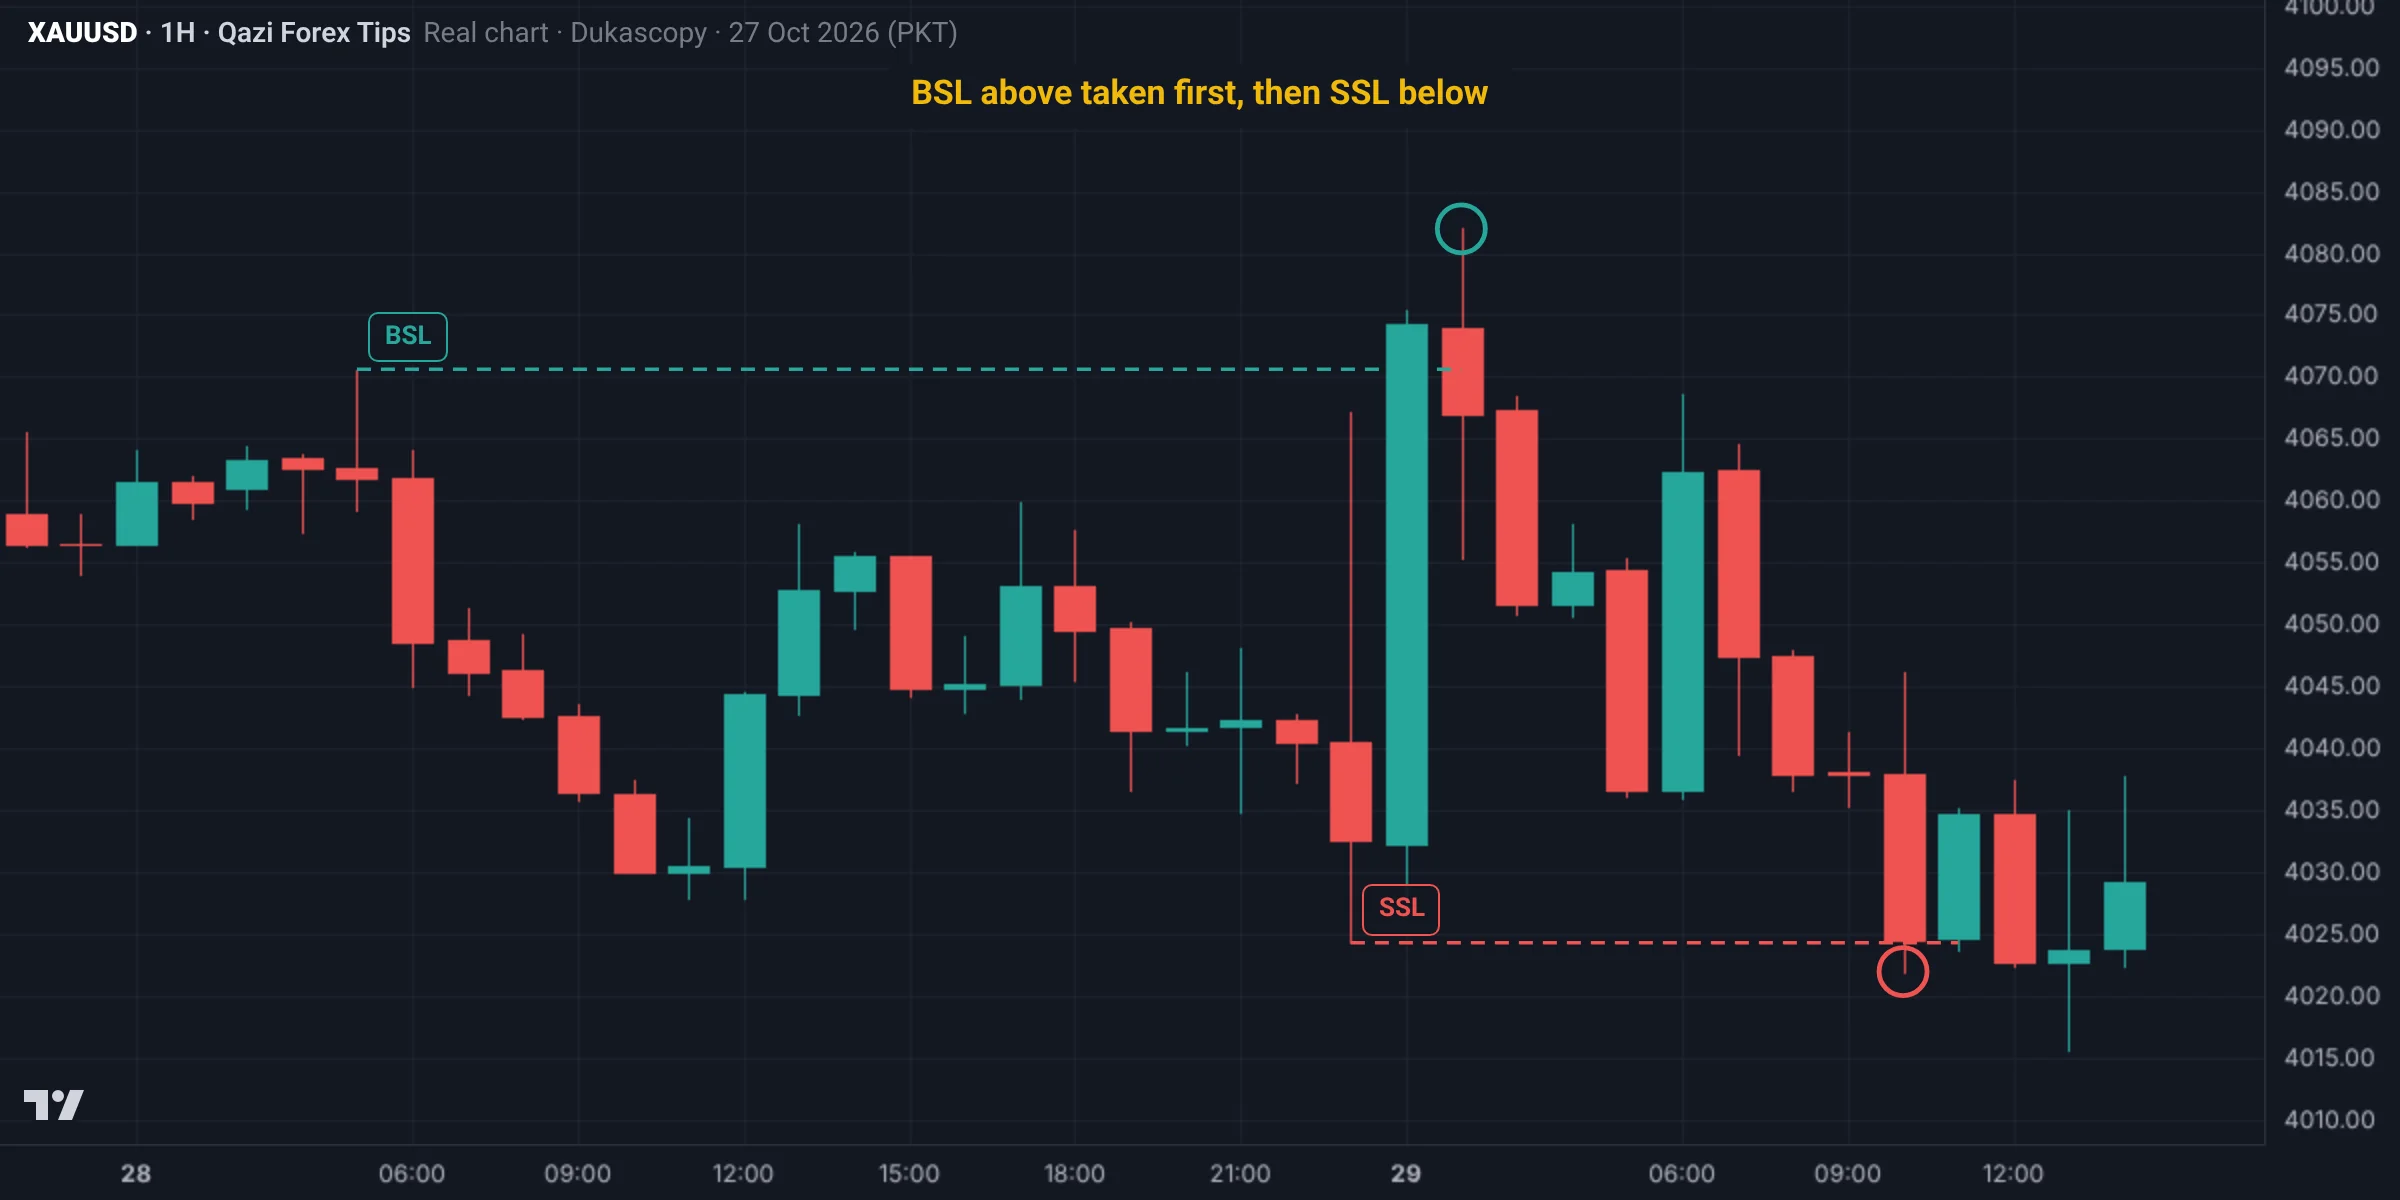
- BSL: the highest high of 28 Oct, 4,070.6 (at 05:00). Sellers' stops and breakout buyers' orders sat above it.
- SSL: the lowest low of 28 Oct, 4,024.3 (at 23:00). Buyers' stops sat below it.
- Early on 29 Oct price first rose and took the BSL at 4,082.0. Then it turned, and at 10:00 it reached 4,021.9, taking the SSL as well.
- By the next day Gold had fallen to 3,876.1.
Liquidity on both sides is visible on the chart; the real question is which side gets taken first and where price goes after that.
Common mistakes
Summary
- Liquidity is where stop losses and pending orders are resting.
- BSL sits above highs (buy orders), SSL below lows (sell orders).
- Large players fill their big orders against these.
- Liquidity is a target, an entry clue and a lesson in where to put your own stop.
Spot it on the chart: practice
This is a real Gold chart (Dukascopy data, Pakistan time). Study it and pick an answer. After you answer, the fully marked chart and the explanation appear.
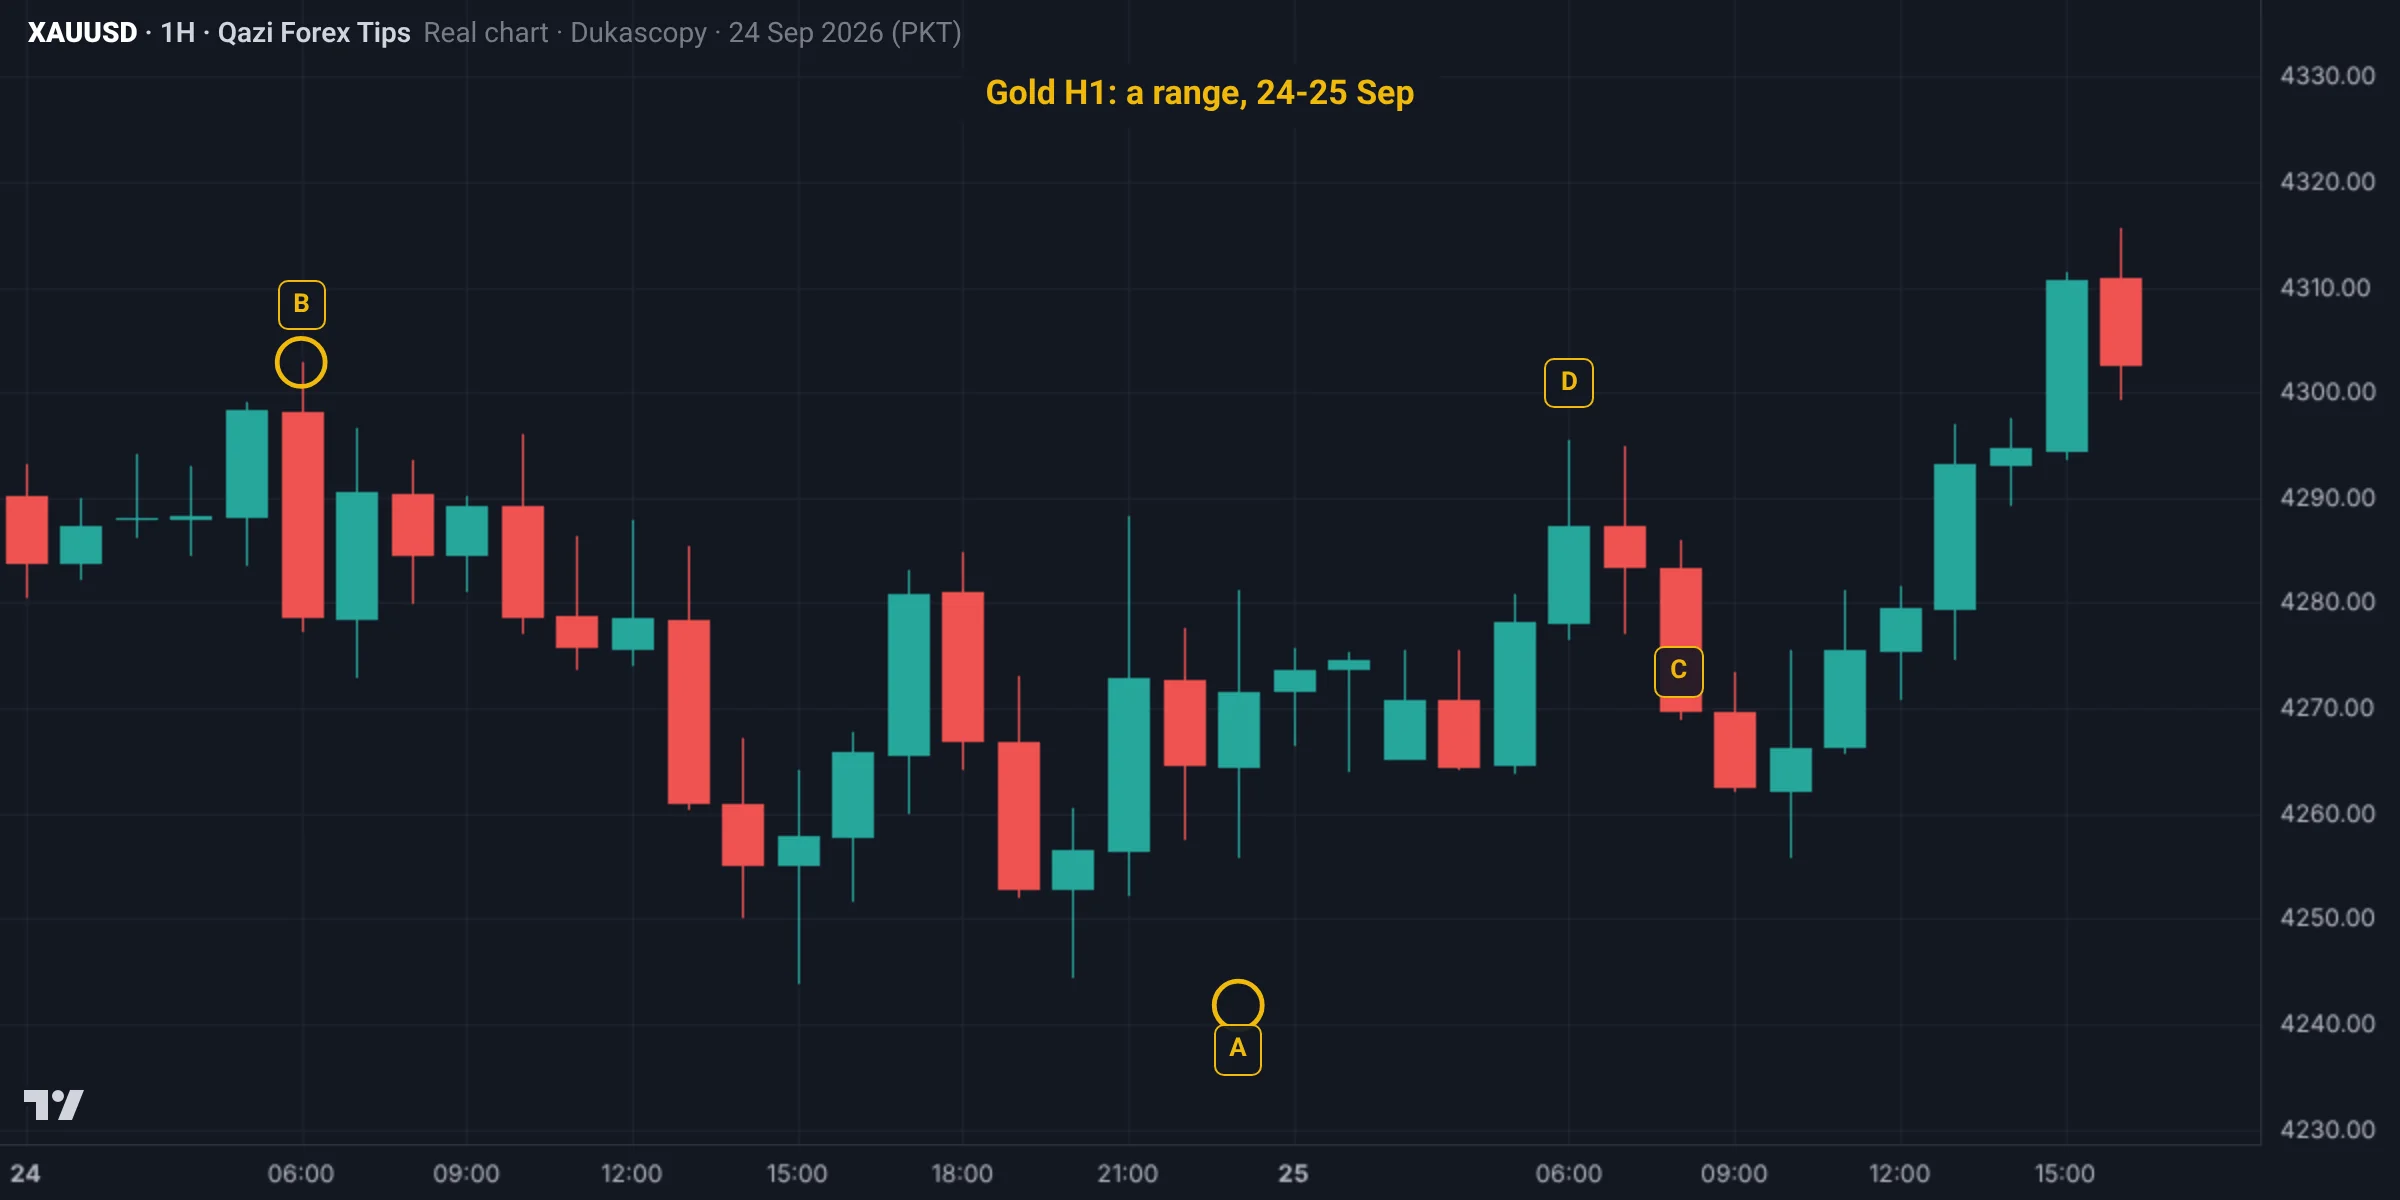
Where is the SSL (sell-stop liquidity) in this range?
Two almost equal lows formed on 24 Sep: 4,243.9 and 4,244.5. Buyers' stops sit below them: that is SSL (A). B is the old high with BSL above it, C is the middle of the range with no liquidity, and D is an ordinary high. This SSL broke on 28 Sep and a big drop followed.
The marked chart
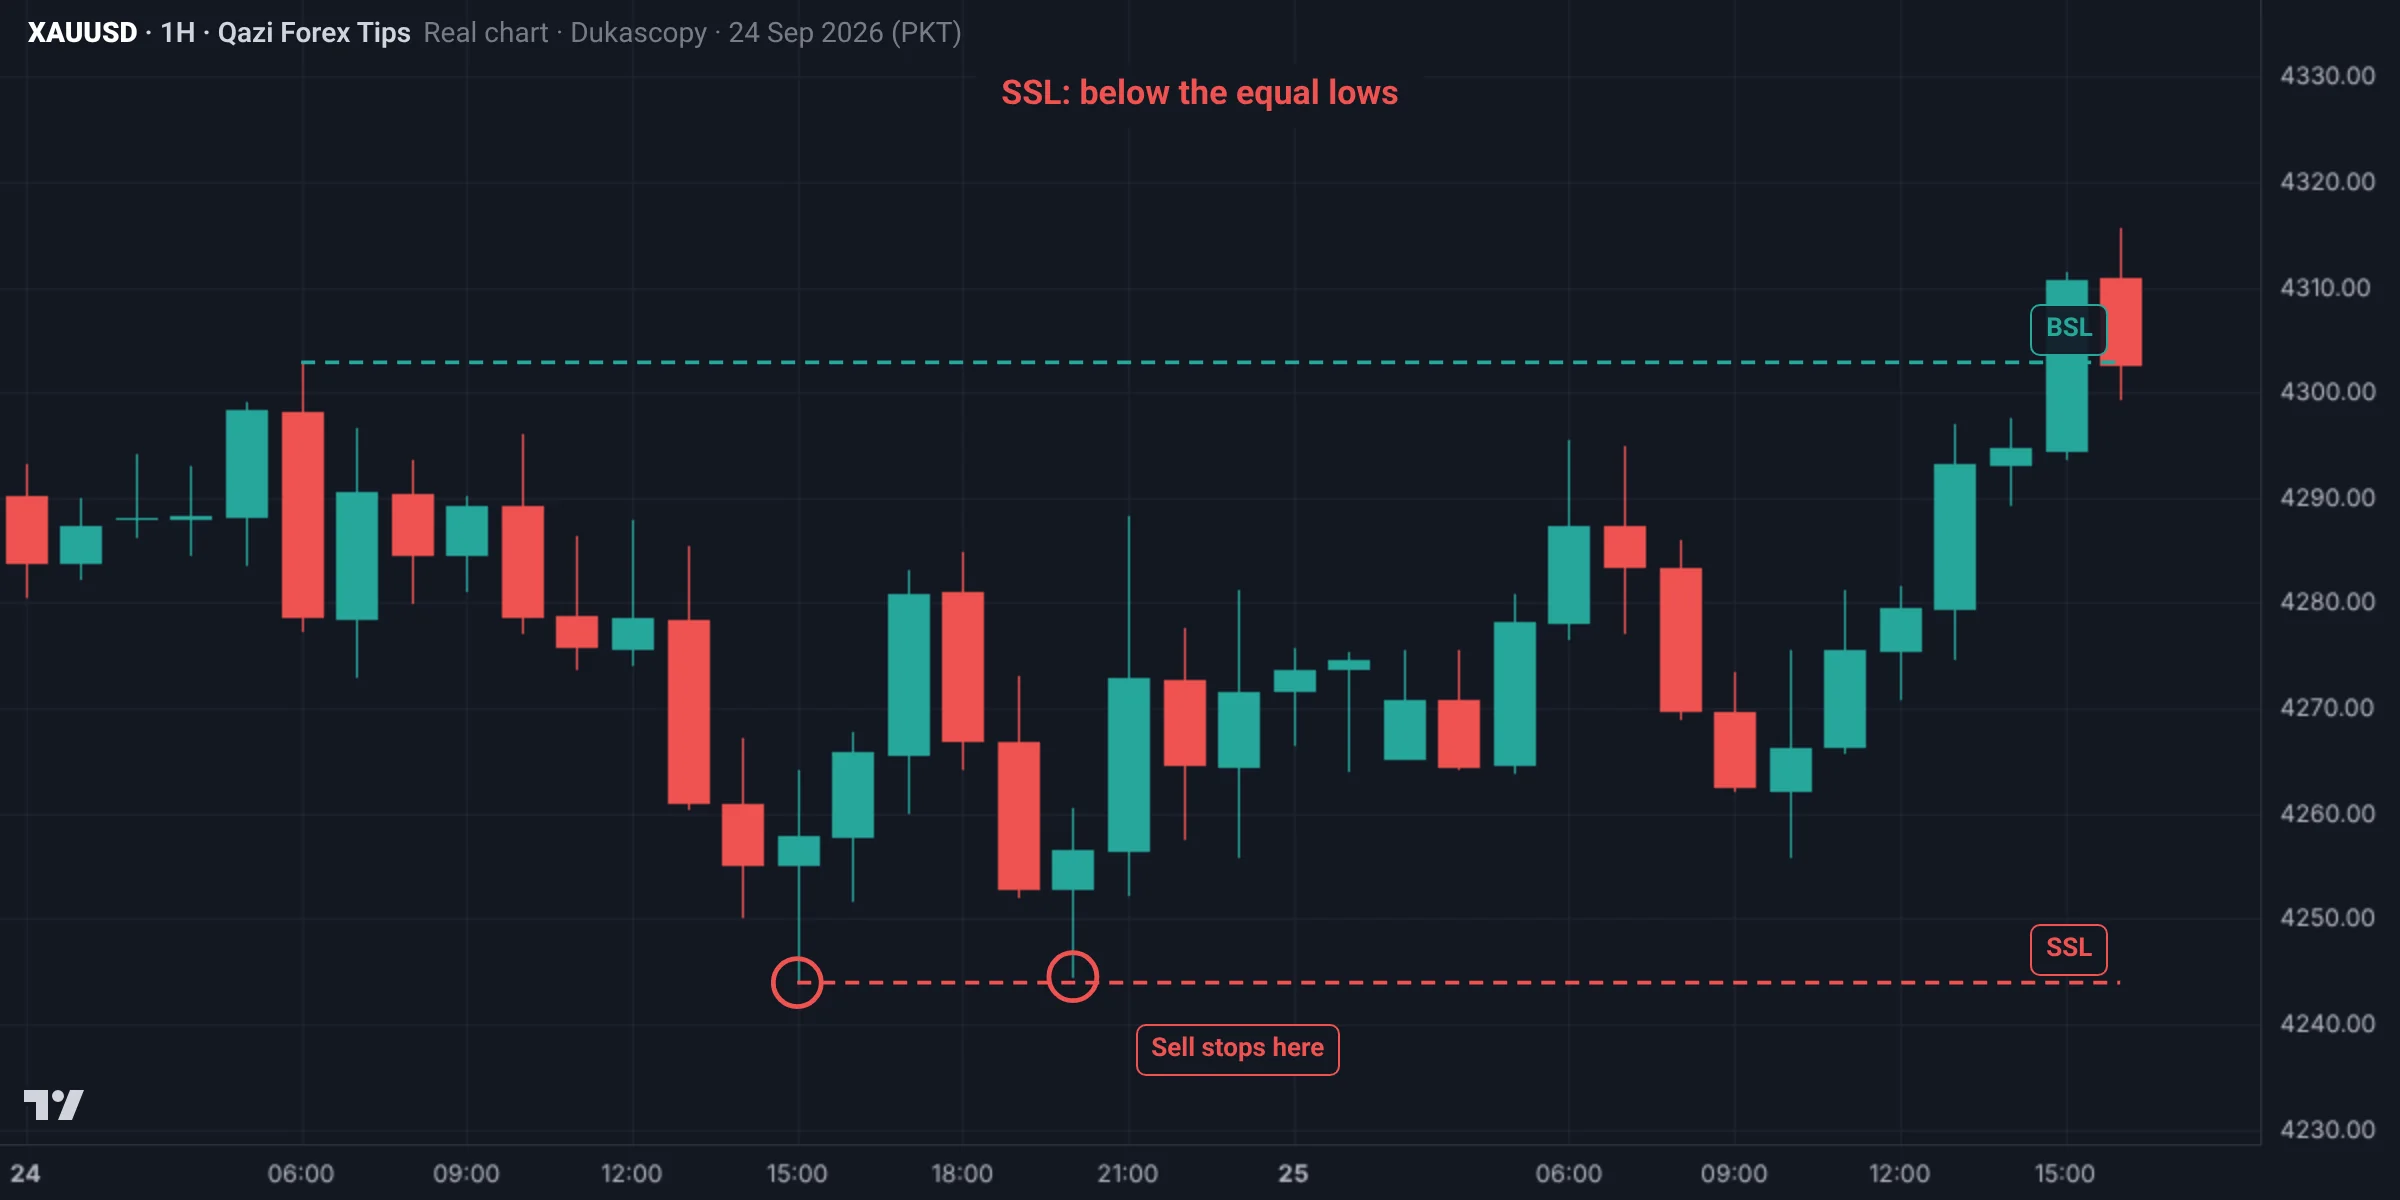
Test yourself: Lesson 2.1 quiz
9 questions. Pick one answer for each and you will see at once whether it is right and why. Your score and grade appear at the end. You need 70% to pass.
0 correct · 0 / 9
Question 1In SMC, what does liquidity mean?
Most traders put stops at the same kind of levels, so these places are visible on the chart.
Question 2Where is BSL?
Sellers' stops and breakout buy stops sit above highs and become buy orders when triggered.
Question 3When the orders at SSL are triggered, what do they become?
Easy rule: BSL orders become buys, SSL orders become sells.
Question 4Where does a big buyer prefer to buy?
To buy it needs sellers, and long traders' stops below lows become sell orders.
Question 5Which of these is NOT a place where liquidity builds?
Rule: the more traders can see a level, the more liquidity sits behind it.
Question 6What are the three ways an SMC trader uses liquidity?
After a sweep, a lower timeframe CHoCH is the entry signal.
Question 7Why not place your stop right under an obvious low?
Place it where price reaching it really proves you wrong: behind structure, with room.
Question 8Gold H1 has ranged between 4,120 and 4,150 for two days. H4 is bullish. What is price's likely path?
The sweep under 4,120 is the buying chance and the area near 4,150 is the target.
Question 9Which idea about liquidity is wrong?
Liquidity is not a conspiracy; it is simply how big orders are filled.
Lesson checklist
Tick each point once you understand it. Your ticks are saved in this browser.
Assignment
- On the Gold H1 chart for the last week, draw every obvious BSL (green) and SSL (red) line.
- Next to each line, write what kind of liquidity it is: swing, equal level, PDH/PDL, session or round number.
- Count how many of those levels price later took (touched or swept).
- Find 3 places where price went up after taking SSL, and 3 where it went down after taking BSL.
- Check your last 5 trades: was your stop right behind an obvious low or high?
- Post your chart in the group and write where you think the next liquidity is.
Post your assignment screenshots with your reasons in our free Facebook group, where your charts will be checked.
Join the free group
Who wrote this lesson
Dr. Qazi Abdul Basit, Ph.D
Ph.D in Business Administration and a forex and Gold trader since 2013. Founder of Qazi Forex Tips, which teaches traders in Pakistan and India price action, risk management and trading psychology in their own language: 65 student batches so far, free courses on YouTube, and MT5 tools for traders (QFT Replay Simulator, QFT Trade Assistant).
- 2013 trading since
- 75K+ Facebook group members
- 65 student batches
- 15K+ YouTube subscribers
How this lesson was made: the content follows Dr. Qazi's teaching method and years of trading. Real charts are built from Dukascopy Gold (XAUUSD) data, and backtest results are shown as they came out, even when negative. We do not sell signals, manage accounts or take money from any broker. Last updated: 19 November 2026.
Questions
What is liquidity in SMC?
Clusters of stop losses and pending orders, usually above obvious highs (buy-side) and below obvious lows (sell-side).
What are BSL and SSL?
Buy-side liquidity sits above highs as buy stops; sell-side liquidity sits below lows as sell stops.
Why does price hunt liquidity?
Large orders need opposite orders to fill, and those are concentrated at obvious stop levels.
Where should I put my stop so a sweep does not hit it?
Behind structure, where price reaching it proves your idea wrong, with some room beyond the obvious low or high.
Are round numbers liquidity too?
Yes. Many traders put targets and stops on round numbers, so orders gather there as well.
What does liquidity mean in forex?
Places where many orders gather, especially stop losses: above highs and below lows. Large players drive price to these places to fill their own big orders.
What do BSL and SSL stand for?
BSL is buy-side liquidity (above highs) and SSL is sell-side liquidity (below lows).
Read more
Education only, not financial advice. Trading forex, Gold and CFDs carries a high risk of loss. SMC concepts describe tendencies, not guarantees. Lesson 12 of 38.