 Qazi Forex Tips

Why this difference matters so much
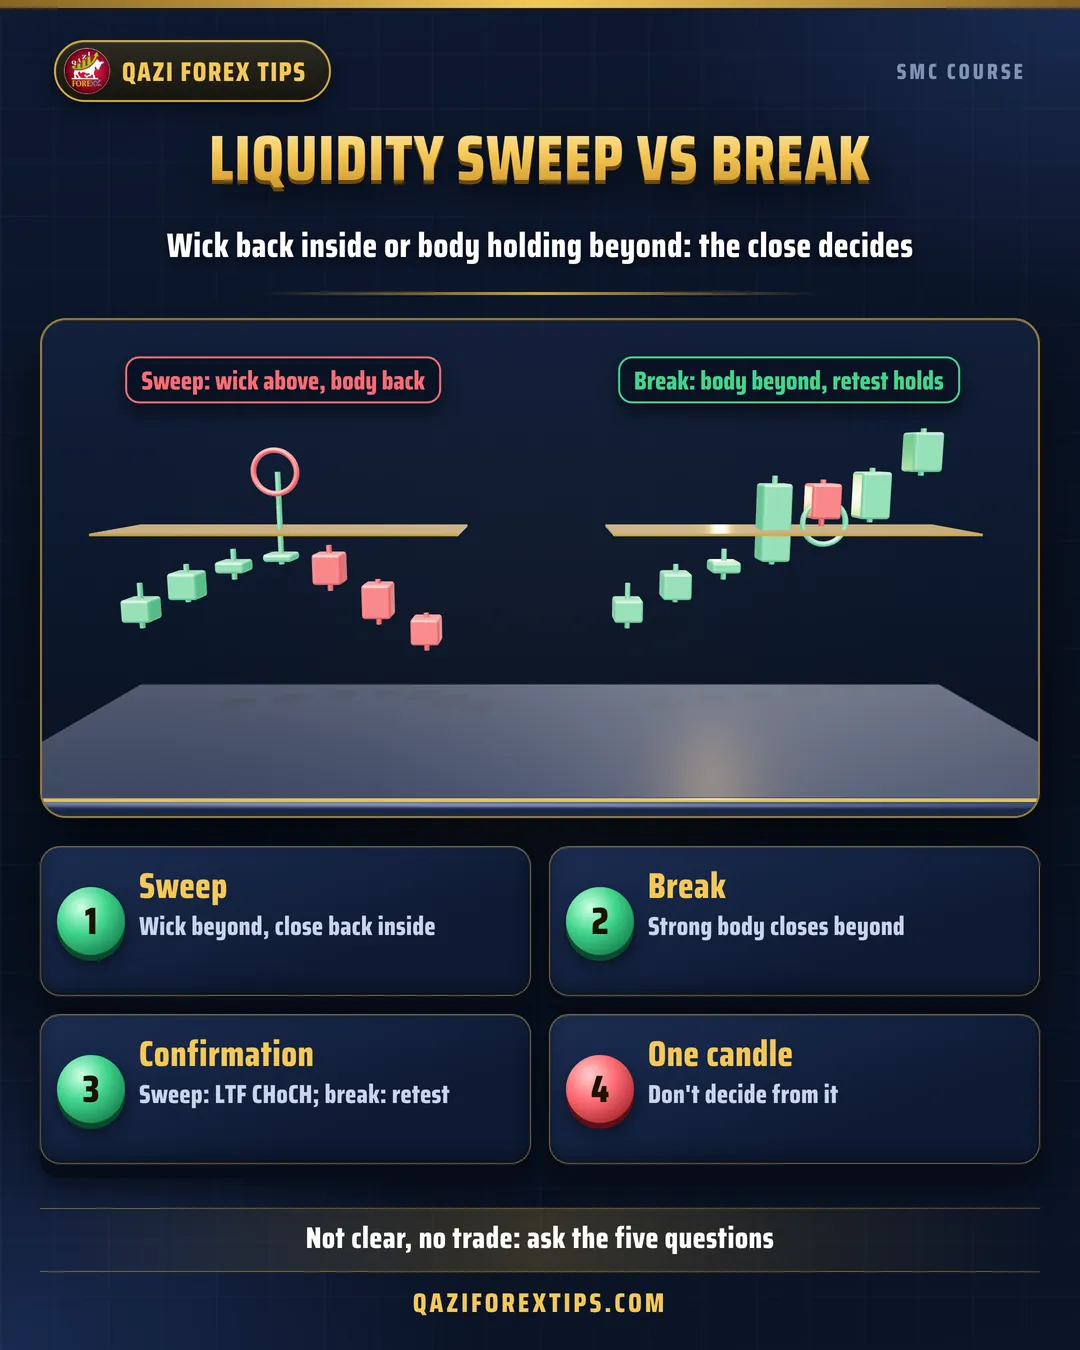
When price goes beyond an obvious high or low, two completely opposite stories can follow. In one, price takes the stops resting there and turns back: a sweep. In the other, price breaks the level, holds beyond it and continues: a break. Most new traders treat the two as the same. A high breaks, they buy at once, price comes back and the stop is hit. Or a low breaks, they sell at once, and price rallies. This is where accounts lose the most. After this lesson you will be able to decide calmly at any level whether it is a sweep or a break, how to trade each one, and when not to trade at all.
What is a sweep?
A sweep, also called a liquidity grab or stop hunt, is a move where price trades beyond a high or low, triggers the stop losses and stop orders resting there, but does not hold and closes back inside the level. On the chart it is easy to spot: only the wick goes beyond the level, the body closes back inside, and the next candles move the other way.
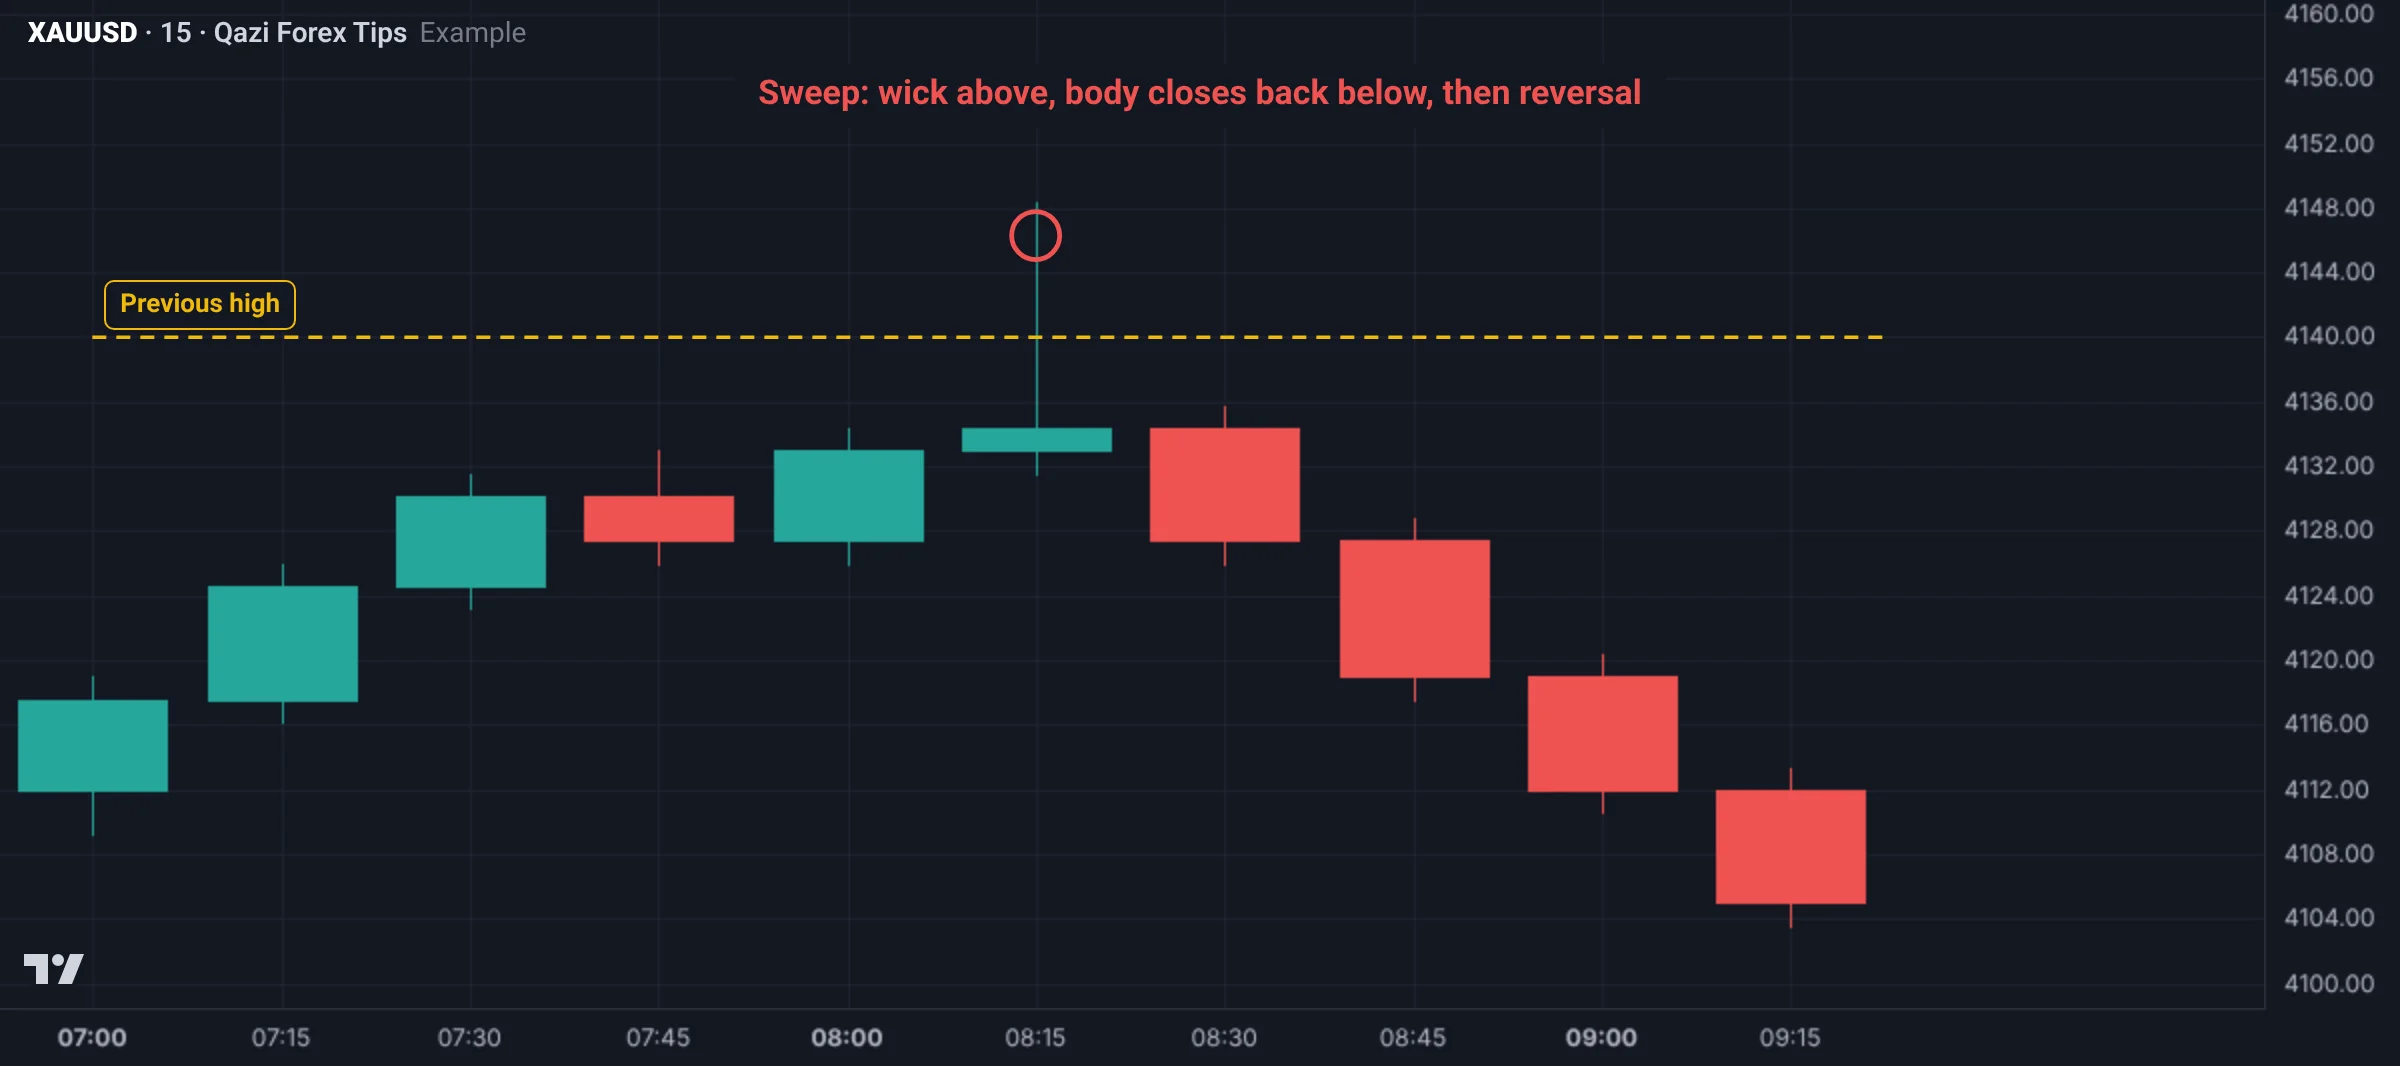
The order-flow story behind a sweep
Suppose Gold has been held below a high for hours. Above that high these orders gather:
- Traders who sold below the high have their stop losses just above it. When hit, each becomes a buy order.
- Breakout traders have buy stops above the high. They also turn into buy orders.
- A large player wants to sell a big size. To fill that sell it needs many buy orders.
- Price trades above the high, all those buy orders fire together, and the large player fills its sell against them.
- Now the buyers above are used up and the big sell is in, so price drops back quickly.
That is why the move after a sweep is often fast: the liquidity is gone and the large player has taken a side.
What is a break?
In a break, price closes beyond the level with a strong body and is accepted there. New buyers (or sellers) are happy with that price. When price comes back to the level (the retest), the old resistance now acts as support.
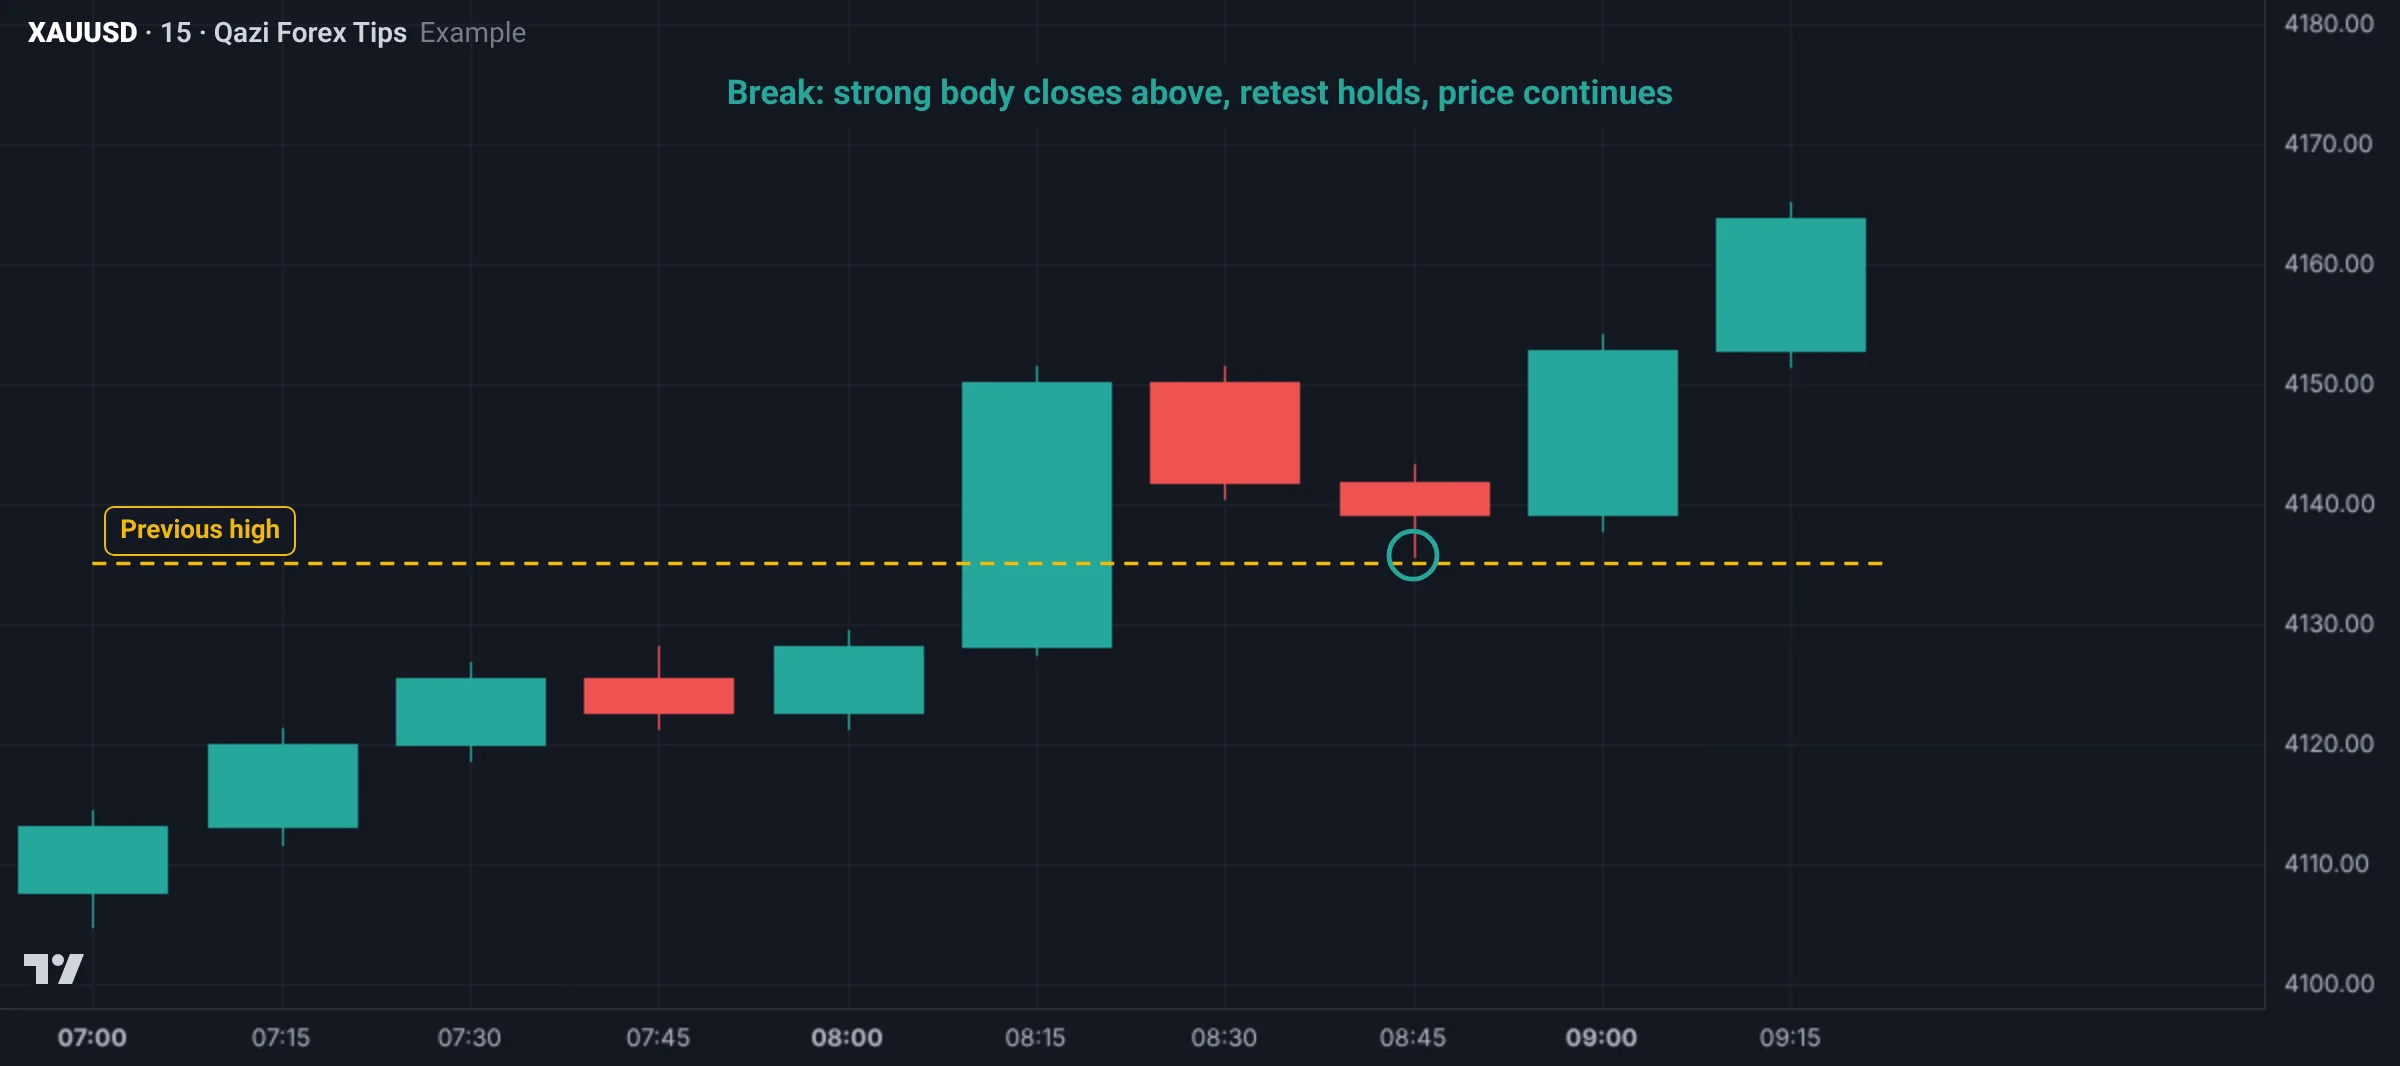
The story behind a break is the opposite: the large player is on the same side as the break. The buy stops above are fuel for it, and buyers keep coming after them. In SMC this is what a BOS looks like.
Five questions to tell them apart
| Question | Sweep | Break |
|---|---|---|
| Where did it close? | Back inside the level | Beyond the level |
| What kind of candle? | Long wick, small body | Big momentum body, small wick |
| Next candles? | Quickly back inside, opposite direction | Stay beyond the level |
| Retest? | Level is not crossed again | Level now holds from the other side |
| Higher timeframe bias? | Sweep in favour of the bias (e.g. SSL sweep in a bullish bias) | Break in the direction of the bias |
Question 1: Where did it close?
This is the first and most important question. While a candle is forming, price beyond the level can look very convincing, but the close decides. That is why every SMC decision uses the body close, not the wick.
Question 2: What kind of candle?
A break candle is usually a big momentum candle: the body is a large part of the range and the wick is small. A sweep candle has a long wick that shows price went there and was rejected.
Question 3: What are the next candles doing?
After a break, the next one or two candles stay beyond the level. After a sweep, the next candles come back inside quickly and show momentum the other way.
Question 4: What happened on the retest?
The real confirmation of a break is the retest. If price returns to the level and the level holds, the break is valid. If price closes back inside on the retest, the "break" was actually a sweep.
Question 5: What does the higher timeframe say?
In a bullish bias, a sweep of SSL below is a very good buying opportunity, while a break of BSL above is often a real break. In a bearish bias, the opposite. Treat every signal against the bias with more suspicion.
The two-candle sweep
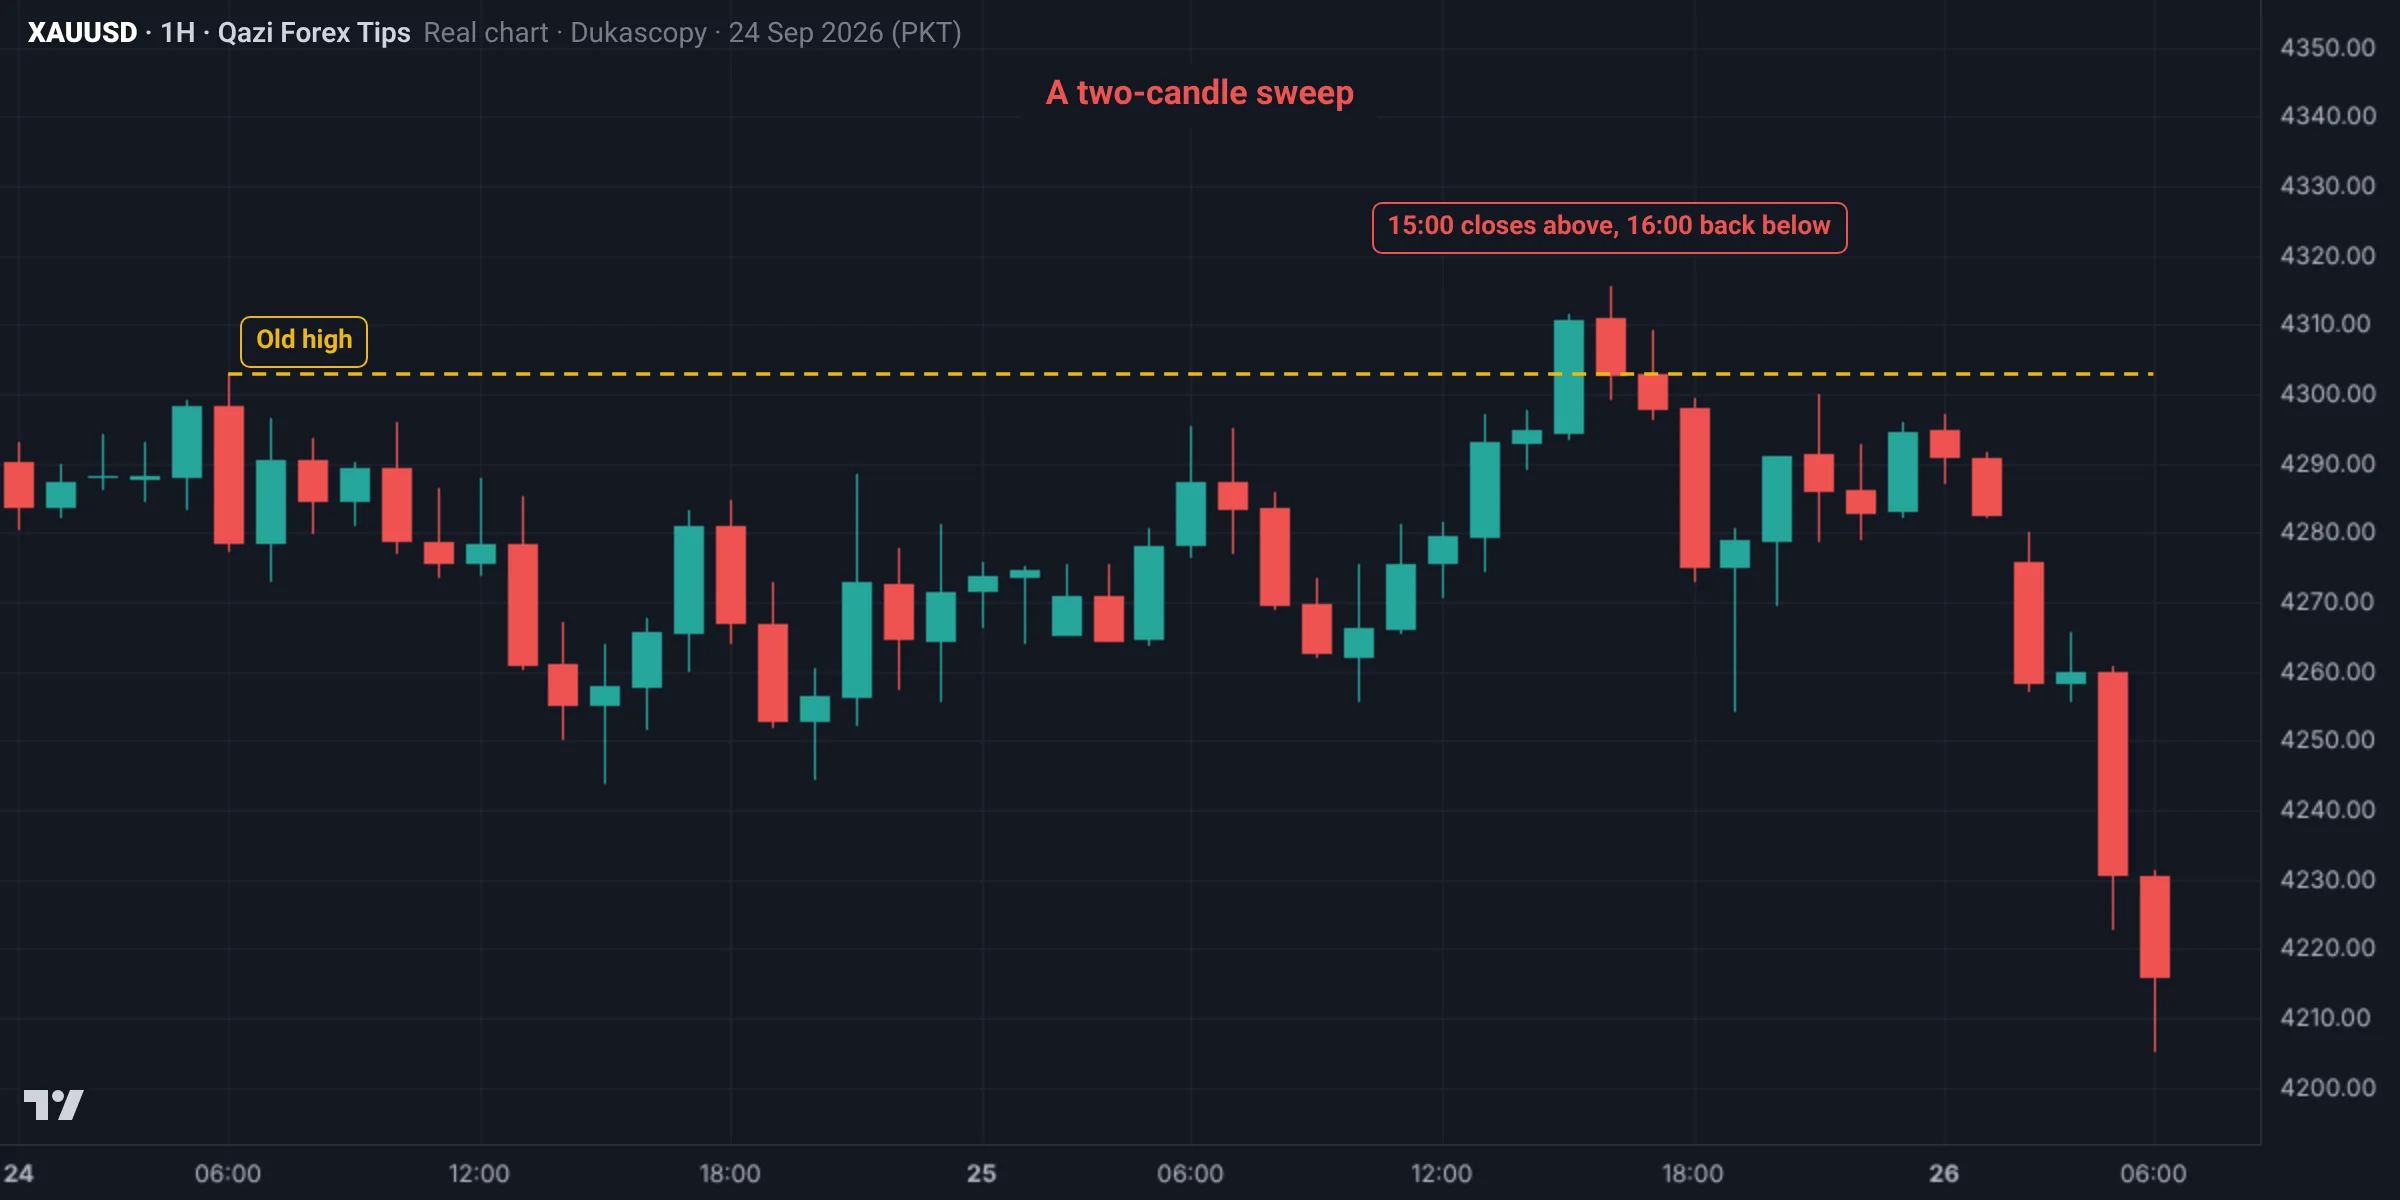
Sometimes a candle even closes above the level and traders think the break has happened. But the next candle takes the whole move back and closes below the level. That is also a sweep, just over two candles.
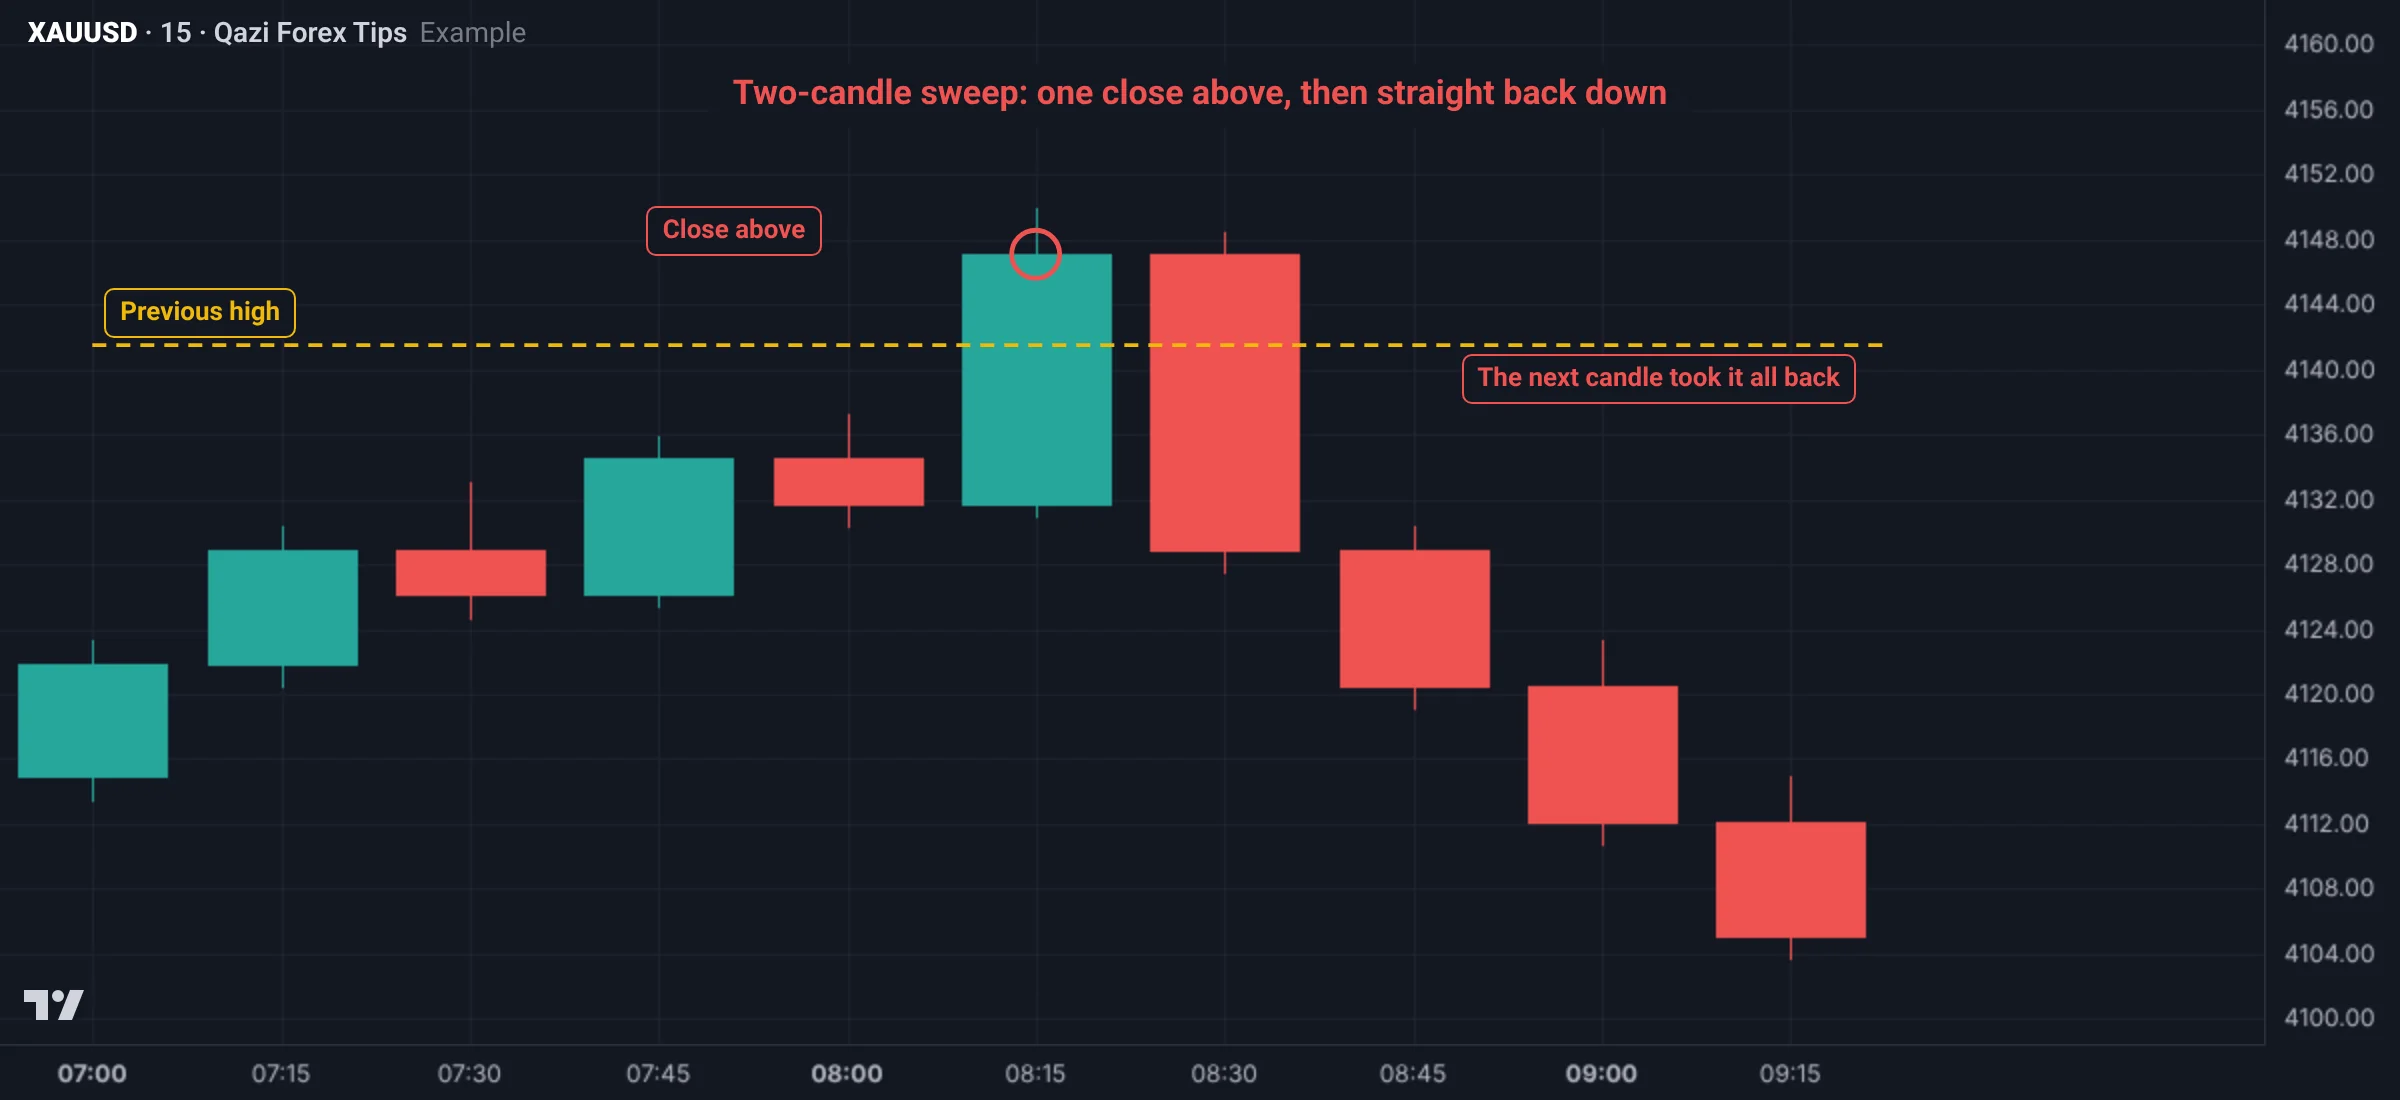
So watch the next one or two candles even after a close. If a big opposite candle engulfs the candle that closed above, treat it as a sweep, not a break.
The timeframe rule
The same move looks different on different timeframes. What is a single wick on H1 (a sweep) can be a full multi-candle break on M5. So first decide which timeframe's level you are trading, and judge sweep or break with that timeframe's close.
- For an H4 or H1 level, decide with the H1 or H4 close.
- Confirmation (CHoCH) comes on a lower timeframe such as M15 or M5.
How to trade a sweep: step by step
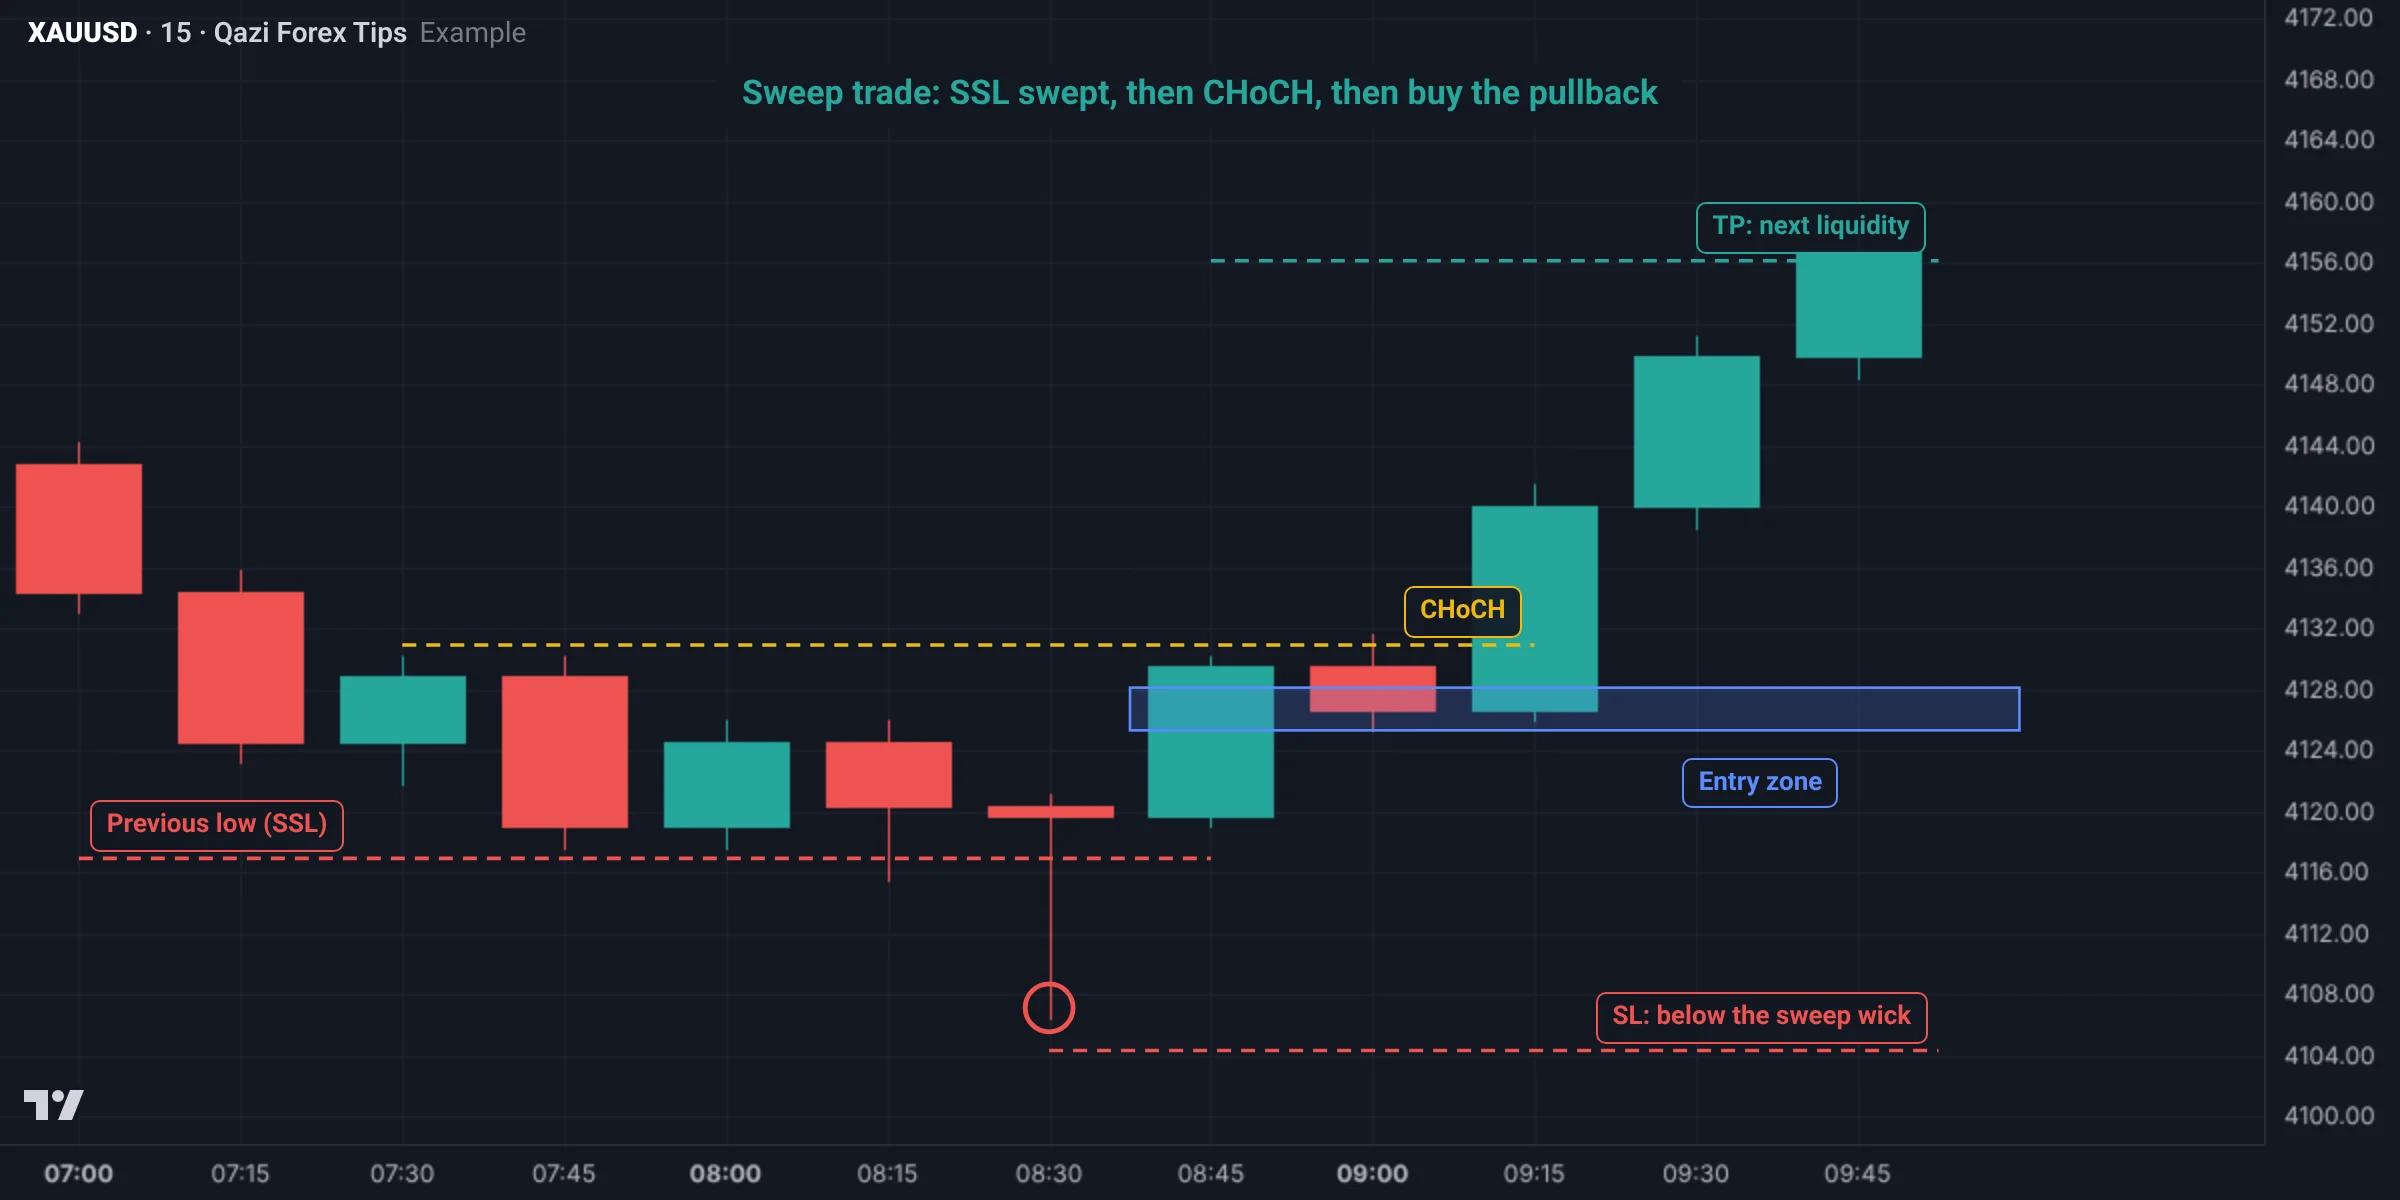
- Bias: the higher timeframe is bullish and price is approaching SSL below (previous low, PDL or Asian low).
- Sweep: price wicks below the low and the body closes back above.
- Confirmation: on a lower timeframe price breaks the last LH: a bullish CHoCH.
- Entry: on the pullback after the CHoCH, in the FVG or order block of that move. Don't chase the CHoCH candle.
- Stop: below the sweep wick, with some room. If price closes below that wick again, the sweep idea was wrong.
- Target: the next clear liquidity, such as the high above or PDH, slightly before it.
- Lot: size it from the stop distance at 1% risk. If the RR is not at least 1:2, skip the trade.
How to trade a break: step by step
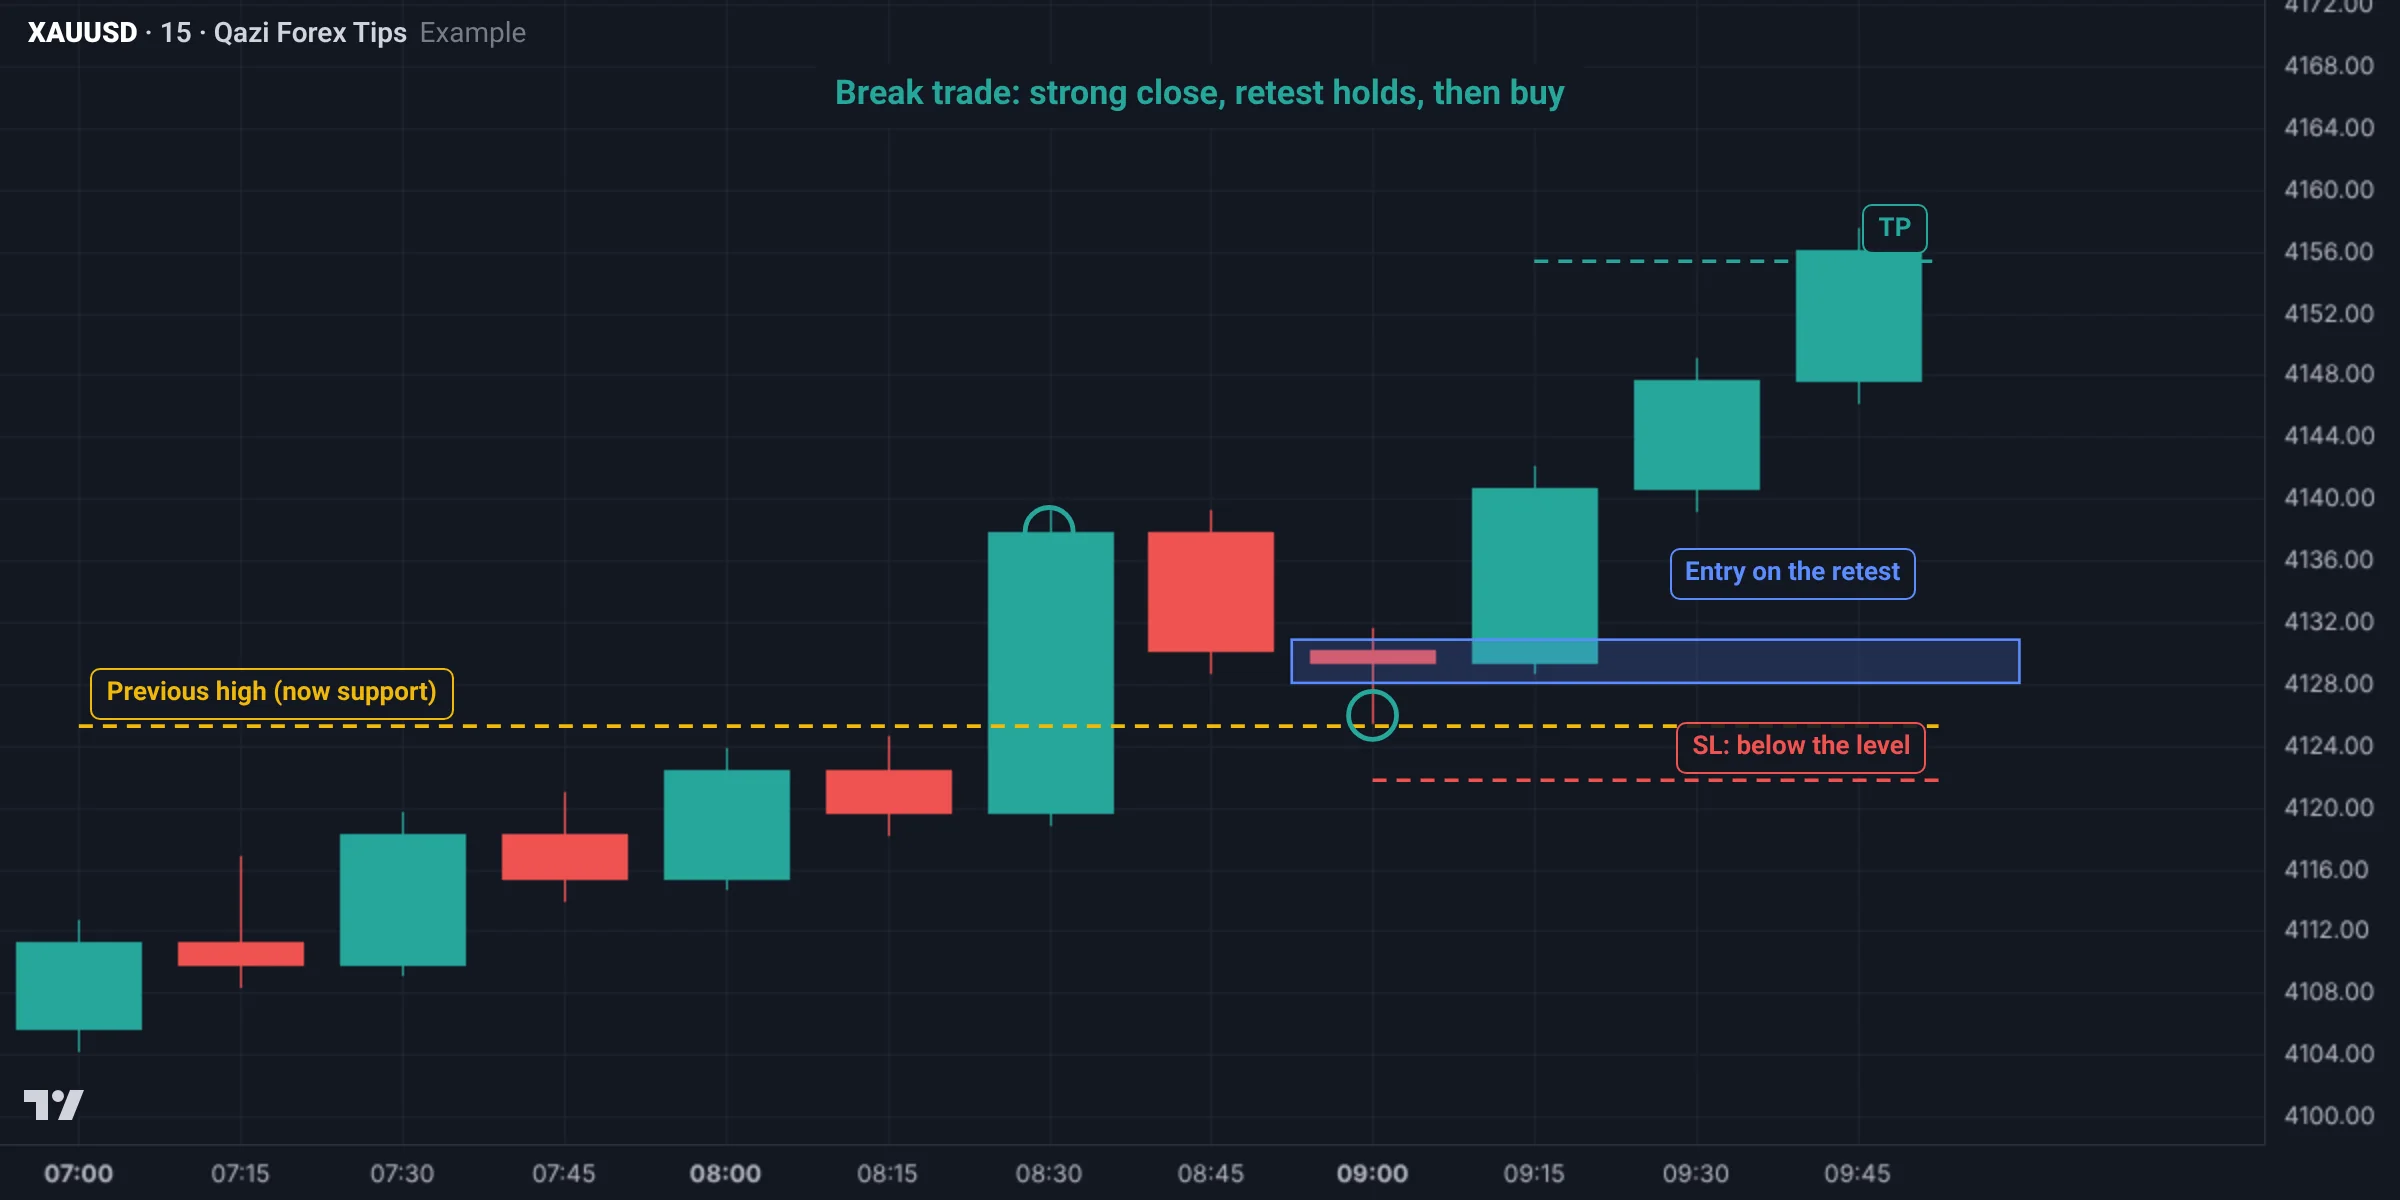
- Bias: the higher timeframe is bullish, and the BSL above the high is an obstacle on the way rather than the target.
- Break: a strong momentum candle closes above the high with a small wick.
- Wait: no entry on the break candle. Let price come back to the level.
- Retest: price touches the level and is rejected; no candle closes back below it.
- Entry: on the retest, or on a bullish confirmation on a lower timeframe after it.
- Stop: below the level. A close below the level means the break failed.
- Target: the next liquidity, such as PWH or the next major high.
A Gold example
Suppose Gold is bullish on H1. The Asian session low is at 4,120.00.
- As London opens, price drops to 4,116.50, below the Asian low, but the H1 candle closes at 4,121.20. That is a sweep.
- On M5 price breaks the last LH at 4,124.00: a bullish CHoCH.
- The pullback reaches the FVG at 4,122.00: buy there. Stop at 4,115.50 (one dollar below the sweep wick), a 6.5-dollar stop.
- PDH is at 4,136.00 above, target 4,135.00: a 13-dollar target, RR about 1:2.
- With a 1,000-dollar account and 1% risk (10 dollars), lot = 10 ÷ (6.5 × 100) ≈ 0.015. Always round down, so 0.01, to keep risk within 1%. The full lot method is in the Phase 0 risk lesson.
If that H1 candle had closed near 4,116.50 and the next candles had stayed below, it would have been a bearish break, and the buy idea would be over.
When not to trade at all
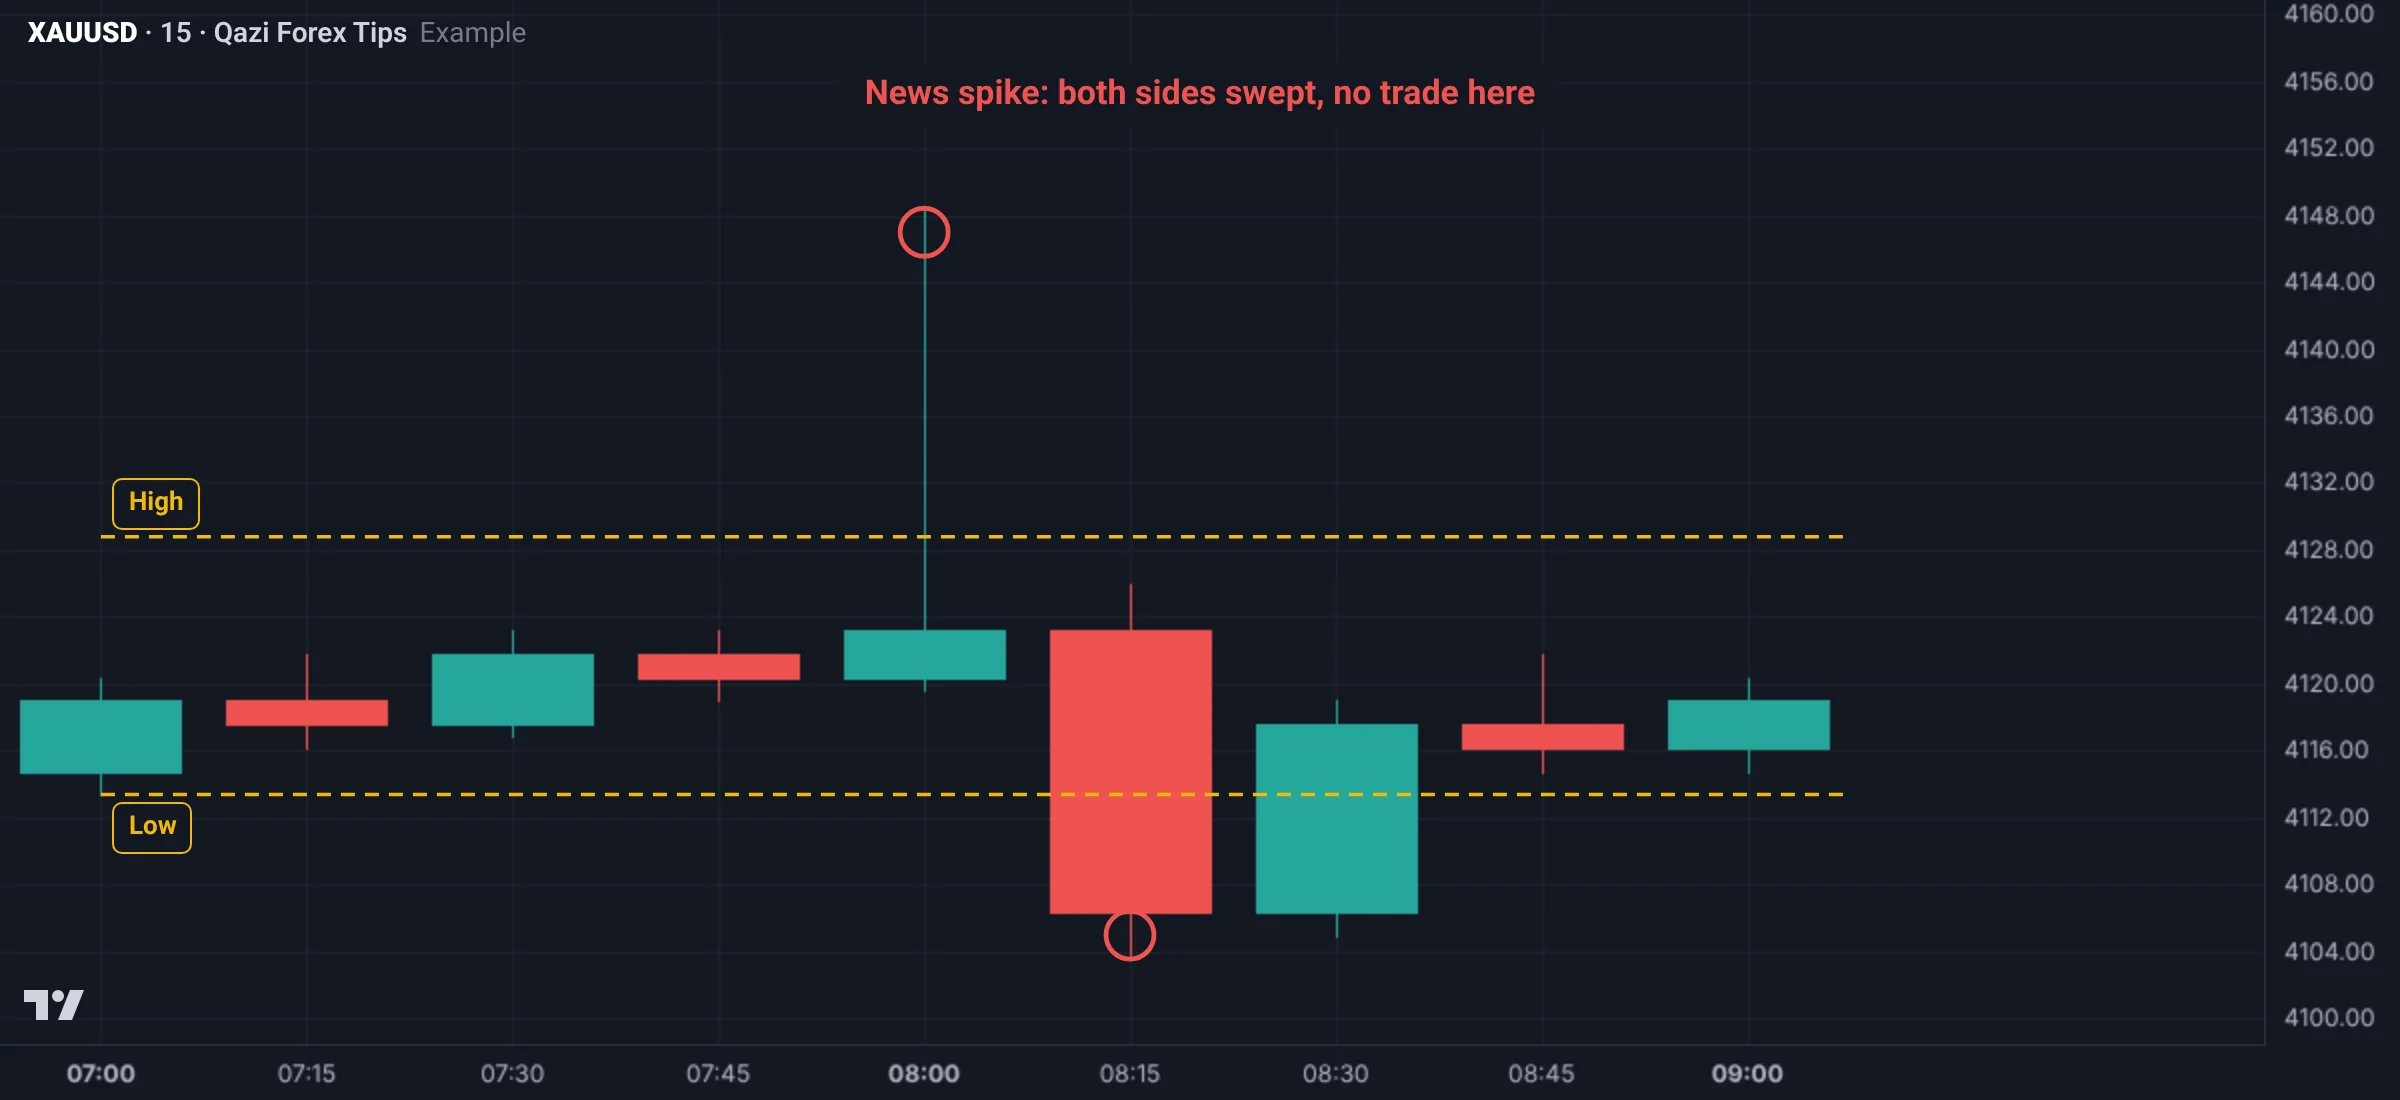
- Around big news (NFP, CPI, rate decisions): price breaks levels on both sides and spreads widen. Let the first clean picture form after the news.
- In the middle of a range: when price is not near clear liquidity, the sweep-or-break question does not even arise.
- When the five answers are mixed: a close back inside but the next candles beyond, or the bias against it. When in doubt, no trade.
- Inside the small Asian range: "breaks" there often become sweeps in London.
Real Gold chart examples
Gold H1 on 10 Nov 2026 (data: Dukascopy, bid price; Pakistan time). Both appeared on the same day:
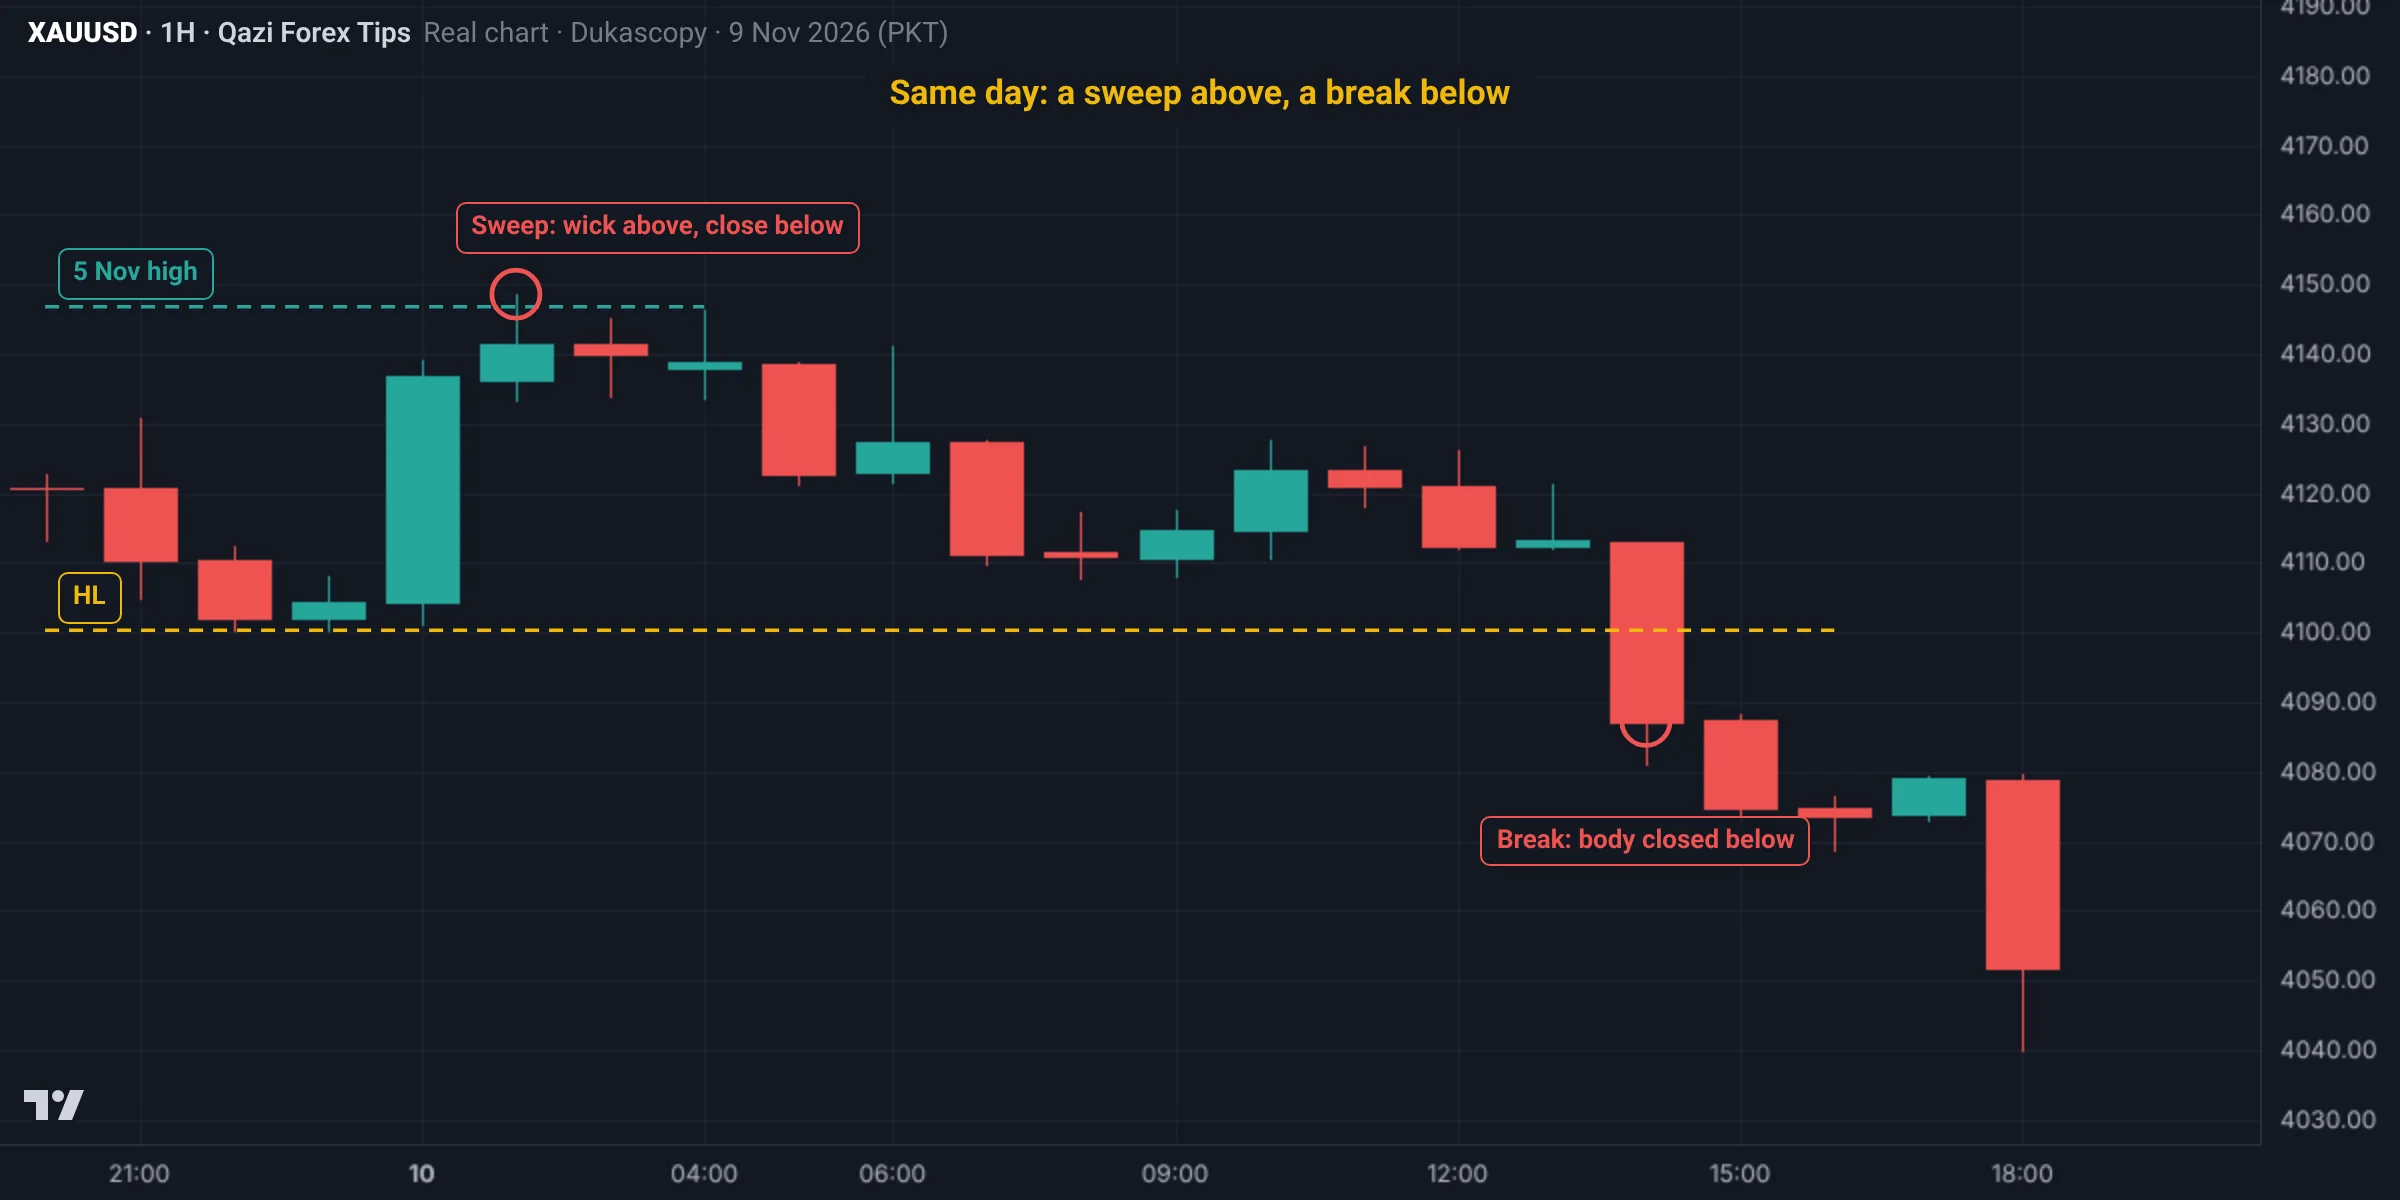
- Sweep (01:00): the wick reached 4,148.6, above the 5 Nov high at 4,146.8, but the candle closed at 4,141.3, below the high. Liquidity was taken, but price did not hold there. The next candles did not hold above either.
- Break (14:00): the candle body closed at 4,087.2, below the HL at 4,100.3, and the next candle closed even lower at 4,074.8. Price stayed beyond the level: a break.
The difference is one thing: where the close was, and whether price held beyond or came back.
Second example: sweep below, break above (2 Nov)
The first example was a sweep above and a break below; this is the reverse. Gold H1 from 30 Oct to 2 Nov 2026 (data: Dukascopy, bid price; Pakistan time):
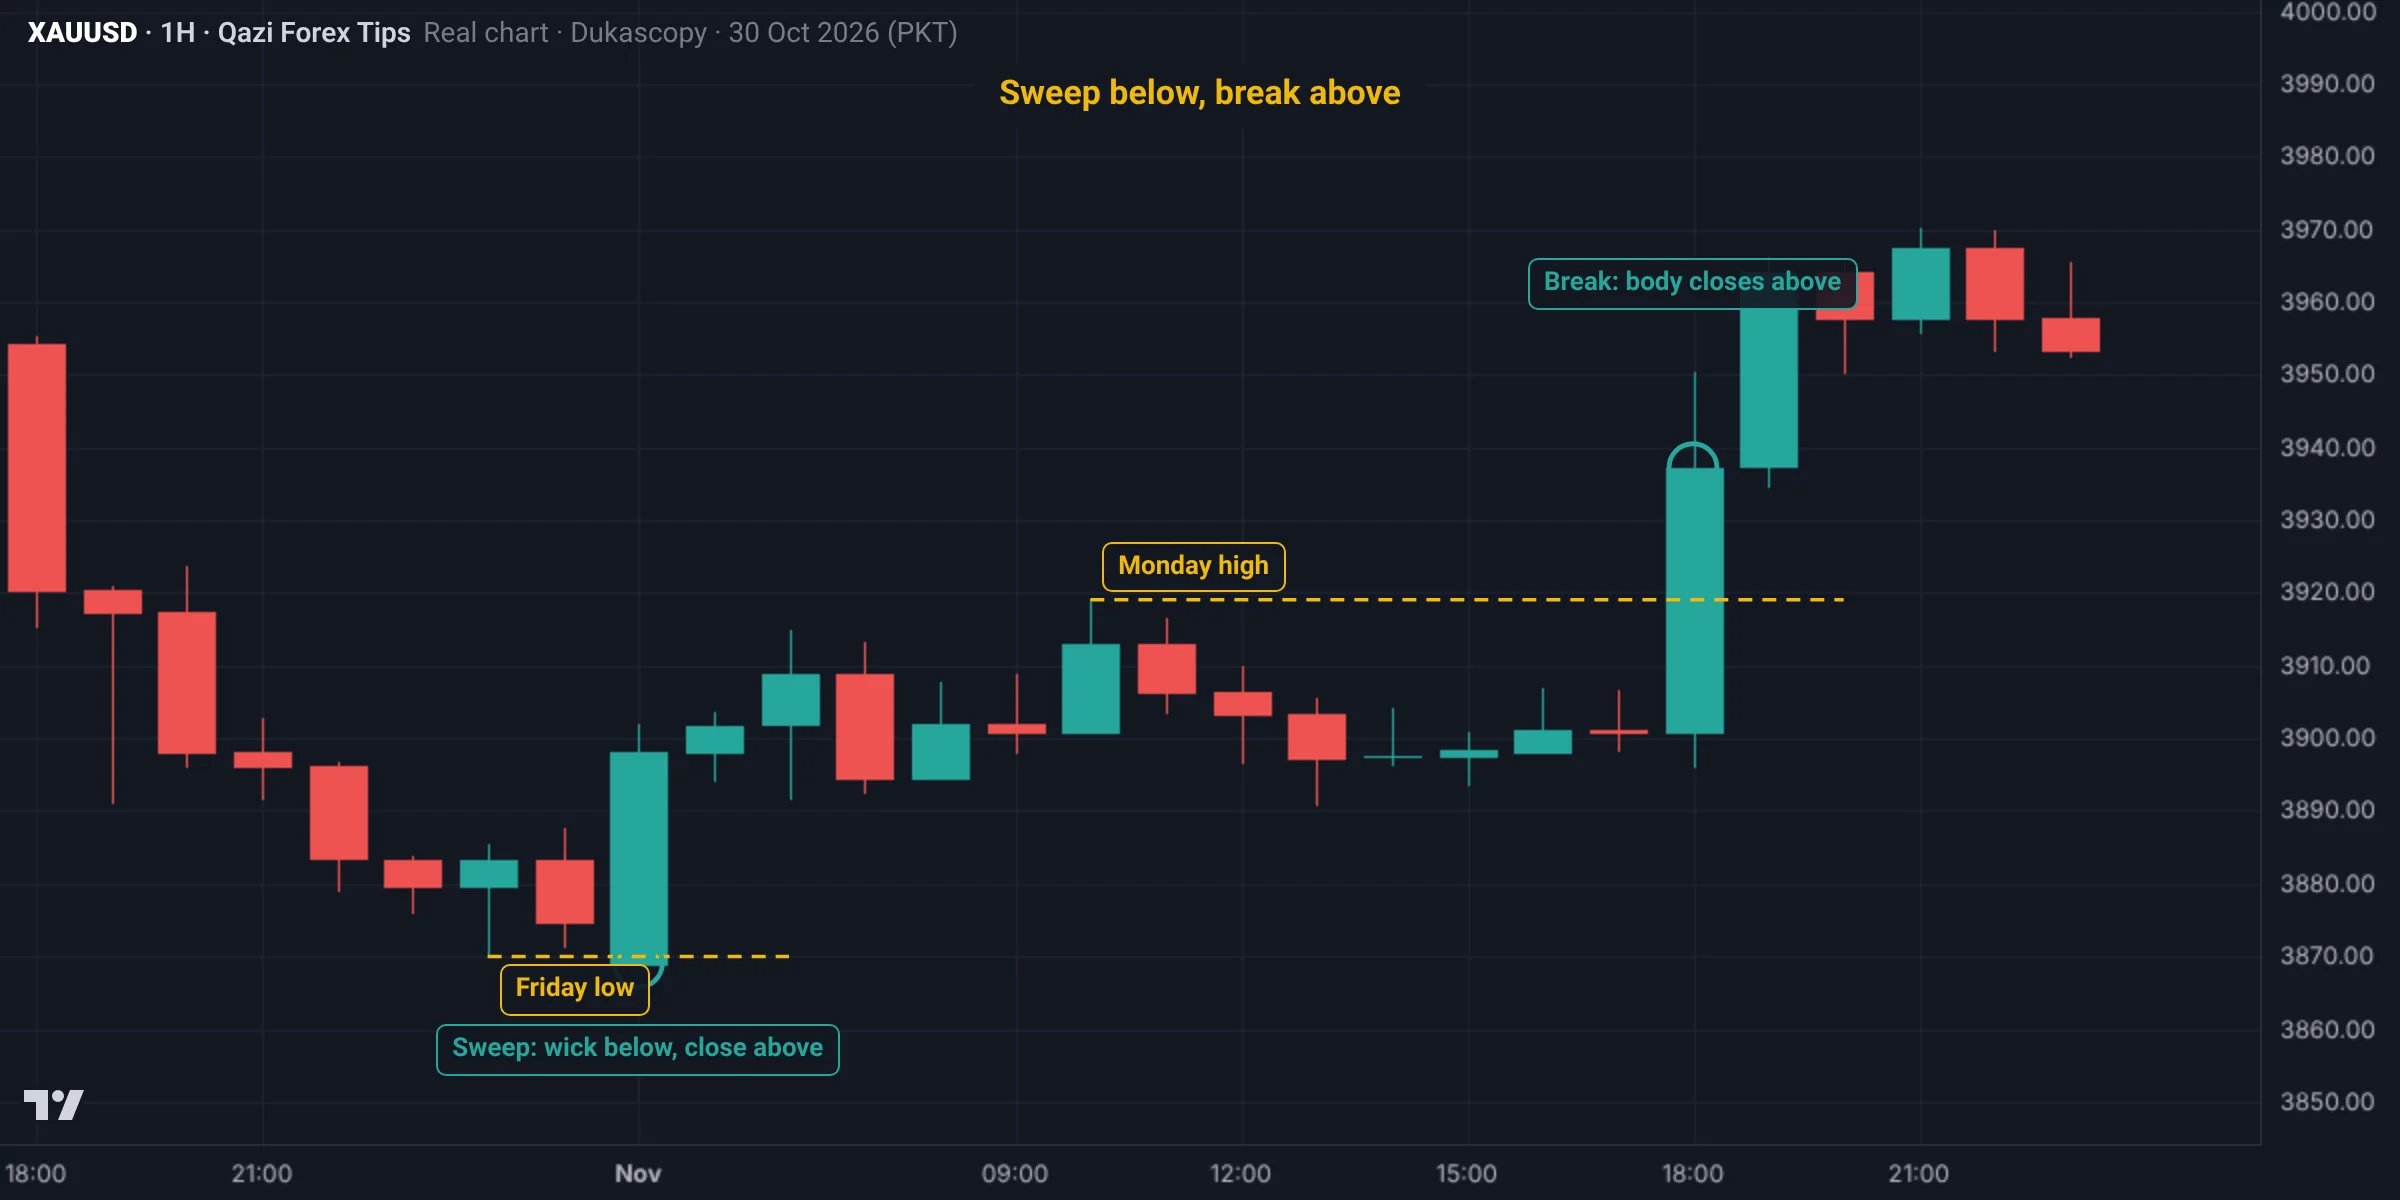
- Sweep (Monday 2 Nov, 04:00): right at the open the wick reached 3,869.1, below Friday's low at 3,870.0, but the candle closed back up at 3,898.1. Liquidity taken, price did not hold below.
- Break (18:00): the candle body closed at 3,937.2, above the 10:00 high at 3,919.0, and price held above; 3,970.1 by night.
Same rule: where the close happened, and whether price held beyond or came back.
Summary
- Sweep: wick beyond, body back inside, then the opposite direction. The large player fills its order against the liquidity there.
- Break: strong body closes beyond, level holds on the retest. The large player is on that side.
- Five questions: close, candle, next candles, retest, higher timeframe bias.
- Sweep trade: entry on the pullback after a lower timeframe CHoCH, stop behind the wick.
- Break trade: entry on the retest, stop behind the level.
- In doubt, around news or mid-range: no trade.
Spot it on the chart: practice
This is a real Gold chart (Dukascopy data, Pakistan time). Study it and pick an answer. After you answer, the fully marked chart and the explanation appear.
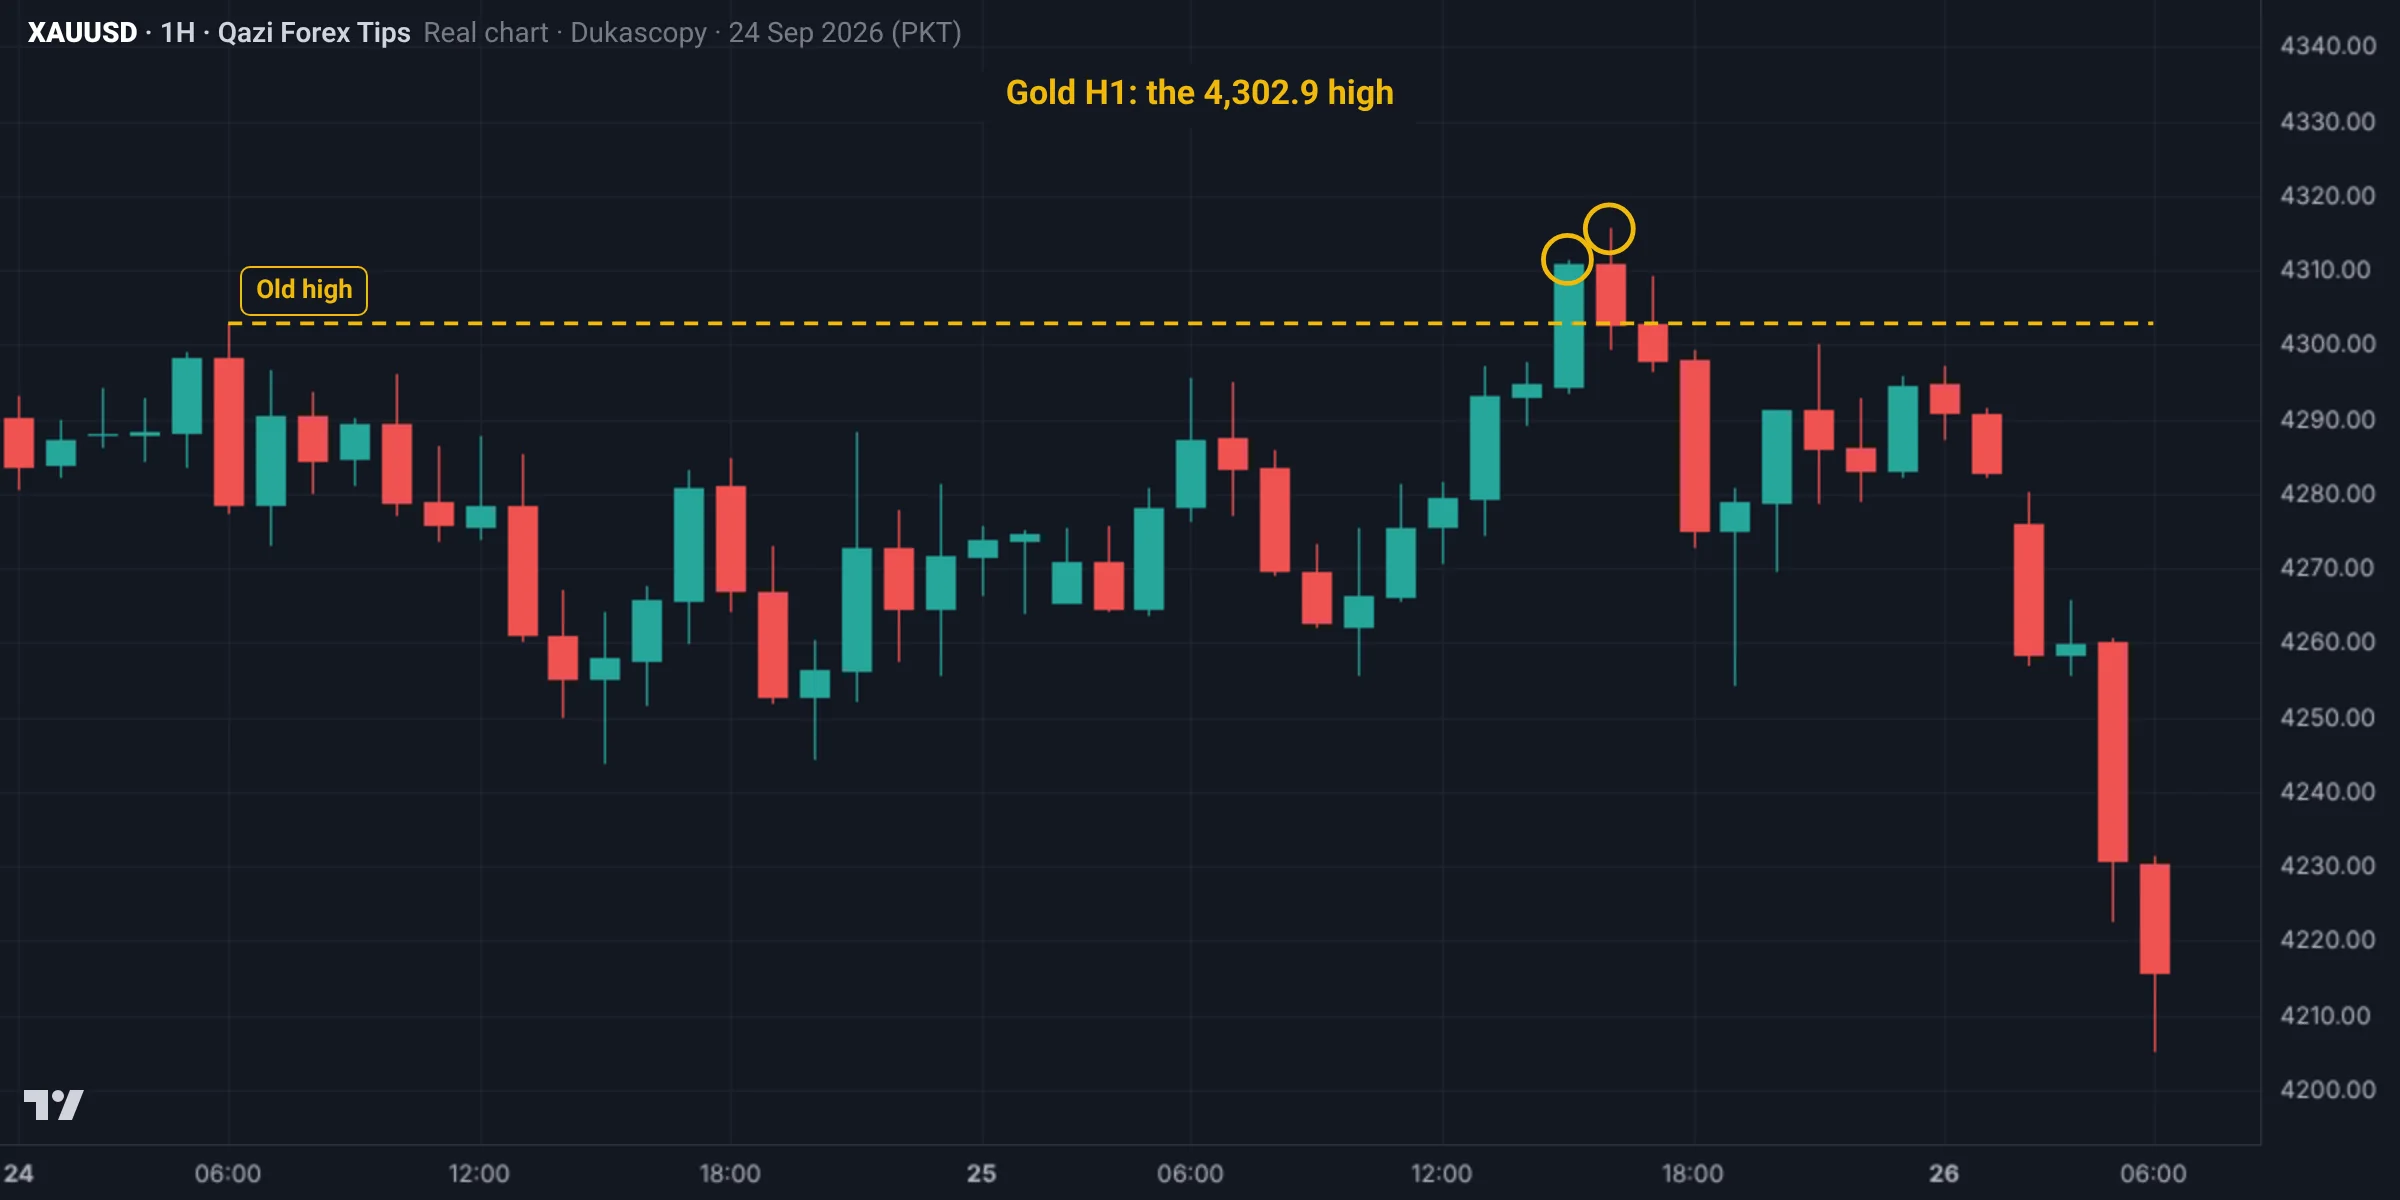
The 15:00 candle on 25 Sep closed above 4,302.9 at 4,310.7, but the 16:00 candle closed back below at 4,302.8. What was it?
One close above is not a confirmed break. The next candle took the whole move back, so it was a two-candle sweep. Traders who bought the 15:00 'breakout' were trapped: the next session price fell to 4,205.3.
The marked chart
Test yourself: Lesson 2.4 quiz
12 questions. Pick one answer for each and you will see at once whether it is right and why. Your score and grade appear at the end. You need 70% to pass.
0 correct · 0 / 12
Question 1How do you spot a sweep on the chart?
A sweep is also called a liquidity grab or stop hunt.
Question 2Why is the move after a sweep often fast?
The buy orders above were used up and the big sell is in, so price drops back quickly.
Question 3What is the real confirmation of a break?
If price closes back inside on the retest, the "break" was really a sweep.
Question 4What is the first and most important question to tell a sweep from a break?
Price beyond the level can look convincing on a forming candle, but the close decides.
Question 5What does a break candle usually look like?
A sweep candle's long wick shows price went there and was rejected.
Question 6A candle closes above the level, but the next candle takes back the whole move and closes below. What is it?
Watch the next one or two candles even after a close; a big opposite engulfing candle means a sweep.
Question 7Which candle decides a sweep or break of an H1 level?
A single H1 wick can look like a full break on M5; don't mix timeframes.
Question 8Where is the stop in a sweep trade?
If price closes below that wick again, the sweep idea was wrong.
Question 9When is the entry in a break trade?
No entry on the break candle; let price come back to the level.
Question 10Gold example: 6.5-dollar stop, 1,000-dollar account, 1% risk. What lot?
10 ÷ (6.5 × 100) ≈ 0.015; round down to keep risk within 1%.
Question 11When should you not trade at all?
When in doubt, no trade.
Question 12What do most "breakouts" turn out to be at first?
That is why break entries come on the retest and sweep entries after a lower timeframe CHoCH.
Lesson checklist
Tick each point once you understand it. Your ticks are saved in this browser.
Assignment
- On Gold H1, find 20 places where price went beyond an obvious high or low.
- Label each as sweep or break, with your answers to the five questions.
- On 3 of the sweeps, open M5, find the CHoCH and mark entry, stop and target with the RR.
- On 3 of the breaks, mark the retest entry, stop and target.
- Count how often your first guess was wrong, and why.
- Post a screenshot of your hardest case in the group.
Post your assignment screenshots with your reasons in our free Facebook group, where your charts will be checked.
Join the free group
Who wrote this lesson
Dr. Qazi Abdul Basit, Ph.D
Ph.D in Business Administration and a forex and Gold trader since 2013. Founder of Qazi Forex Tips, which teaches traders in Pakistan and India price action, risk management and trading psychology in their own language: 65 student batches so far, free courses on YouTube, and MT5 tools for traders (QFT Replay Simulator, QFT Trade Assistant).
- 2013 trading since
- 75K+ Facebook group members
- 65 student batches
- 15K+ YouTube subscribers
How this lesson was made: the content follows Dr. Qazi's teaching method and years of trading. Real charts are built from Dukascopy Gold (XAUUSD) data, and backtest results are shown as they came out, even when negative. We do not sell signals, manage accounts or take money from any broker. Last updated: 19 November 2026.
Questions
What is a liquidity sweep?
Price trades beyond a high or low, takes the stops there, then closes back inside and fails to hold.
How do you tell a sweep from a break?
A break closes beyond the level with a strong body and holds on the retest; a sweep closes back inside.
Is a stop hunt the same as a sweep?
Yes. Stop hunt, liquidity grab and sweep describe the same behaviour.
Does every sweep lead to a reversal?
No. Do not trade against a sweep without a lower timeframe CHoCH.
Where does the stop go on a sweep trade?
Beyond the sweep wick, with a little room; a close beyond it invalidates the idea.
When should I enter a breakout?
Not on the break candle but on the retest, when the level holds.
What is a liquidity grab?
The same thing as a sweep or stop hunt: price trades beyond a high or low, takes the stops and closes back inside.
How do I spot a fake breakout?
Watch the close: the wick went beyond the level but the body closed back inside, and the next candles did not hold beyond it. That is a sweep, a fake breakout.
Read more
Education only, not financial advice. Trading forex, Gold and CFDs carries a high risk of loss. SMC concepts describe tendencies, not guarantees. Lesson 15 of 38.