 Qazi Forex Tips

What is a swing?
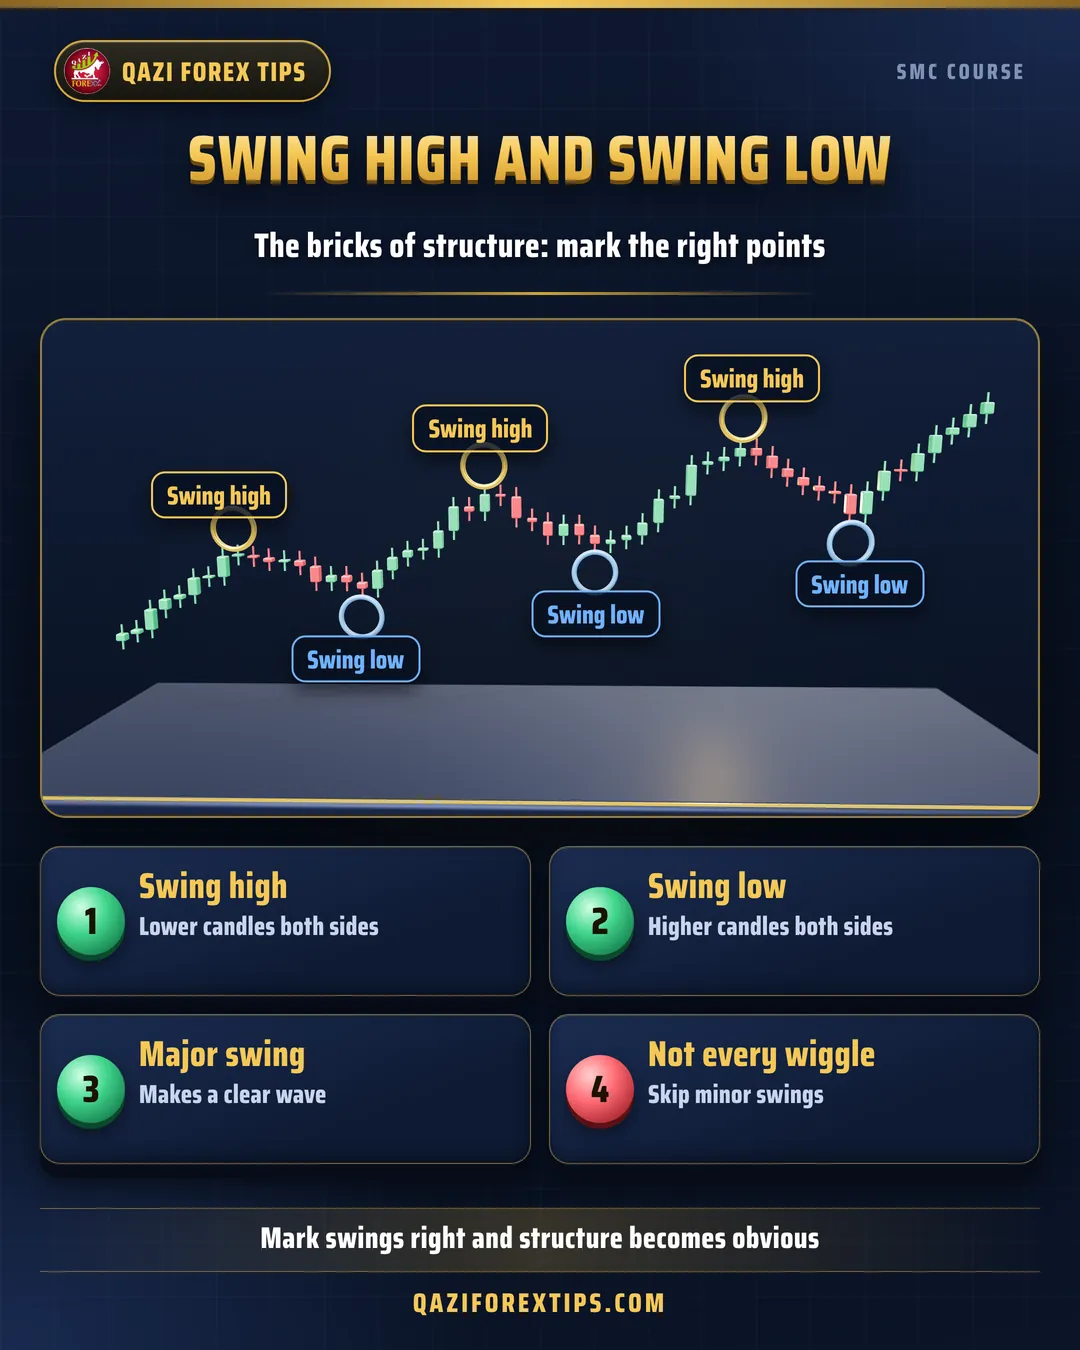
The market does not move in a straight line; it moves in waves. The peak of each wave is a swing high and each trough is a swing low.
- Swing high: a candle whose high is higher than the candles on both its left and right.
- Swing low: a candle whose low is lower than the candles on both sides.
The two-candle rule
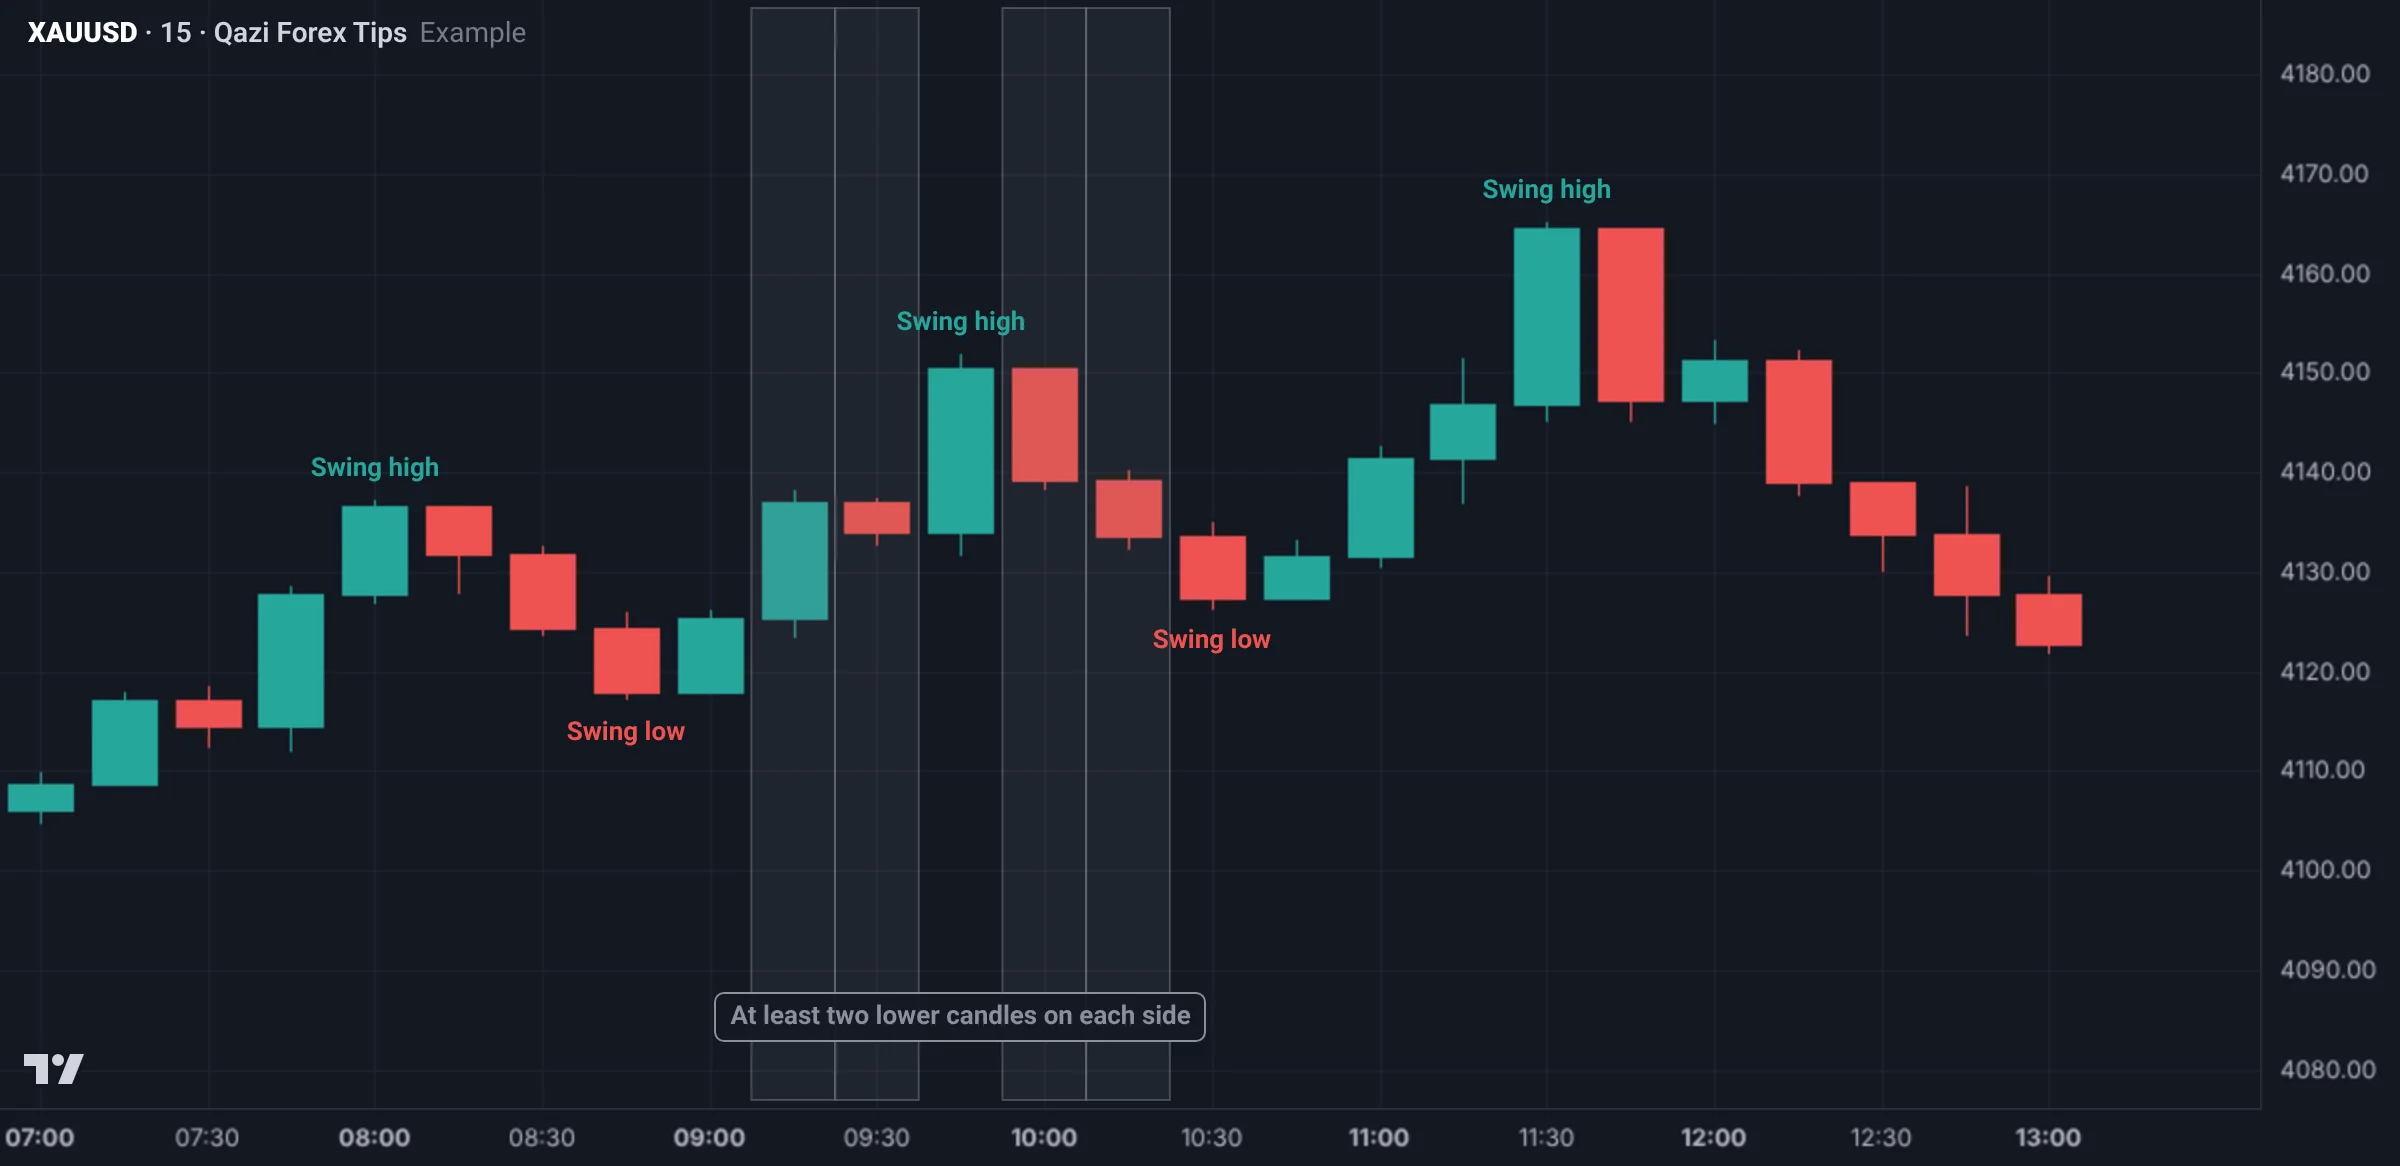
Start with one simple rule: a swing high needs at least two candles on each side with lower highs. For a swing low, the opposite.
Major and minor swings
Not every small wave matters.
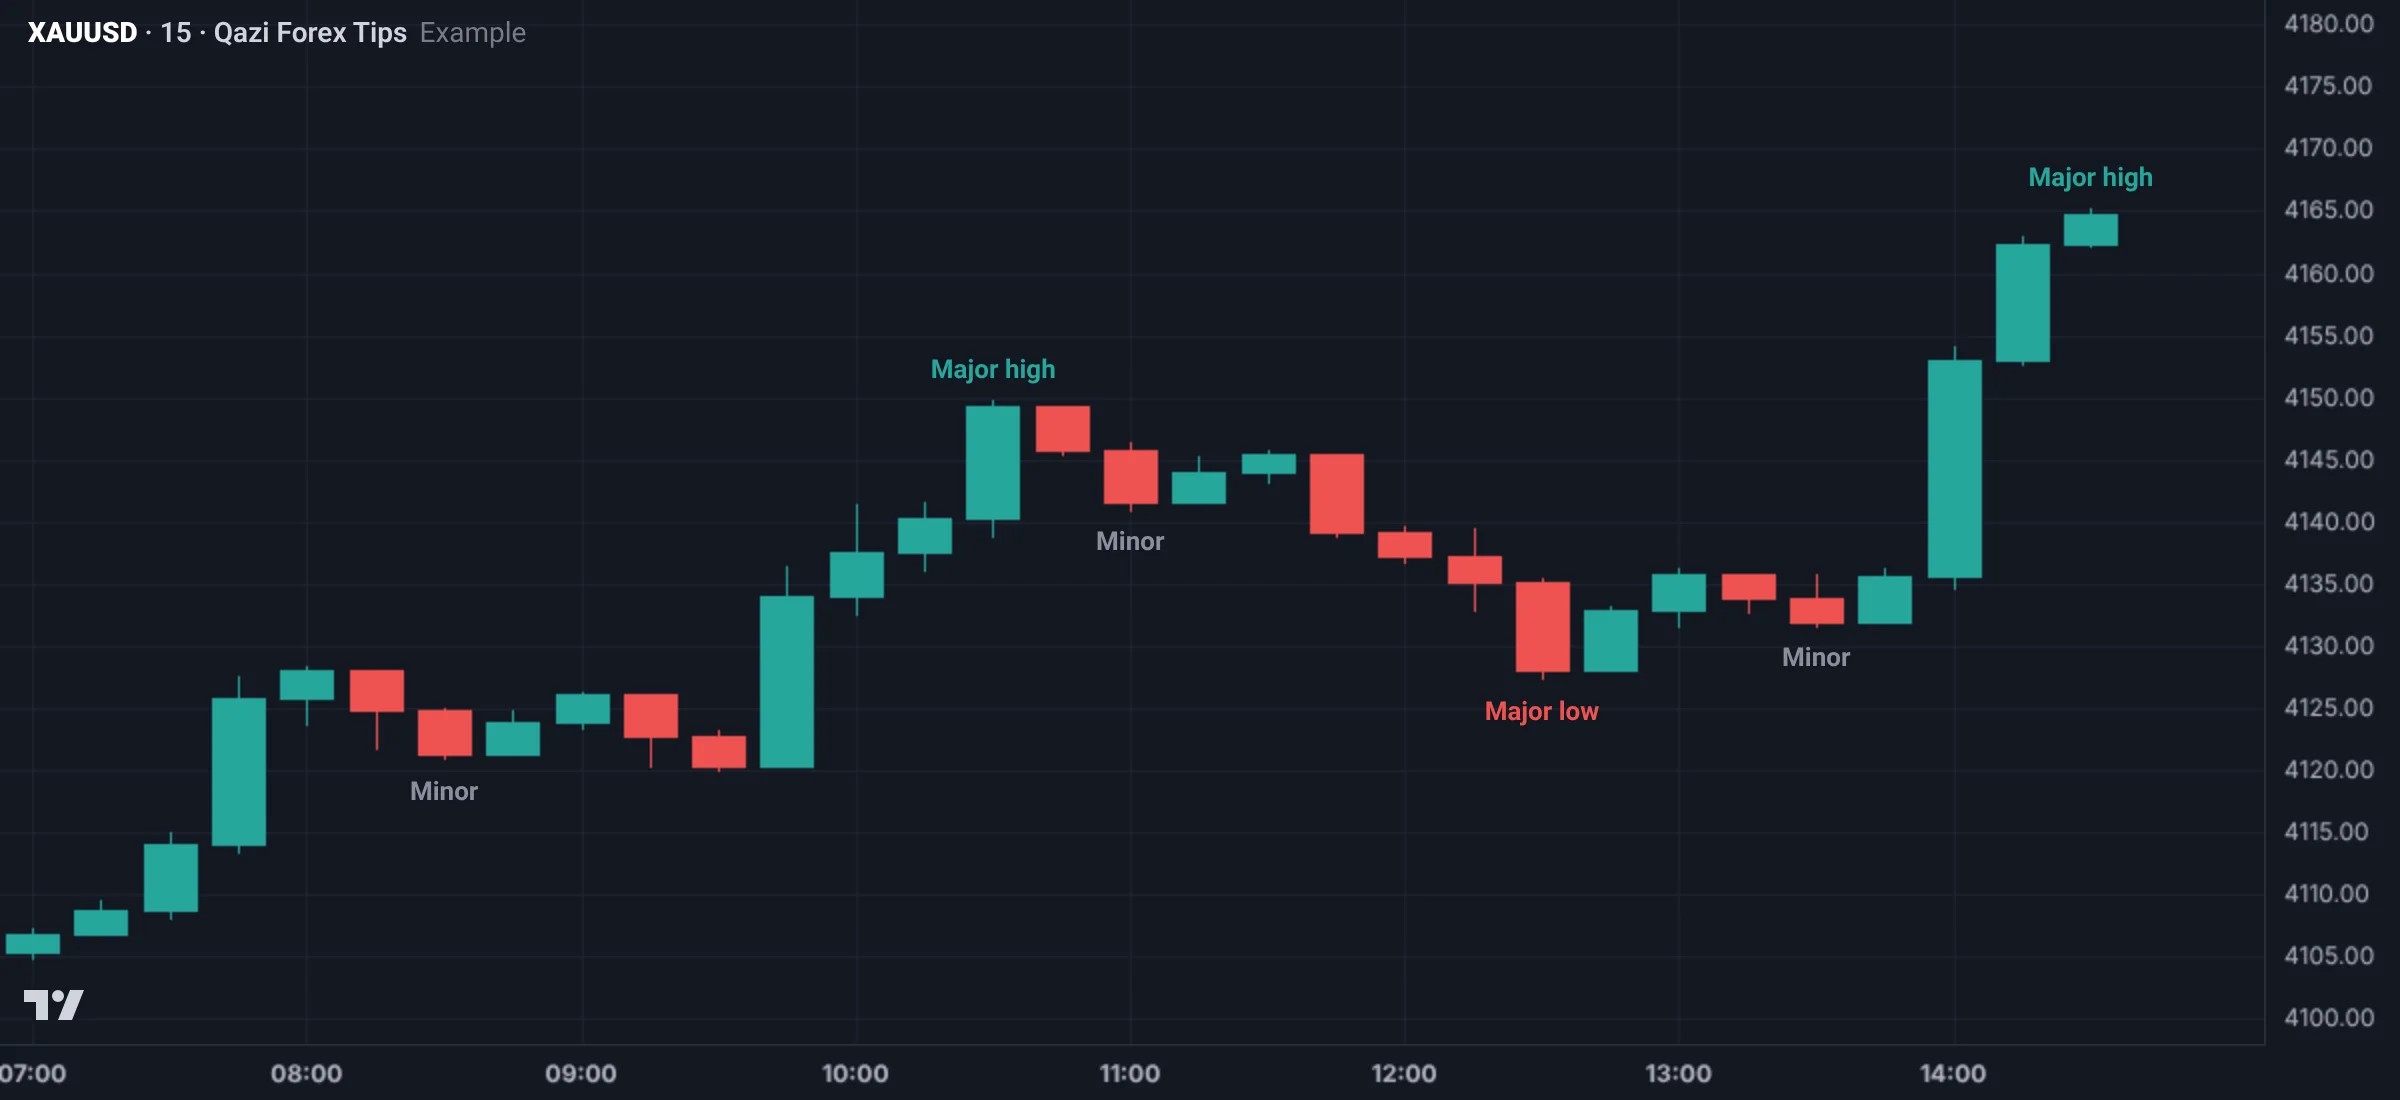
- Major swing: a high or low followed by a big move that changes the picture, for example a new higher high.
- Minor swing: the small ups and downs inside a larger wave.
| Question | Major swing | Minor swing |
|---|---|---|
| How big is the move after it? | Big, a new high or low | Small |
| Effect on bias | Yes | No |
| Used for | Bias, BOS, CHoCH | Entries, internal structure |
How to mark swings
- Zoom out a little so 100 to 150 candles are visible.
- Mark the obvious big peaks and troughs first and ignore small details.
- Check the two-candle rule on each swing.
- Mark a high at the tip of the wick and a low at the end of the wick, not on the body.
- Then see whether highs and lows are rising or falling. That is the basis of the next phase (structure).
Swings change with the timeframe
A minor swing on H4 can be a major swing on M15. Always say which timeframe your swings belong to. At the start, practise only on H1.
Marking swings on 50 candles: step by step
- Keep about 50 to 80 candles on the chart. With too many, the eye gets lost in small details.
- Start from the left and first find the clearest highs and lows, where price made a clean wave and turned.
- Check each candidate high with the two-candle rule: at least two candles on each side have lower highs.
- For lows, the same: at least two candles on each side have higher lows.
- Swing highs and swing lows alternate. If two swing highs come without a low in between, keep only the higher one.
- Finally step back and look: do these marks show the real waves of the chart? If there are too many, remove the small ones.
Wick or body?
In this course swing highs and lows are marked at the tip of the wick, because that is where price really reached and where stops and liquidity sit. But whether a swing is broken is decided by a body close (the BOS lesson). So:
- The level: from the wick.
- The break decision: from the body close.
Swings in a range
There isn't always a trend. Sometimes price keeps moving between the same high and low. Then swing highs form at about one level and swing lows at about one level.
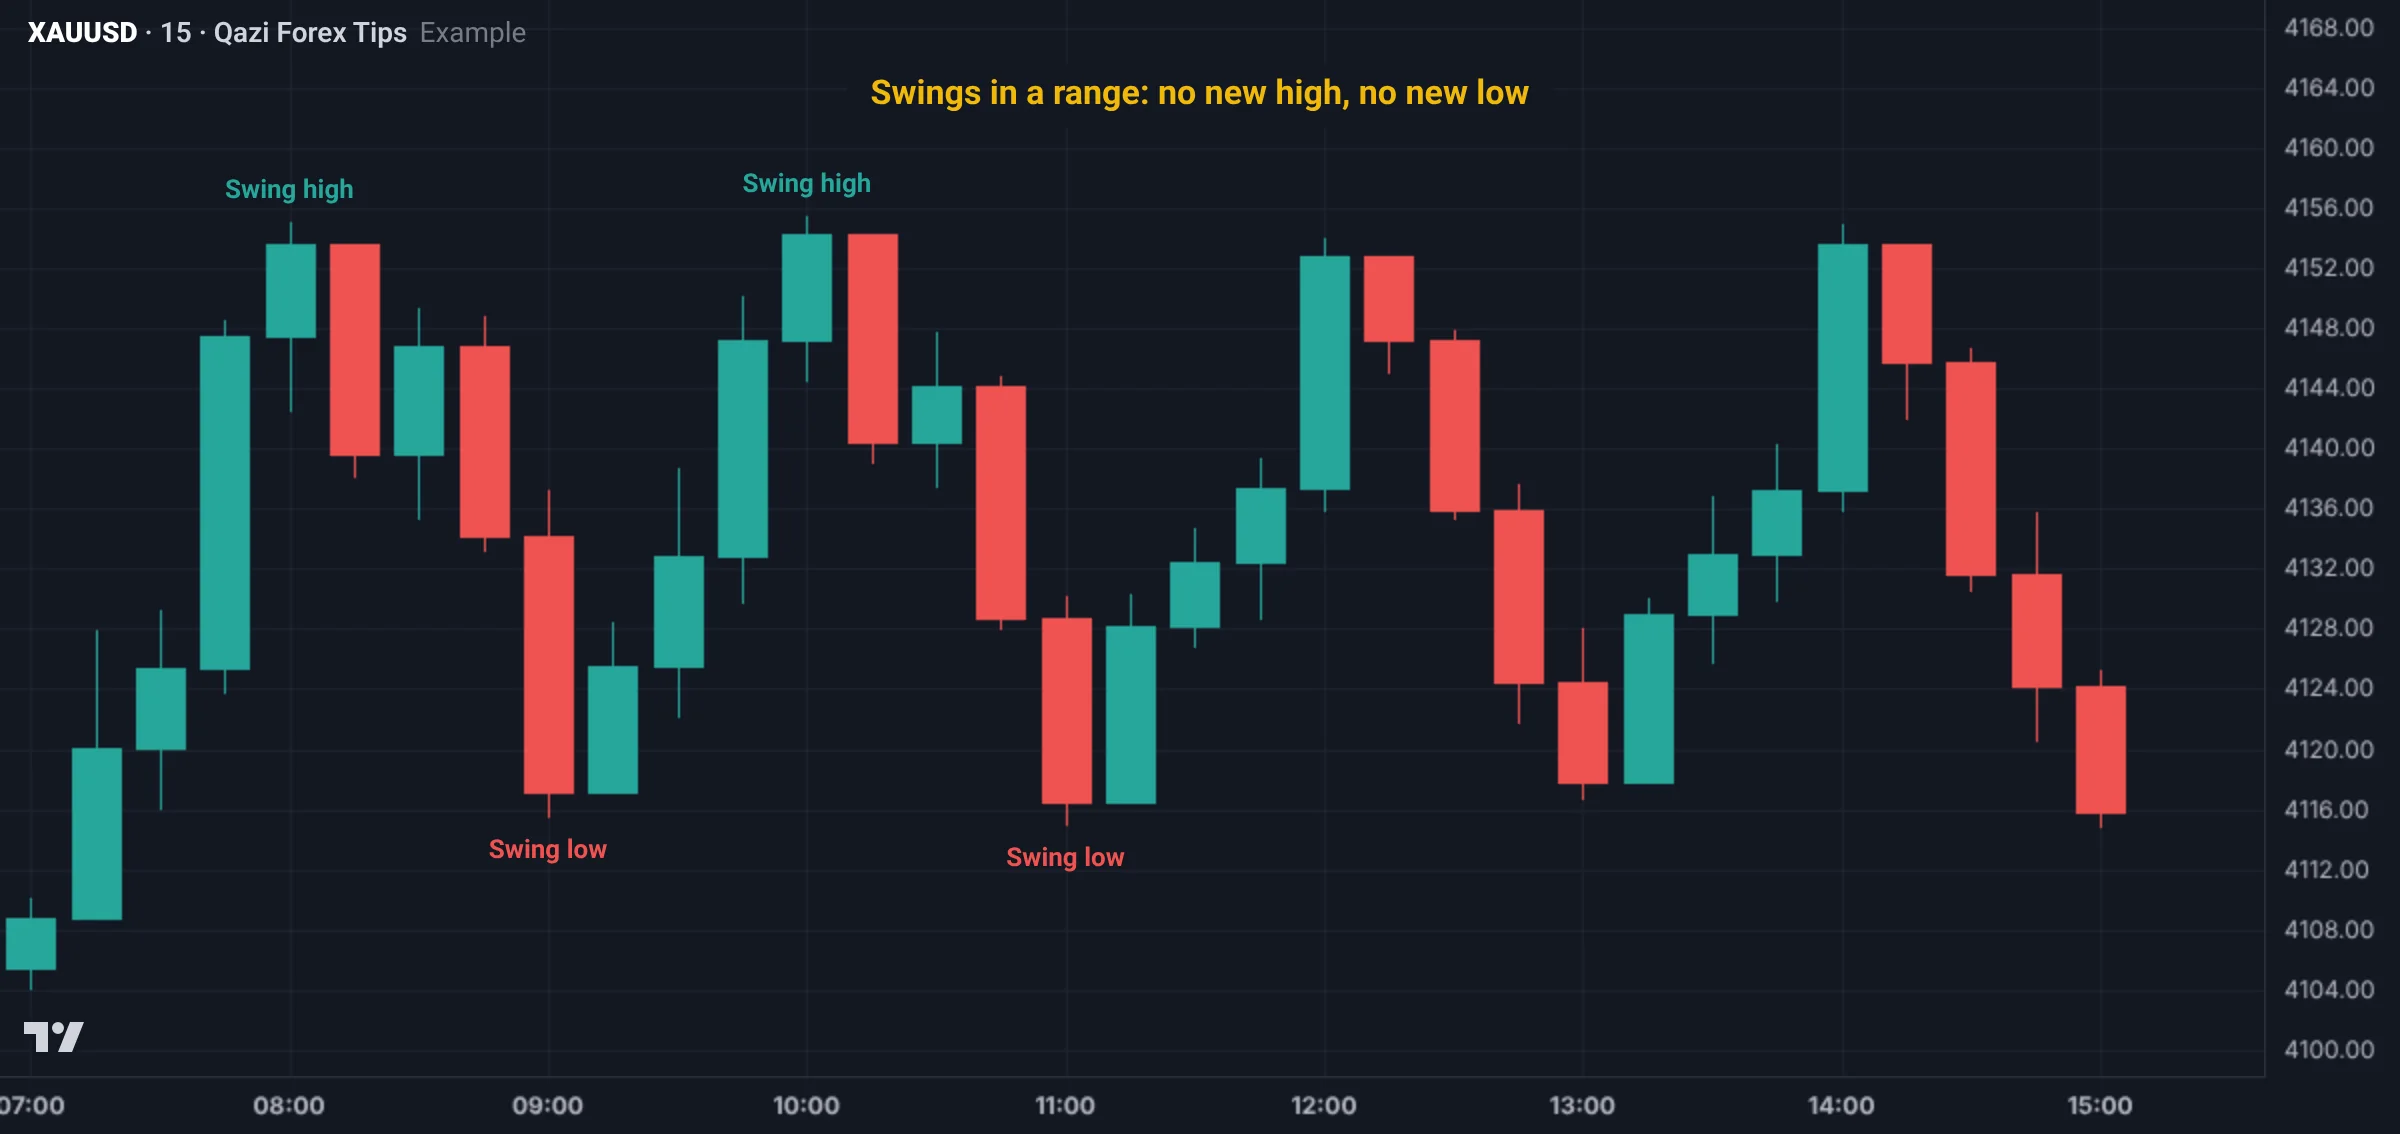
These equal highs and lows of a range become the most important part of liquidity in Phase 2. For now, just remember: don't trade in the middle of a range.
A Gold example
Suppose Gold on H1 rises from 4,112 in the morning, stalls at 4,131.50, pulls back to 4,121.80, then rises to 4,140.20.
- 4,131.50 is a swing high: the two candles on each side have lower highs.
- 4,121.80 is a swing low.
- 4,140.20 becomes a new swing high once the next two candles make lower highs. Until then it is only a "possible" swing high.
- 4,140.20 is above 4,131.50, and 4,121.80 is above the earlier low of 4,112: HH and HL, an uptrend. Phase 1 covers this fully.
Real Gold chart examples
Gold M15 on 9 Nov 2026 (data: Dukascopy, bid price; Pakistan time). Every candle marked here has lower highs (or higher lows) on the 3 candles either side:
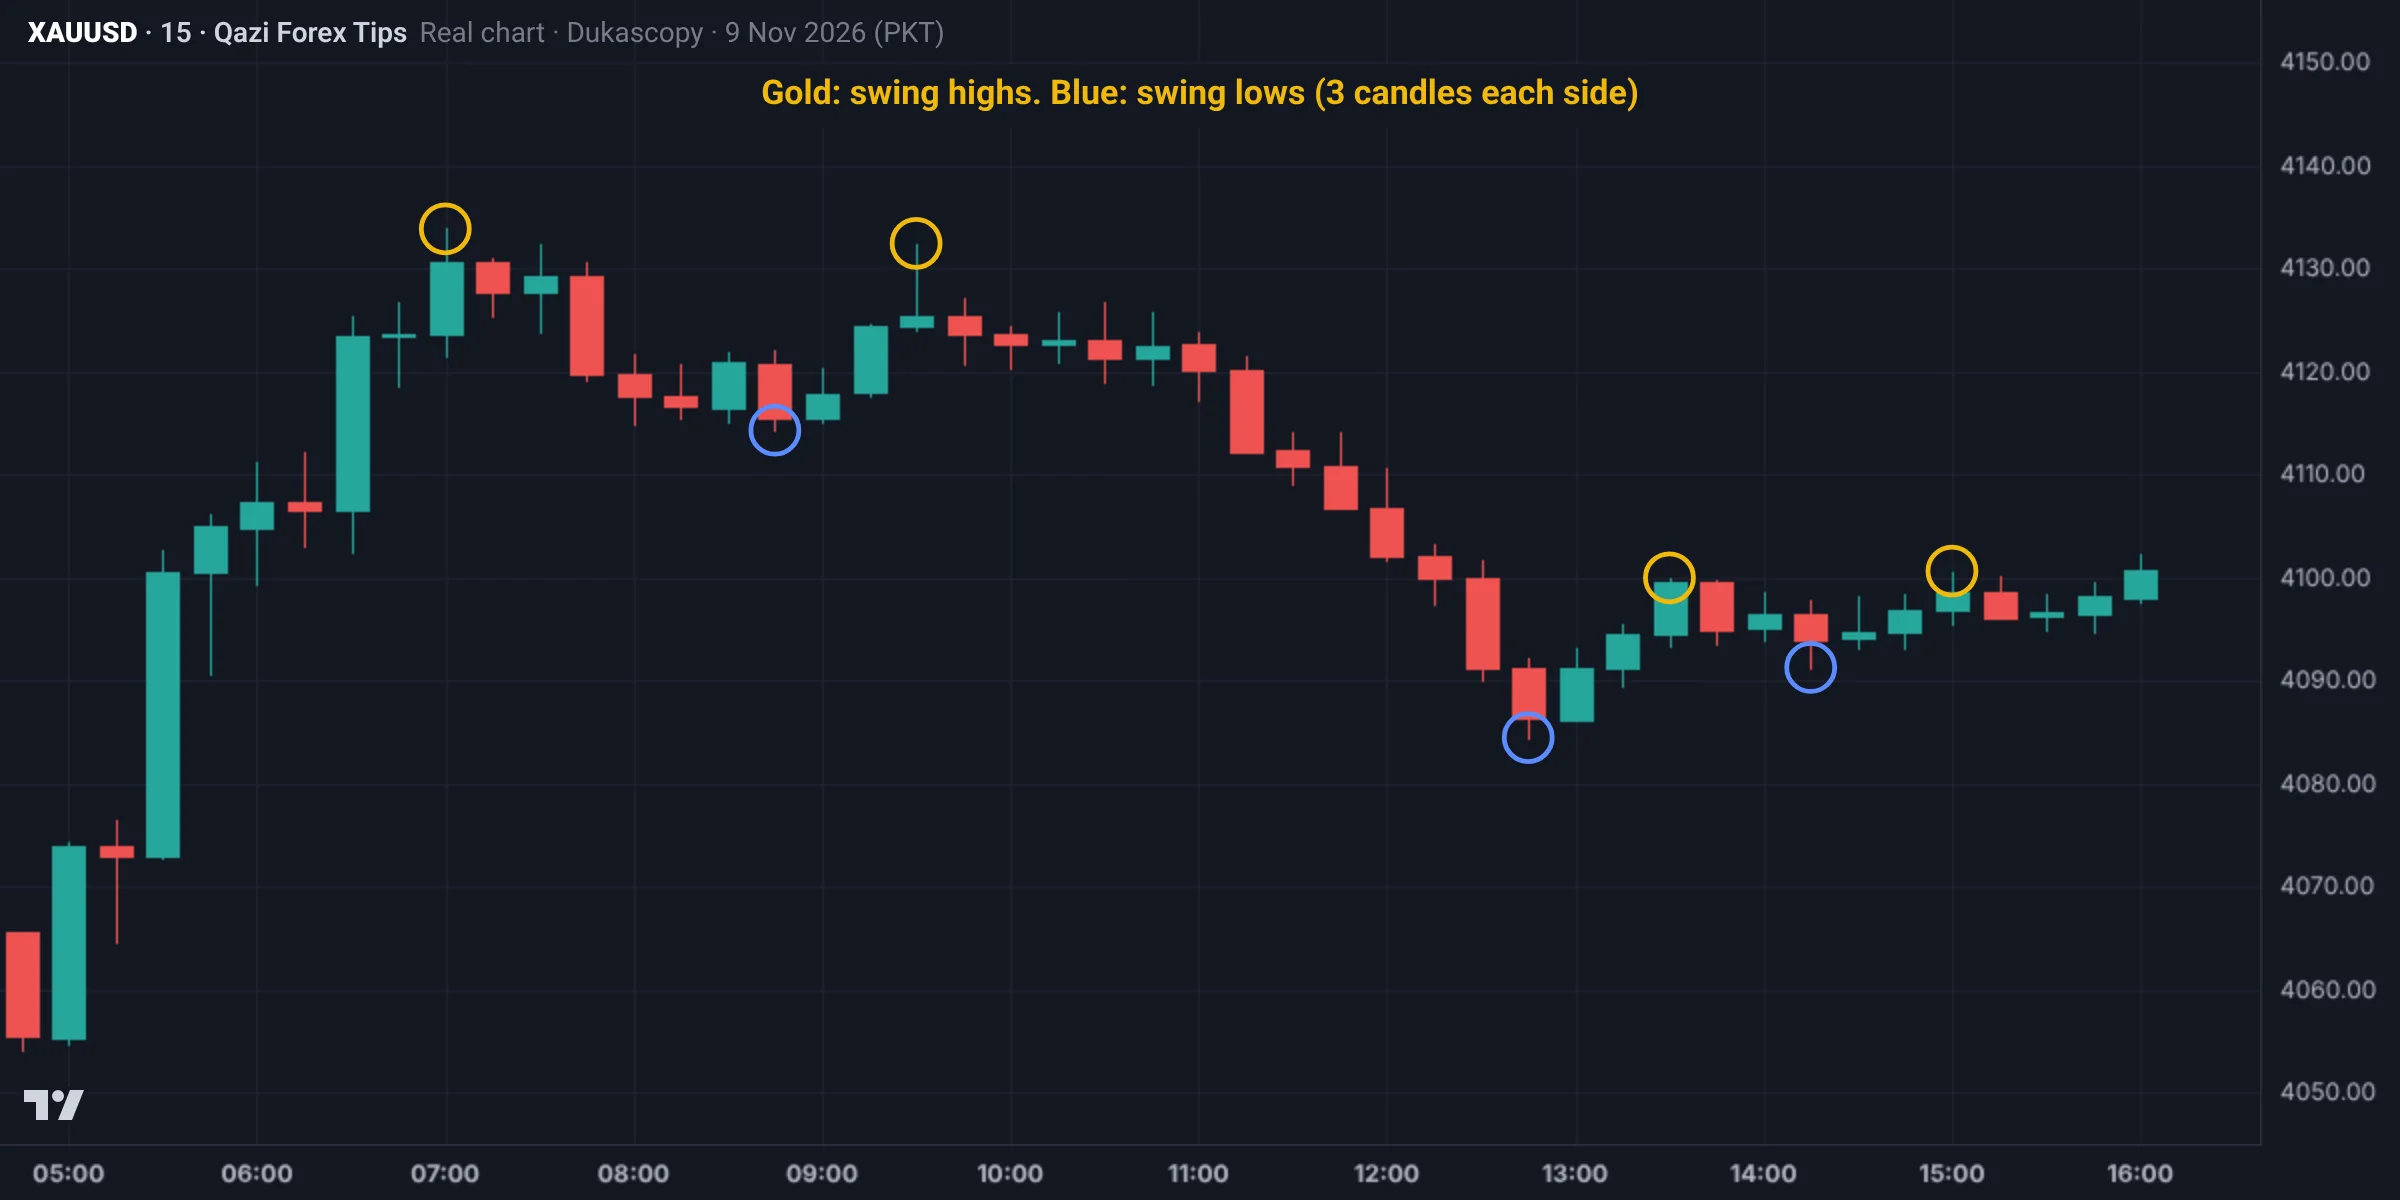
- Swing highs: 4,133.9, 4,132.5, 4,100.0, 4,100.6.
- Swing lows: 4,114.3, 4,084.5, 4,091.3.
Not every wiggle is a swing; only points where price clearly turned. The day's most important swing high is 4,133.9 and swing low 4,084.5.
Second example: swings in a falling market (30 Oct)
Gold M15 on 30 Oct 2026 (data: Dukascopy, bid price; Pakistan time), a falling day. Same rule: 3 candles on each side:
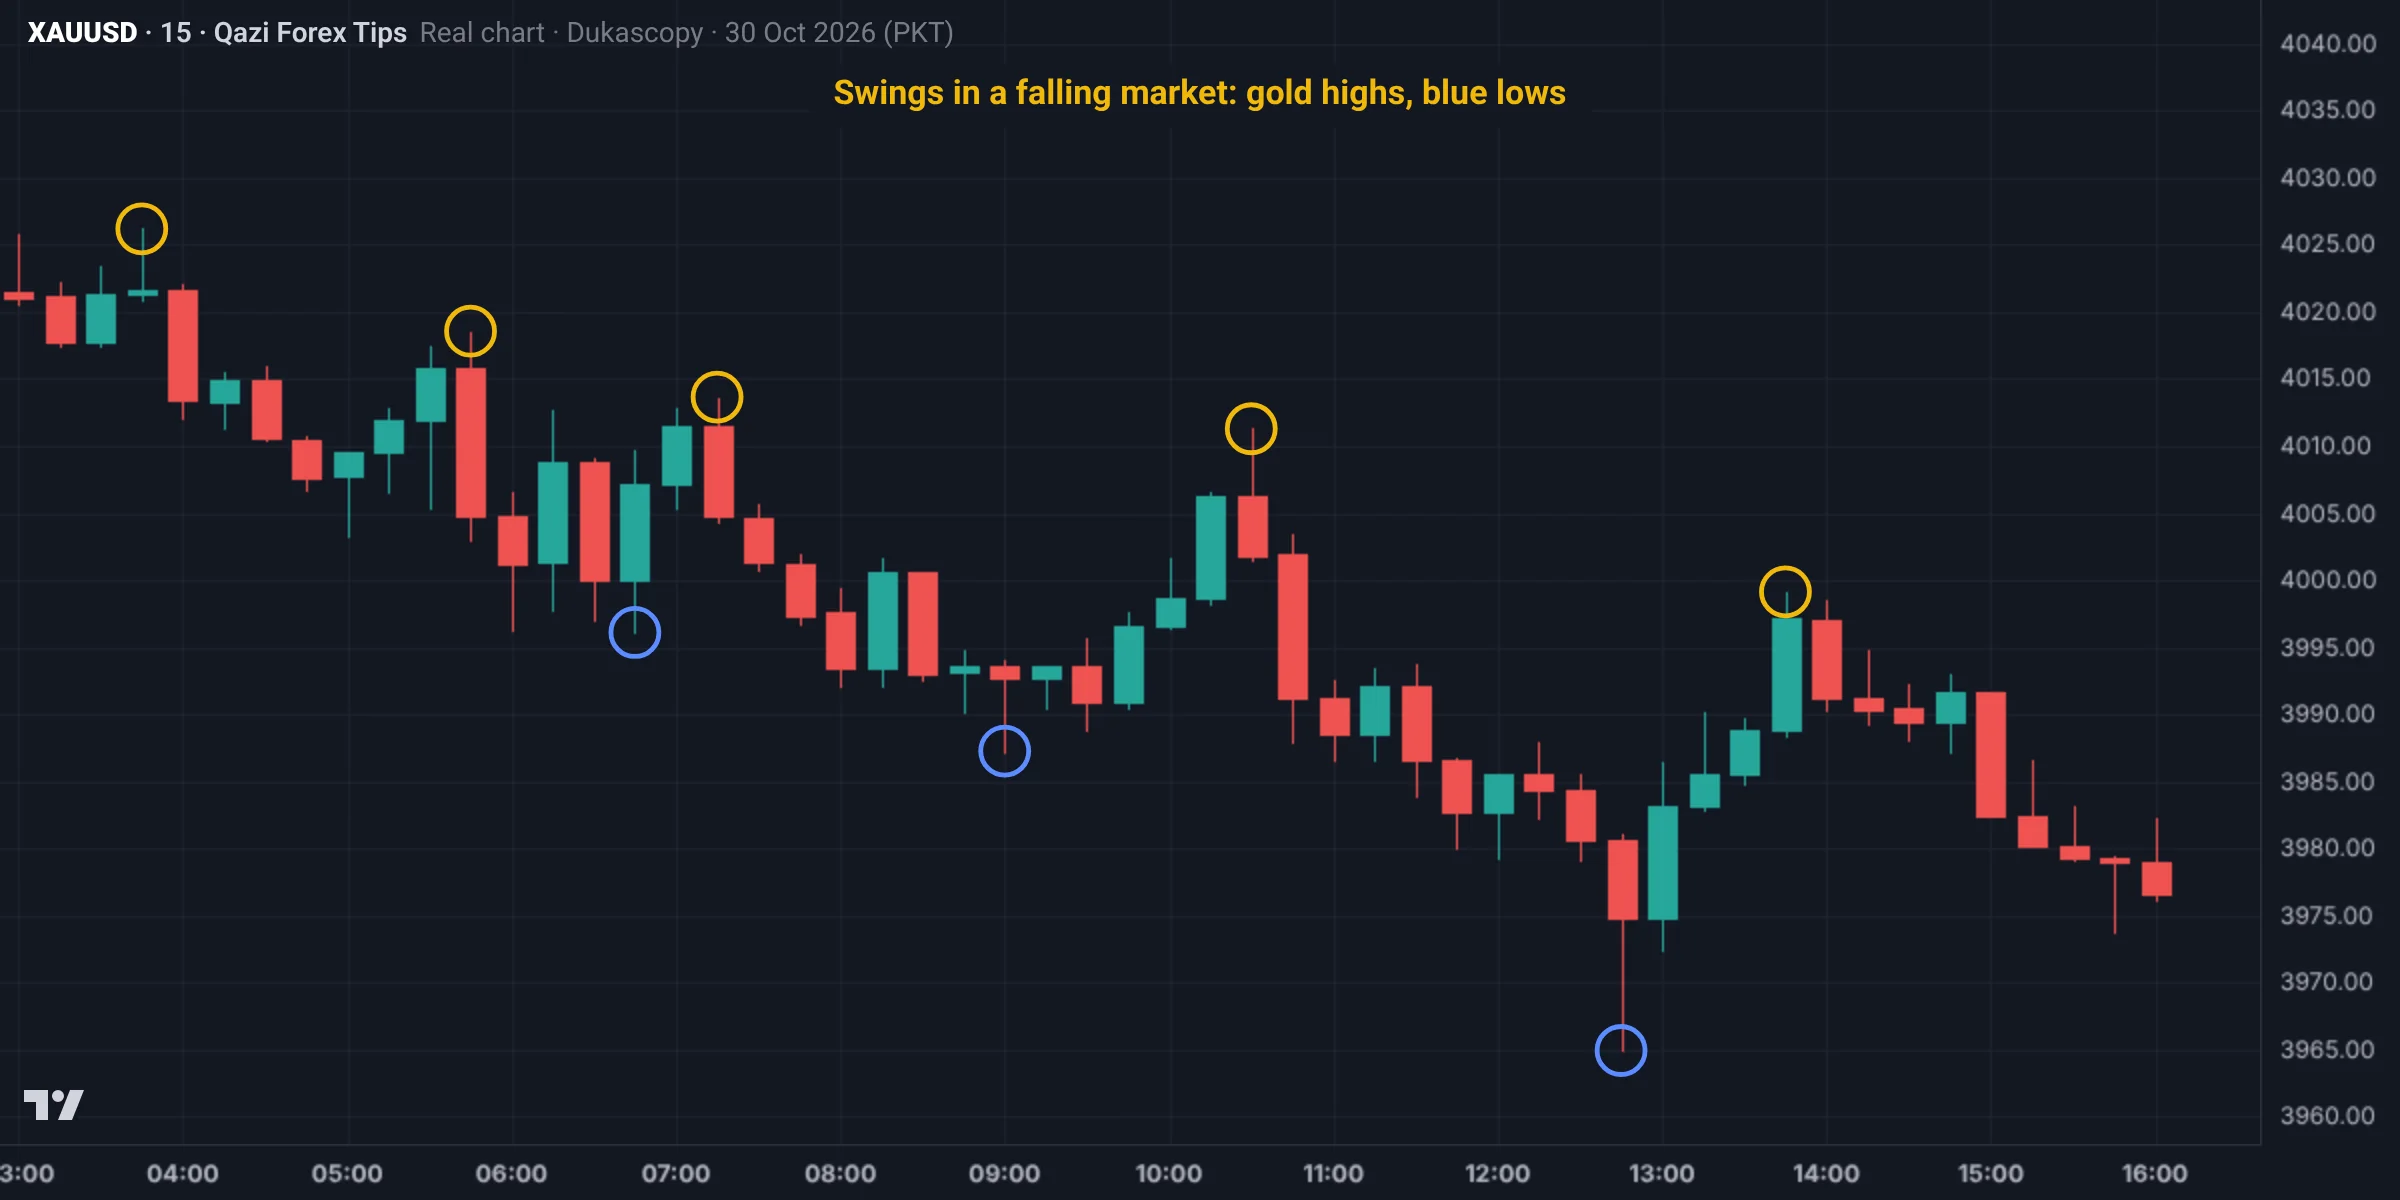
- Swing highs: 4,026.2, 4,018.6, 4,013.6, 4,011.3, 3,999.1.
- Swing lows: 3,996.1, 3,987.3, 3,964.9.
Every swing high is below the previous one, and so is every swing low: the first swing high is 4,026.2 and the last 3,999.1; the first swing low 3,996.1 and the last 3,964.9. In the next lesson this sequence is called LH and LL.
Common mistakes
Summary
- Swing high: at least two lower candles on each side. Swing low: at least two higher candles on each side.
- The level comes from the wick; the break decision from the body close.
- Major swings tell the chart's story; leave the minor ones.
- In a range swings form at equal levels, and these become liquidity later.
Spot it on the chart: practice
This is a real Gold chart (Dukascopy data, Pakistan time). Study it and pick an answer. After you answer, the fully marked chart and the explanation appear.
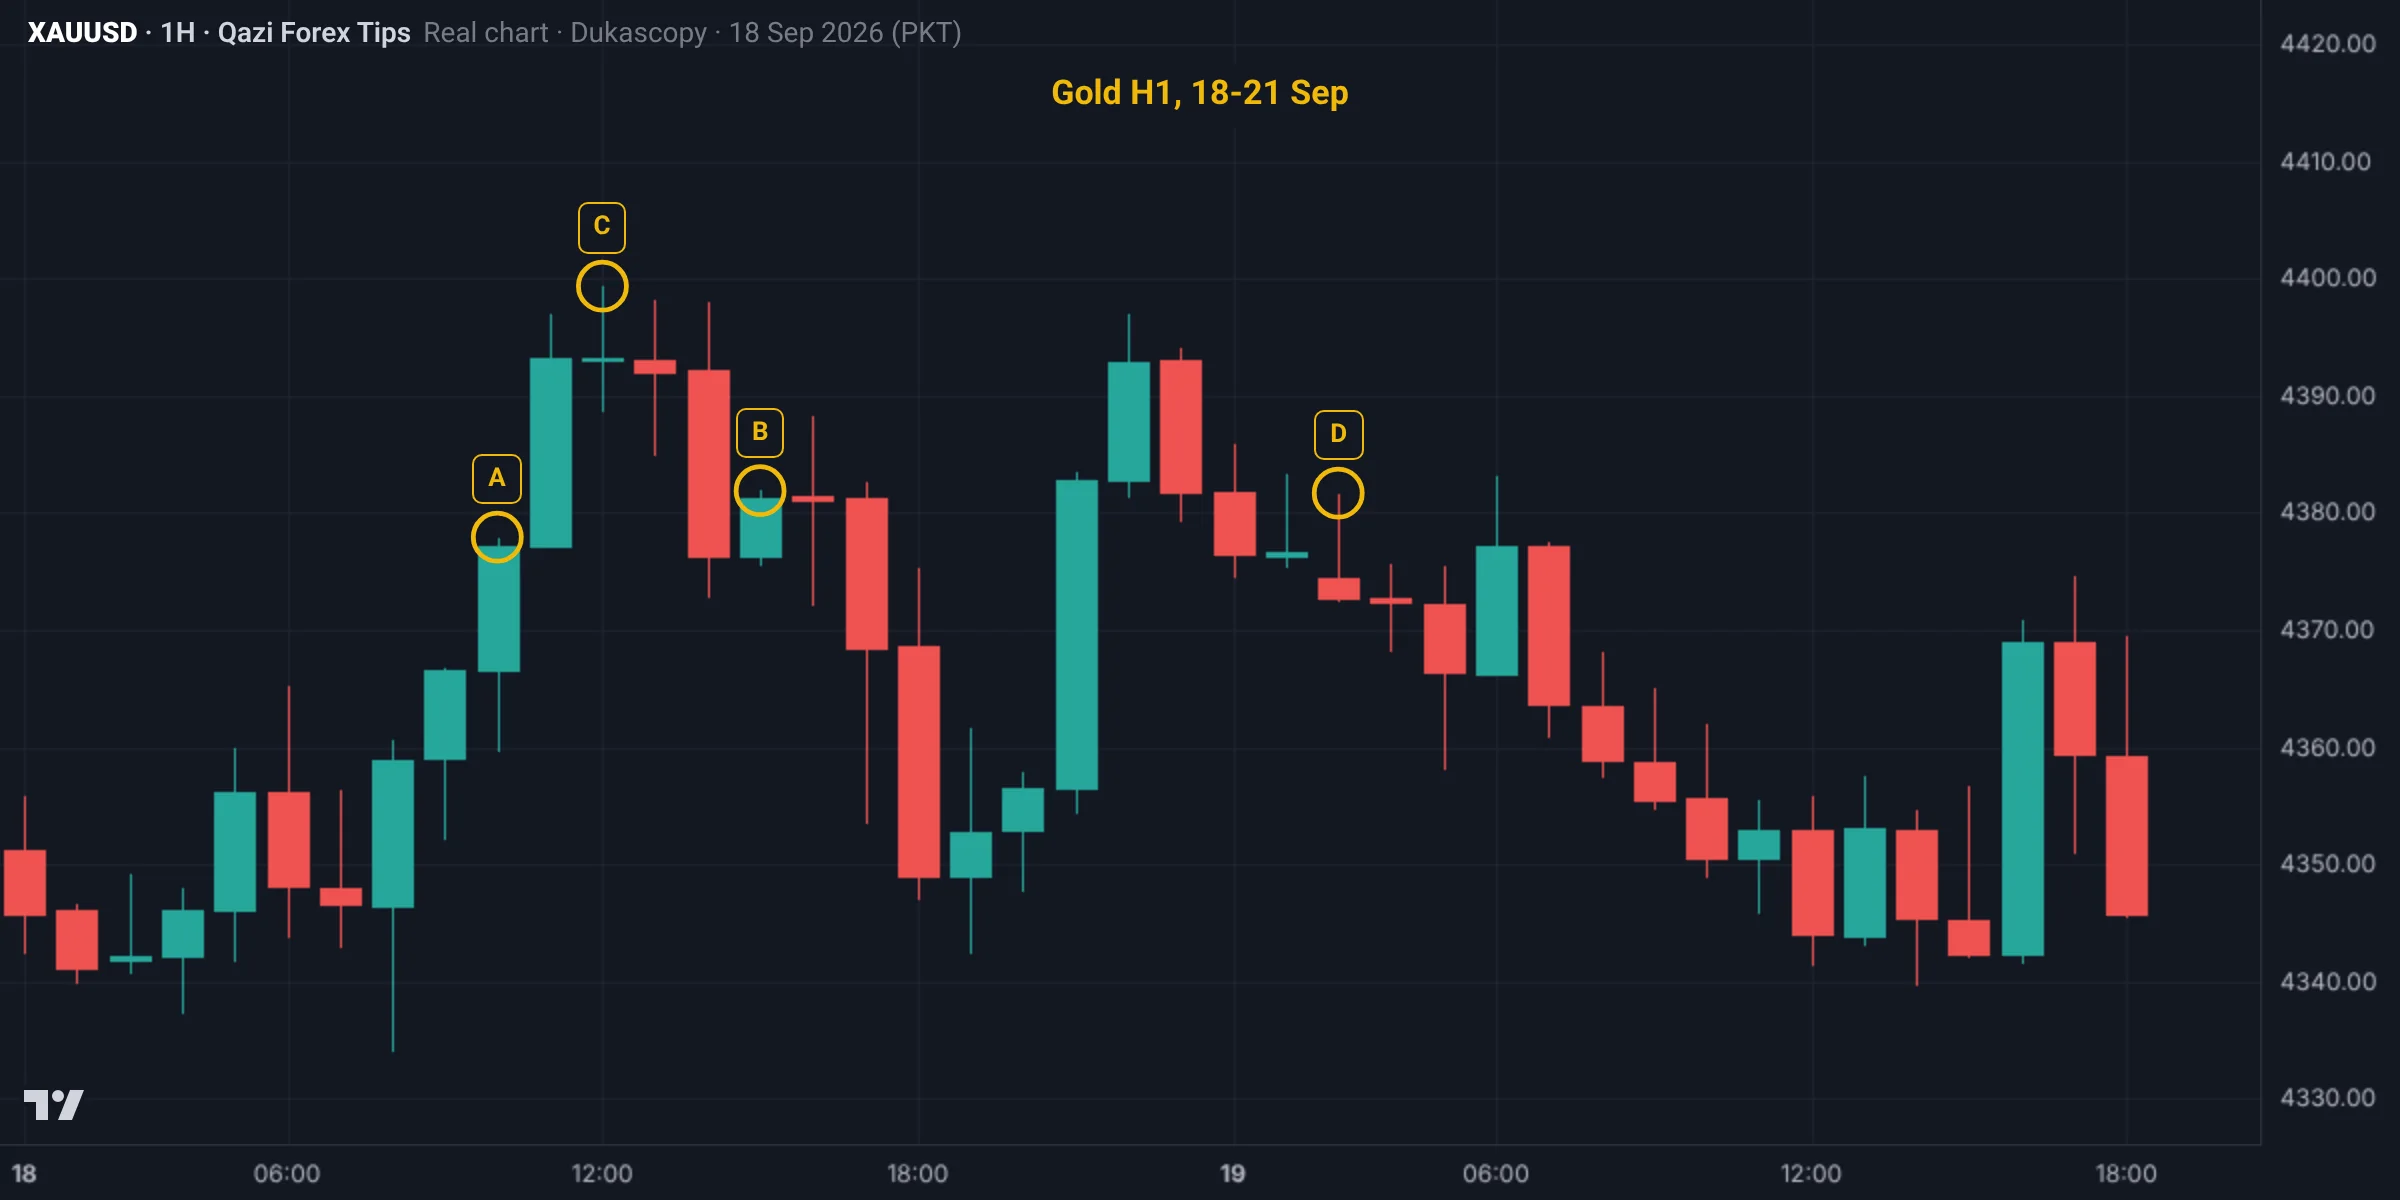
By the two-candle rule, which of these points is a valid swing high?
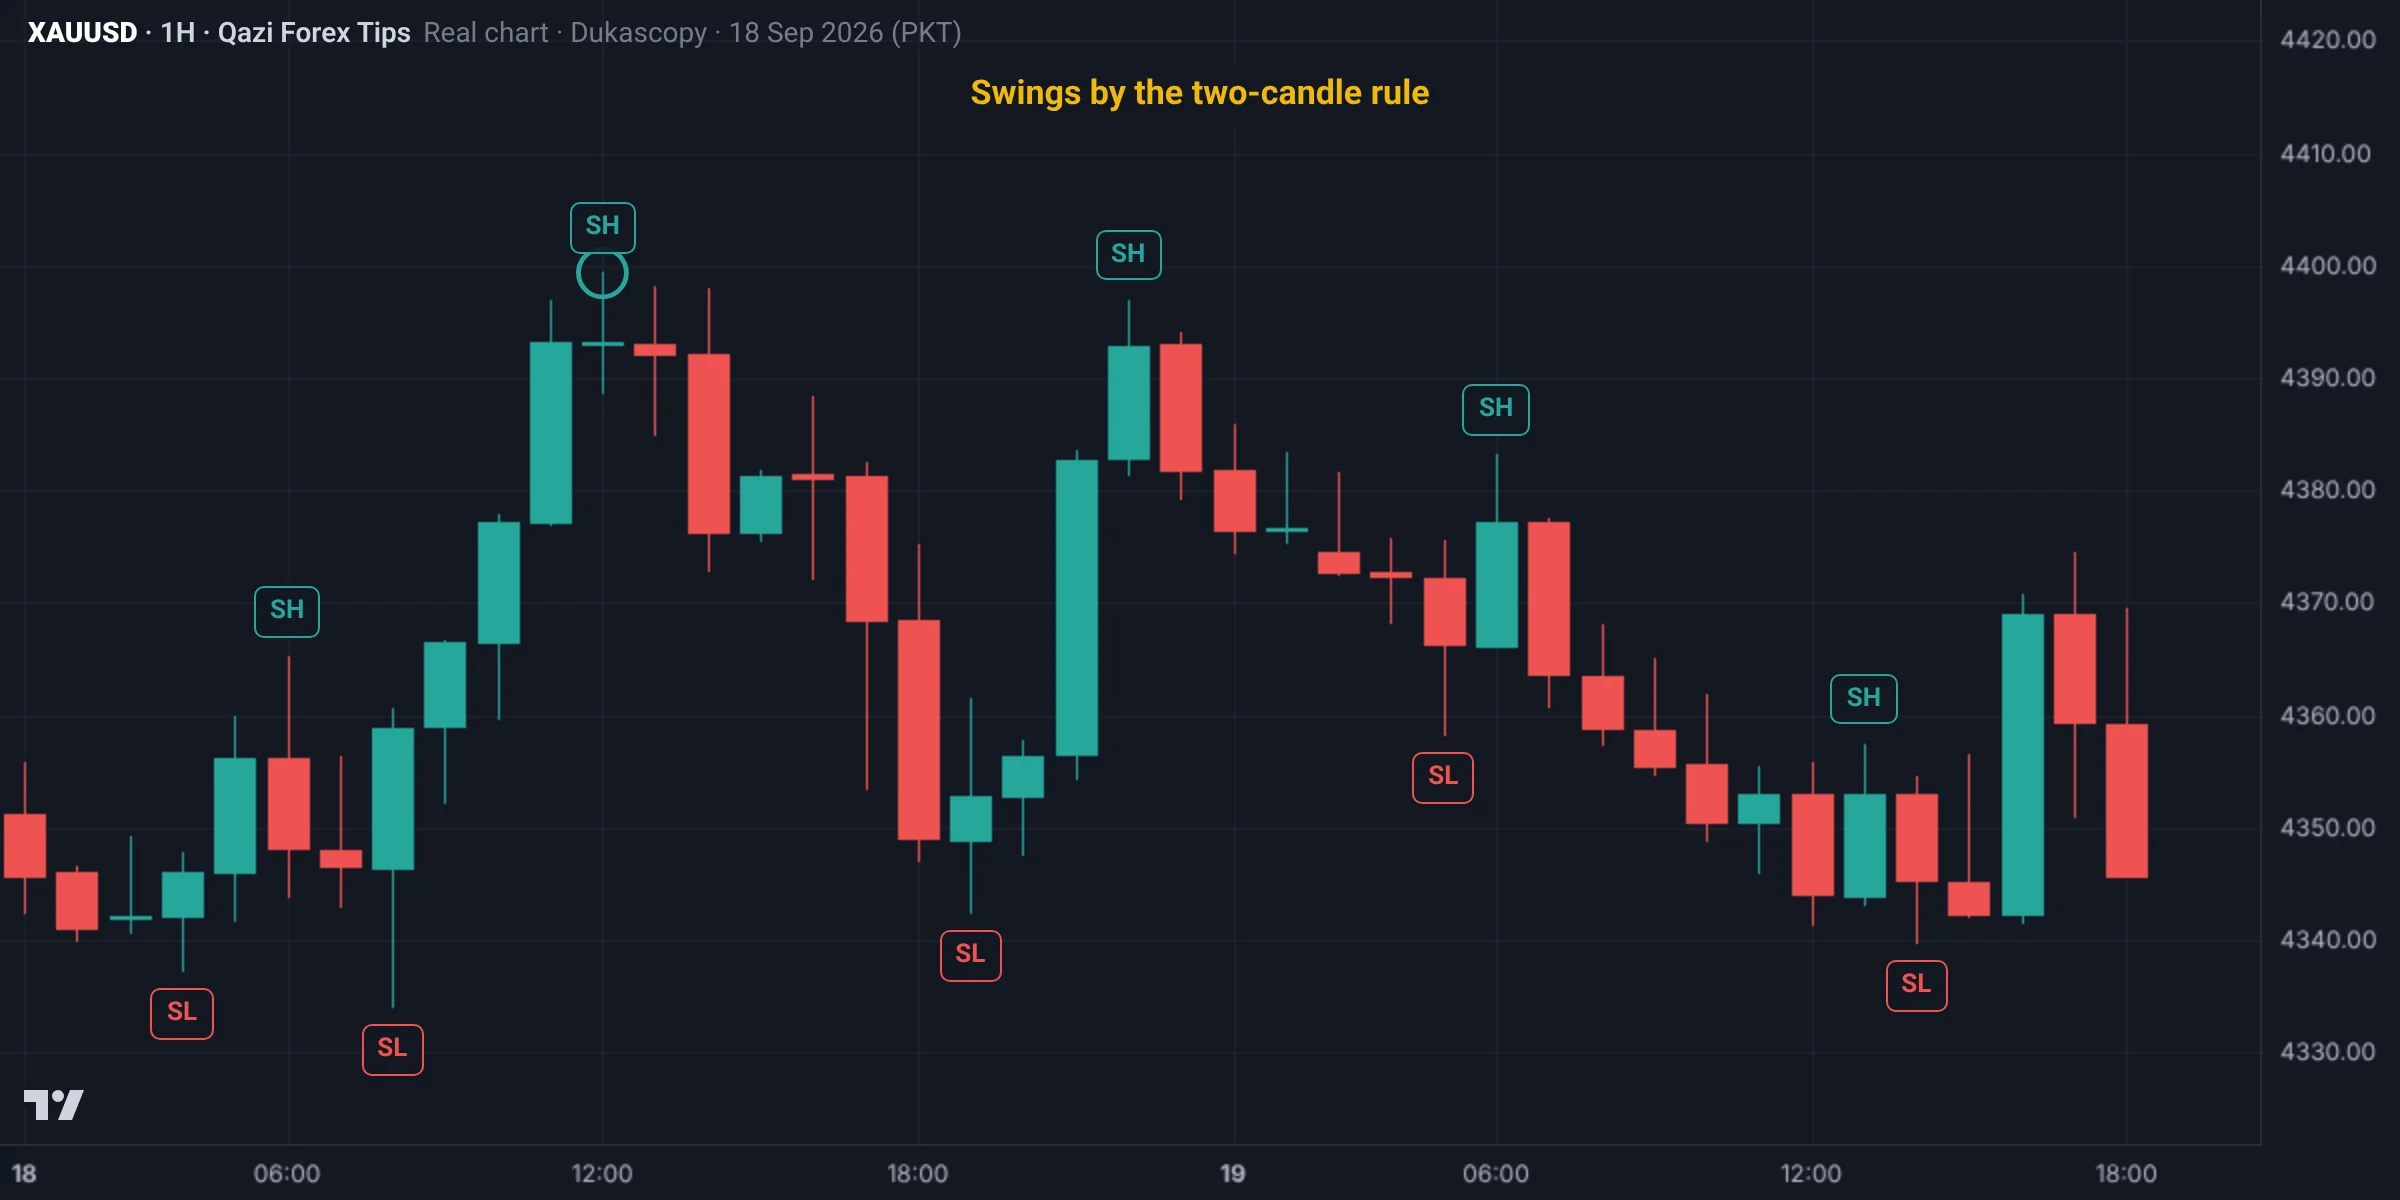
C (12:00 on 18 Sep, high 4,399.4) has at least two candles with lower highs on each side. The candles after A went higher, the candle before B has a higher high, and so does the candle before D, so they are not swings.
The marked chart
Test yourself: Lesson 0.3 quiz
11 questions. Pick one answer for each and you will see at once whether it is right and why. Your score and grade appear at the end. You need 70% to pass.
0 correct · 0 / 11
Question 1What is a swing high?
A swing high is the peak of a wave; a swing low is its trough.
Question 2What does the two-candle rule say?
At least two lower-high candles on each side confirm a swing high; the opposite for a swing low.
Question 3Why should you not treat the latest "swing" on a live chart as final?
A swing is always confirmed later.
Question 4What is the difference between a major and a minor swing?
Major swings are for bias, BOS and CHoCH; minor swings for entries and internal structure.
Question 5Where do you take the level of a swing high or low from?
Price really reached the wick, and that is where stops and liquidity sit.
Question 6What decides whether a swing has been broken?
The level comes from the wick; the break decision from the body close.
Question 7About how many candles should be on the chart when marking swings?
With too many candles the eye gets lost; the lesson uses 50 to 80 and 100 to 150.
Question 8If two swing highs appear with no low between them, what do you do?
Swing highs and swing lows alternate.
Question 9How many important swings does a good H1 chart usually have in a day?
The aim is to see the chart's story, not count every wiggle.
Question 10Gold H1 rises from 4,112 to 4,131.50, pulls back to 4,121.80, then rises to 4,140.20. What is the structure?
4,140.20 is above the previous high 4,131.50 (HH), and 4,121.80 is above the earlier low 4,112 (HL).
Question 11In a range, swing highs and lows form at equal levels. What do they become later?
Equal highs and lows of a range are a key part of liquidity in Phase 2; don't trade the middle of a range.
Lesson checklist
Tick each point once you understand it. Your ticks are saved in this browser.
Assignment
- On the Gold H1 chart, mark only the major swing highs and lows at 20 different places (20 screenshots), nothing else.
- Time yourself on each chart. Target: under two minutes.
- On 3 charts, also mark minor swings in a different colour.
- Post your best 5 charts in the group.
- Find one trending and one ranging part of Gold H1, mark the swings on both and describe the difference in your own words.
Post your assignment screenshots with your reasons in our free Facebook group, where your charts will be checked.
Join the free group
Who wrote this lesson
Dr. Qazi Abdul Basit, Ph.D
Ph.D in Business Administration and a forex and Gold trader since 2013. Founder of Qazi Forex Tips, which teaches traders in Pakistan and India price action, risk management and trading psychology in their own language: 65 student batches so far, free courses on YouTube, and MT5 tools for traders (QFT Replay Simulator, QFT Trade Assistant).
- 2013 trading since
- 75K+ Facebook group members
- 65 student batches
- 15K+ YouTube subscribers
How this lesson was made: the content follows Dr. Qazi's teaching method and years of trading. Real charts are built from Dukascopy Gold (XAUUSD) data, and backtest results are shown as they came out, even when negative. We do not sell signals, manage accounts or take money from any broker. Last updated: 19 November 2026.
Questions
What is a swing high?
A candle whose high is higher than at least two candles on each side of it.
Should swings be marked on the wick or the body?
On the wick, because stop losses and liquidity sit beyond the wick extremes.
What is the difference between a major and a minor swing?
A major swing is followed by a move that changes structure; a minor swing is a small wave inside a larger move.
Why are swings important in SMC?
Structure, BOS, CHoCH, liquidity and order blocks are all defined from swing highs and lows.
Which timeframe should I practise swings on?
Start on H1, then apply the same rule on H4 and M15.
When is a swing confirmed?
When at least two candles on its right side have formed without exceeding it.
What is the difference between a swing high and a swing low?
A swing high is a candle with lower highs on both sides; a swing low is a candle with higher lows on both sides. Buy-side liquidity sits above swing highs and sell-side liquidity below swing lows.
What does retracement mean?
A retracement (pullback) is price moving back against the trend for a while before continuing in the trend direction. It is measured with Fibonacci between a swing high and swing low (lesson 3.6).
Read more
Education only, not financial advice. Trading forex, Gold and CFDs carries a high risk of loss. SMC concepts describe tendencies, not guarantees. Lesson 3 of 38.