 Qazi Forex Tips

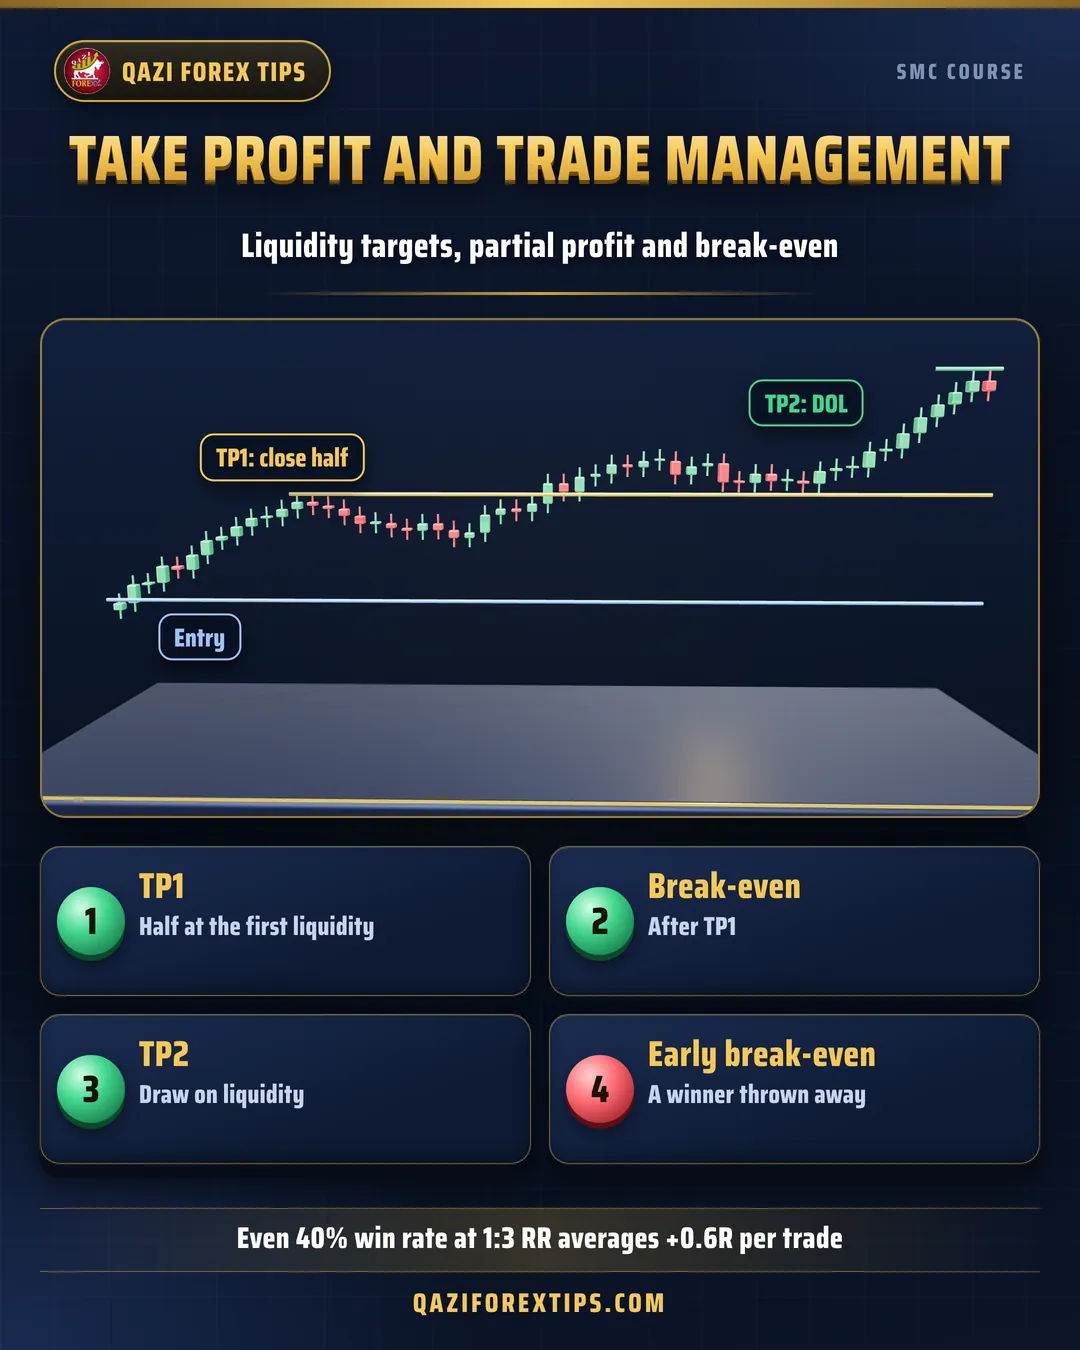
Where to put the target
In SMC the target comes from liquidity, not a guess:
- TP1: the first nearby liquidity: the MSS high, the session high, or an internal FVG (IRL).
- TP2: the draw on liquidity (lesson 2.5): PDH, the weekly high, equal highs.
- Runner (optional): with a very strong higher timeframe trend, a small part to the next big pool.
Place targets a little before the liquidity ($0.5 to $1 on Gold), because price often turns without touching the exact level.
Partial profit and break-even
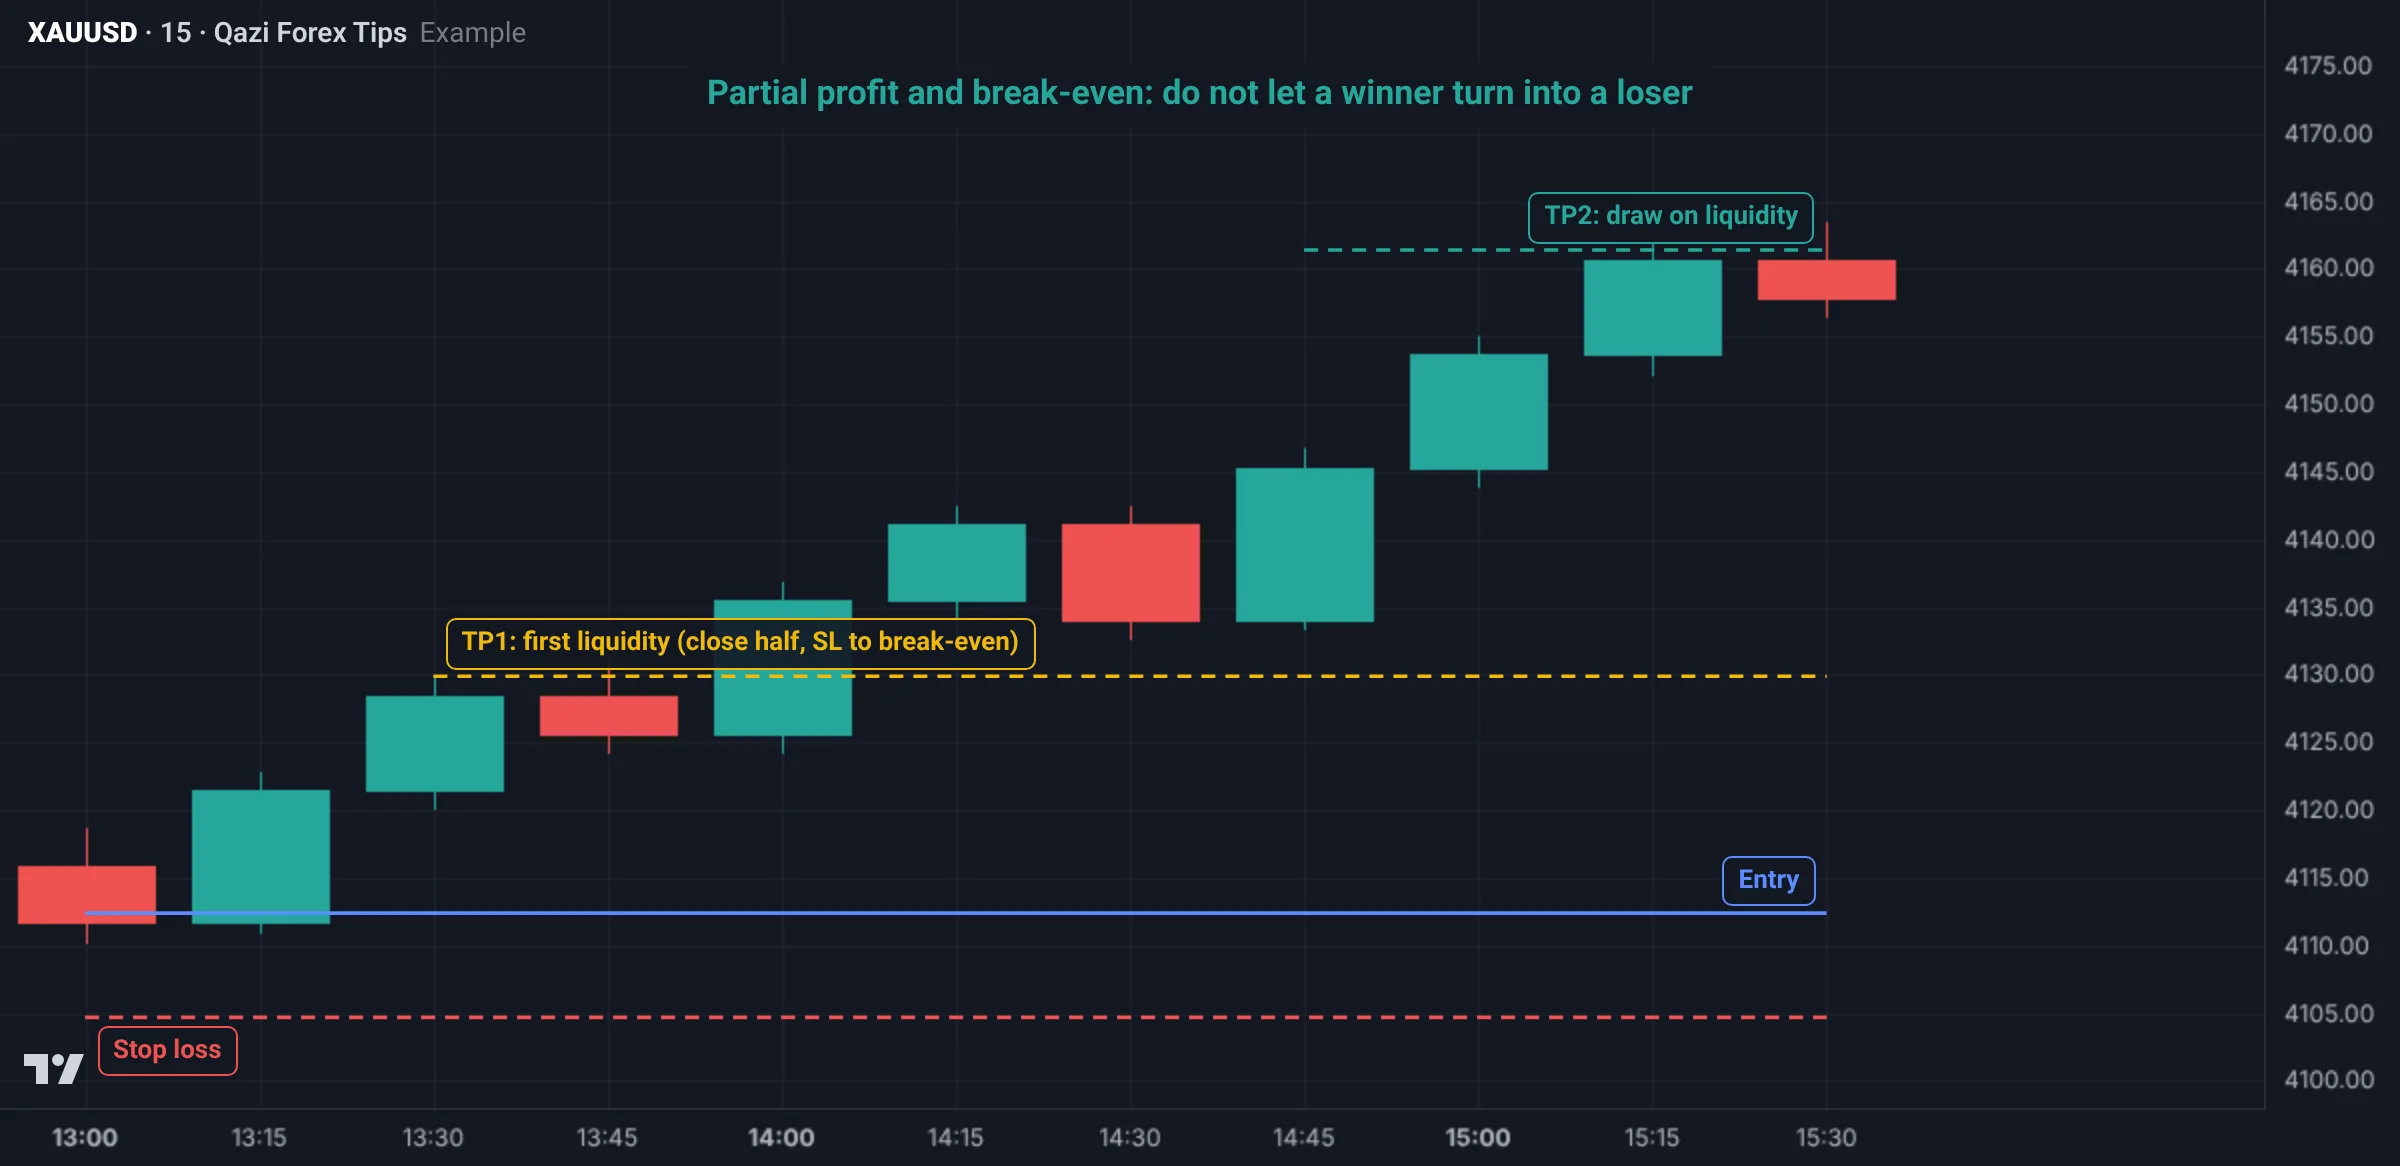
A common, balanced approach:
- Close 50% at TP1 and move the stop on the rest to break-even (the entry).
- Close the rest at TP2.
If the trade comes back after TP1 the result is still a profit, and if it reaches the DOL you get the full move.
When to move to break-even
Moving to break-even too early is the most common mistake: price retests your entry (often to fill the FVG), you exit at zero, and then it runs to target. Better rules:
- break-even after TP1, or
- when price makes a new BOS and is at least 1R away from the entry.
- Not five minutes after entry just because of fear.
Trailing by structure
If you keep a runner, trail the stop with structure: after each new BOS, move the stop below the fresh HL (in a bullish trade). Fixed pip or dollar trailing often stops you out early on Gold, because normal Gold pullbacks are large.
RR and win rate: the real math
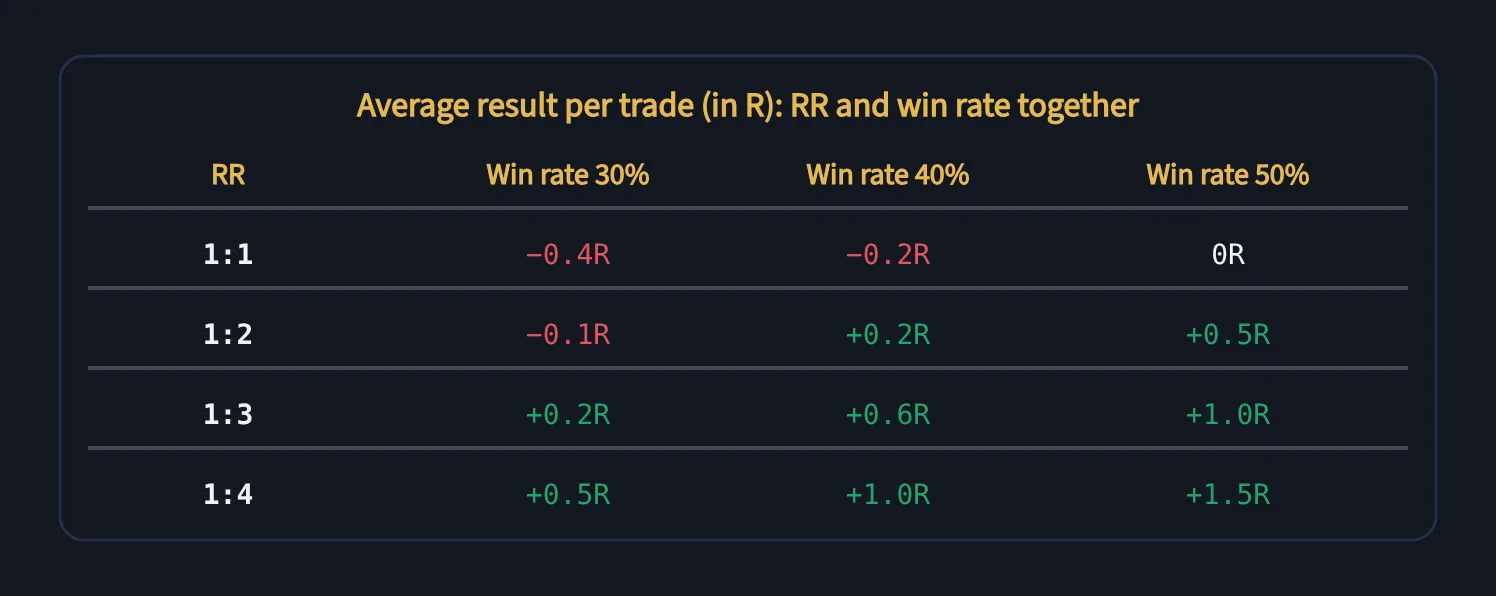
Average result per trade = (win rate × average win in R) − (loss rate × 1R).
- 40% win rate with 1:3 RR: 0.4 × 3 − 0.6 = +0.6R per trade. Over 100 trades that is +60R, about +60% at 1% risk.
- 60% win rate with 1:1 RR: 0.6 − 0.4 = +0.2R.
- This is why SMC can be profitable with a modest win rate, as long as the RR is good and you do not cut winners early.
What not to do during a trade
- Stare at every M1 candle. After entry set alerts (TP1, SL, invalidation) and minimise the chart.
- Change the target without a rule. Change it only for new liquidity or new structure.
- Hold a profitable trade into news. Take TP1 or close 30 minutes before (lesson 4.4).
- Hold an intraday trade overnight after the London close unless your plan says so.
Gold example: managing a trade
Entry 4,116, SL 4,108 ($8, 1R), 0.02 lot (risk $16).
- TP1: session high 4,132; close 0.01 lot just before at 4,131.5: +$15.5 (about +1R). Stop to break-even 4,116.
- TP2: PDH 4,149; close the other 0.01 just before at 4,148.5: +$32.5.
- Total: +$48, about +3R. Had price returned after TP1, the result would be +$15.5 (about +1R), not zero.
- Holding the full position to TP2 would have made +$65 (+4.1R); but on many days price returns after TP1. Your backtest decides which method is better.
Phase 6 gate: before moving on
- Your per-trade, daily and weekly risk is written down and you have followed it.
- You can work out the Gold lot for any stop in 30 seconds.
- Your TP, partial profit and break-even rules are written.
- You know your backtest expectancy (R per trade), and it is positive.
Next phase: backtest to live, where your whole system is proven in numbers.
Real Gold chart examples
Managing the 27 Oct 2026 model A trade (lesson 5.2), Gold M15 (data: Dukascopy, bid price; Pakistan time):
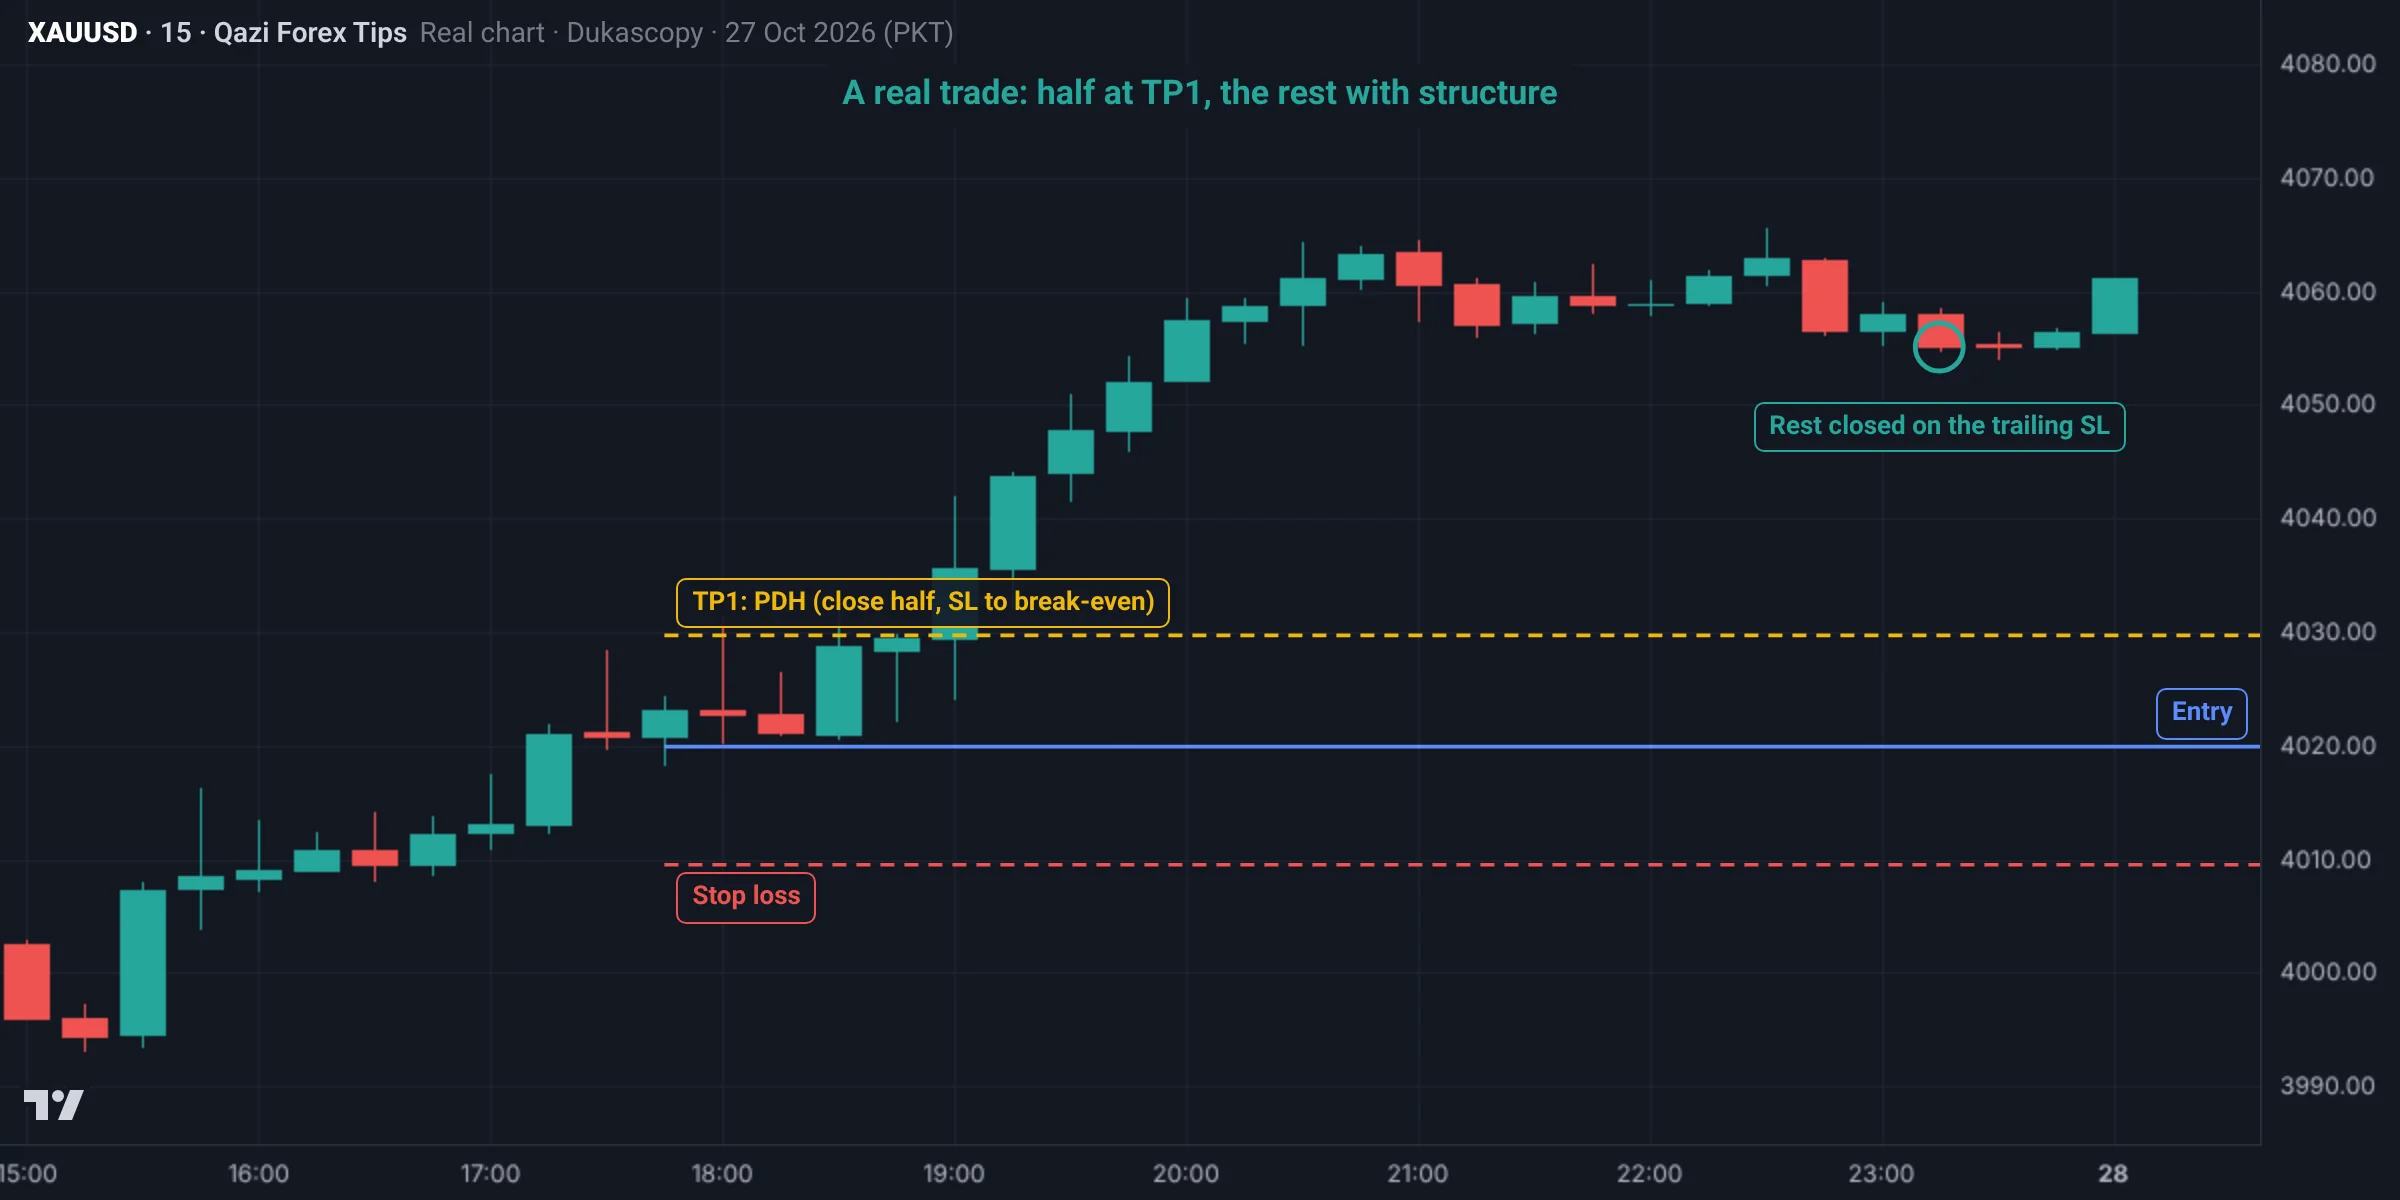
- Entry 4,019.9, SL 4,009.5 (risk $10.4 = 1R). A $5,000 account at 1% risk ($50): lot = 50 ÷ (10.4 × 100) = 0.048, so 0.04.
- TP1: the PDH at 4,029.7, hit at 18:00. Close 0.02 lot: +$19.6. Move the rest to break-even.
- Trailing: the stop moved up under each new M15 HL. At 23:15 structure broke and the remaining 0.02 lot closed at 4,055.1: +$70.4.
- Total: +$90.0, about +2.2R.
| Method | Result |
|---|---|
| All at TP1 | +0.9R |
| Half TP1, half trailing | +2.2R |
| All trailing | +3.4R |
Trailing did better that day, but on many days price returns after TP1. Your backtest decides the right method.
Second example: managing a sell (22 Oct)
Managing the 22 Oct 2026 model A sell (the second example in lesson 5.2), on Gold M15 (data: Dukascopy, bid price; Pakistan time):
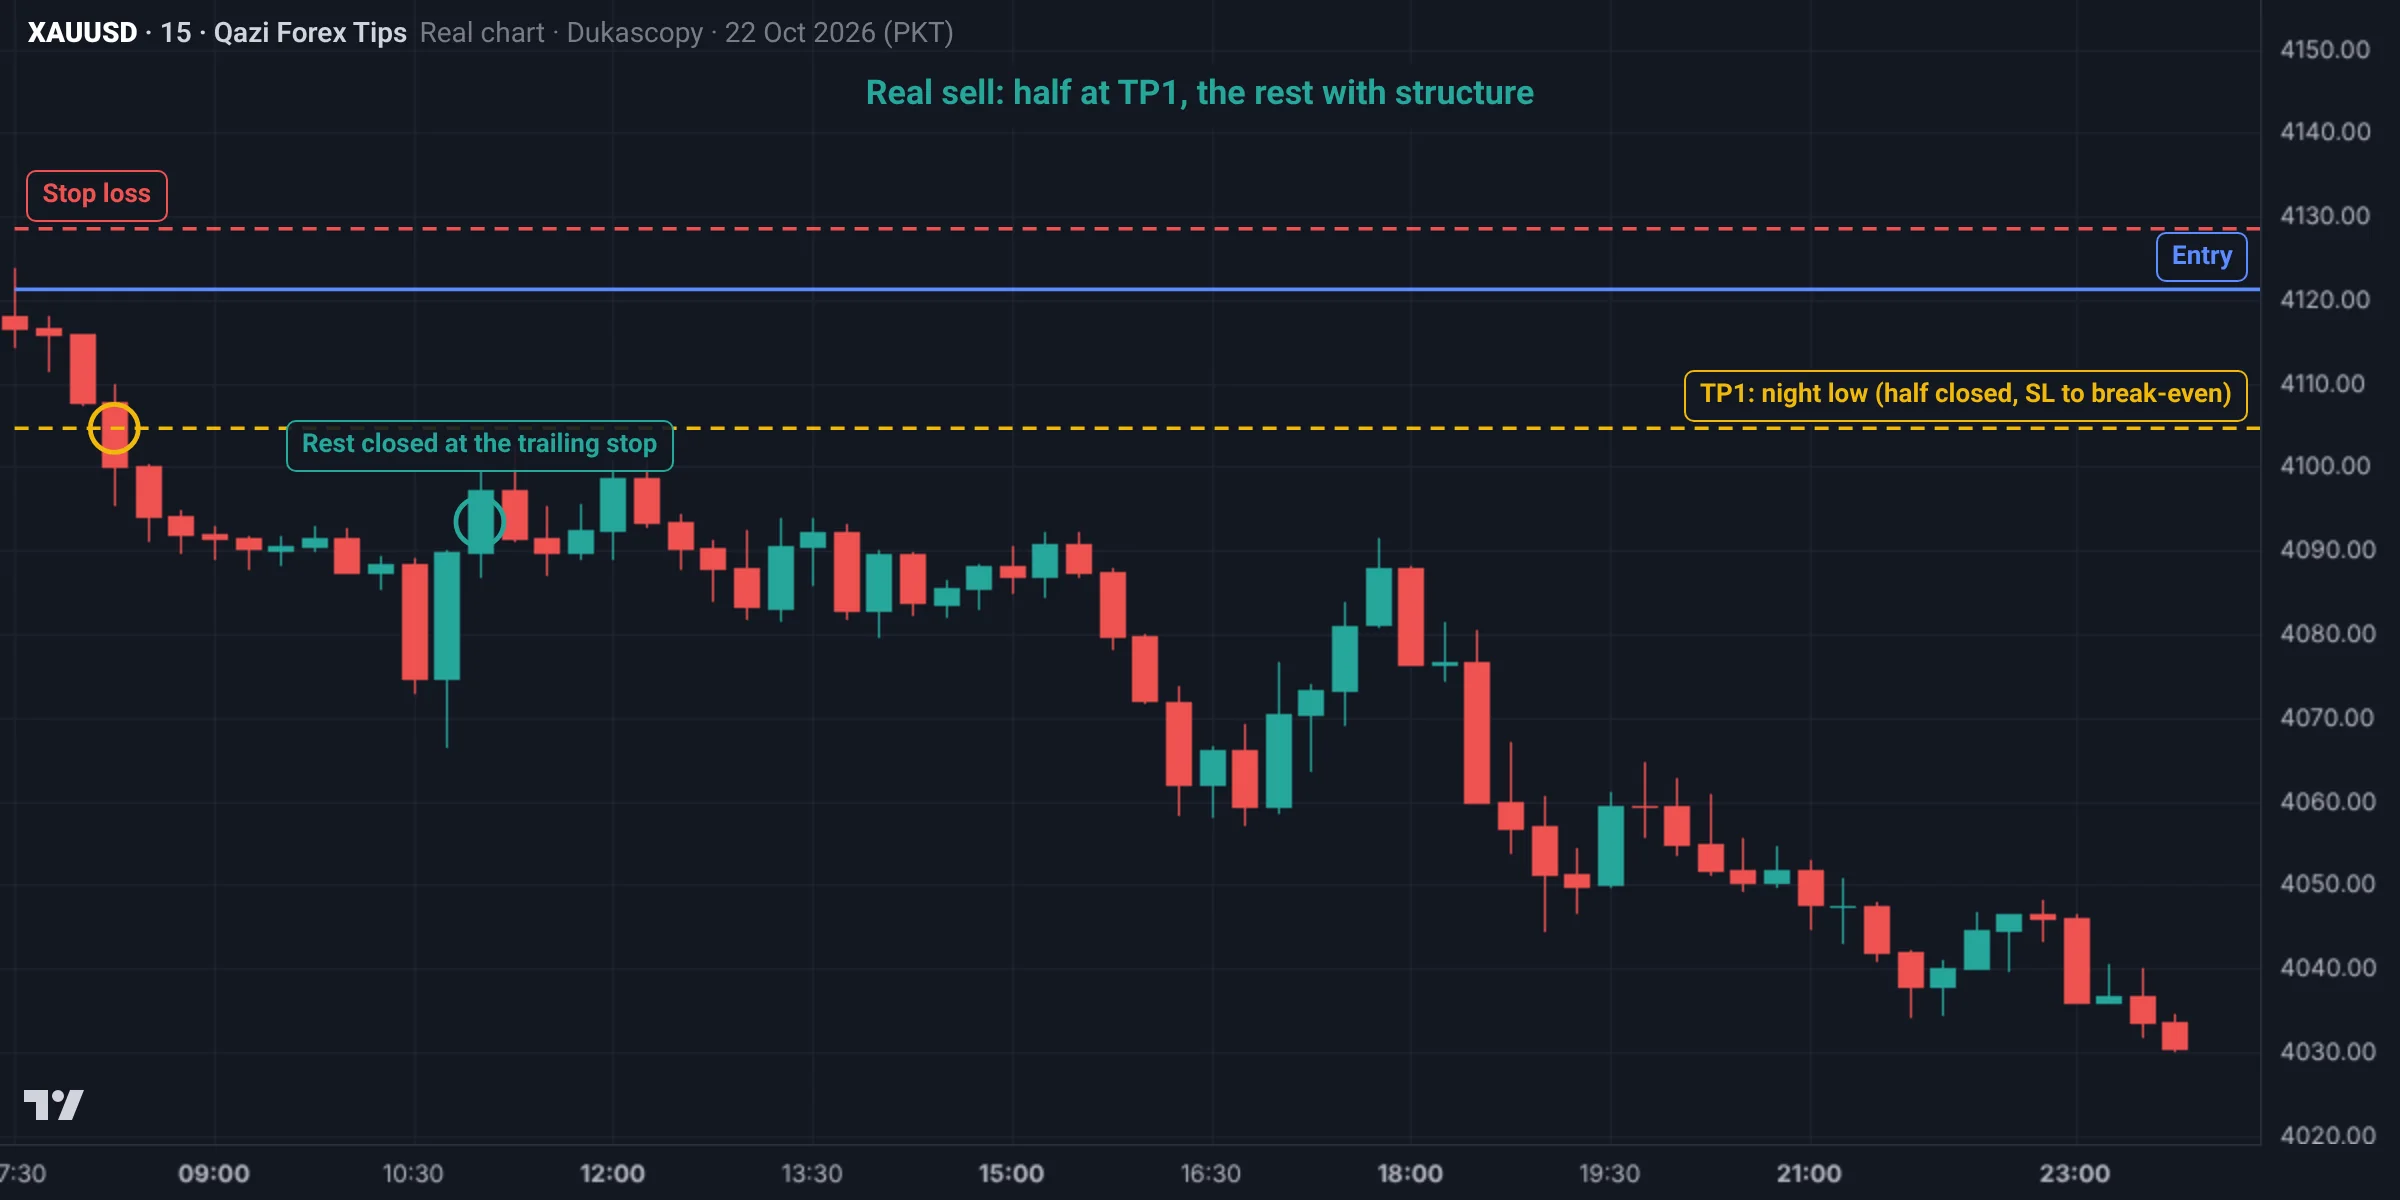
- Entry 4,121.2, SL 4,128.5, risk $7.3 (1R).
- TP1: the night low at 4,104.6, hit at 08:15: half the position closed (+2.3R) and the stop moved to entry (break-even).
- Trailing: the stop came down above each new M15 lower high. At 11:00 price bounced and the second half closed at 4,093.4 (+3.8R).
| Method | Result |
|---|---|
| All at TP1 | +2.3R |
| Half TP1, half trailing | +3.1R |
| All trailing | +3.8R |
One more thing: after the trailing exit price went on to 4,030.1 that day. Trailing protected the profit but left the last part of the big move. No method is best every day; pick yours by backtest and stick to it.
Summary
- Targets from liquidity, a little before the level: TP1 nearby, TP2 the DOL.
- Close half at TP1 and move to break-even; not too early.
- Trail by structure, not a fixed distance.
- Expectancy = win rate × win − loss rate; a good RR stays profitable with a lower win rate.
Try this lesson on your own chart
Qazi Forex Tips' own tools that make this lesson easier. A tool helps; your rules make the decision.
QFT Trade Assistant panel
Free demo · MT5 & MT4Calculates the lot from your risk, lets you drag SL and TP on the chart and place one-click orders, with partial close, break-even, trailing stop, a news lock and a Prop Firm Guard.
Details and downloadSpot it on the chart: practice
This is a real Gold chart (Dukascopy data, Pakistan time). Study it and pick an answer. After you answer, the fully marked chart and the explanation appear.
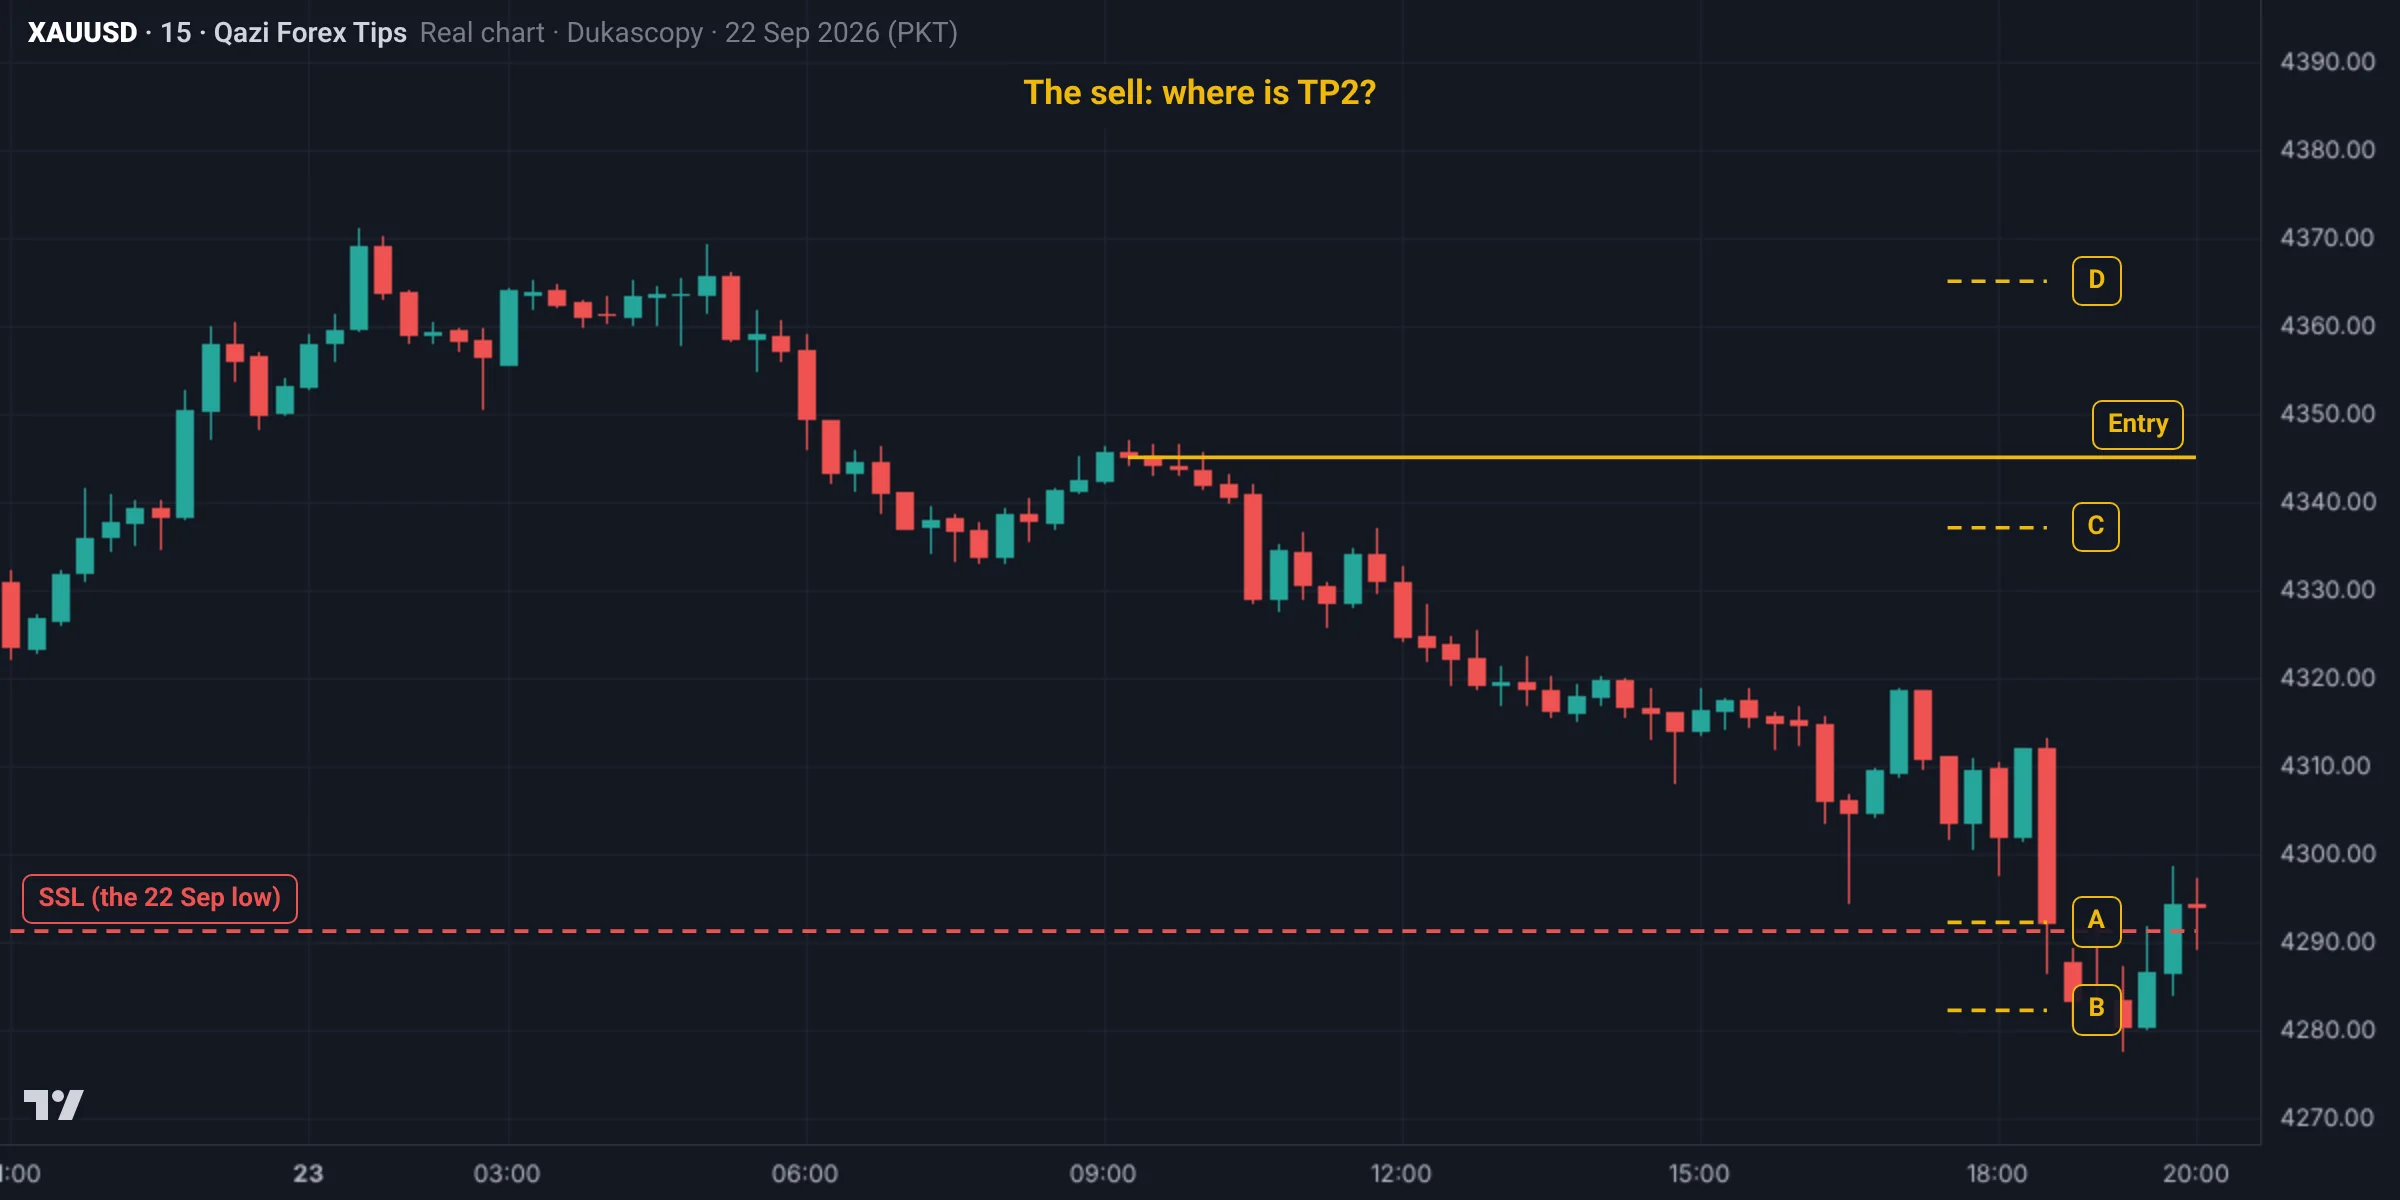
For the same sell (4,345.0) the DOL is the 22 Sep low at 4,291.2 below. Where do you put TP2?
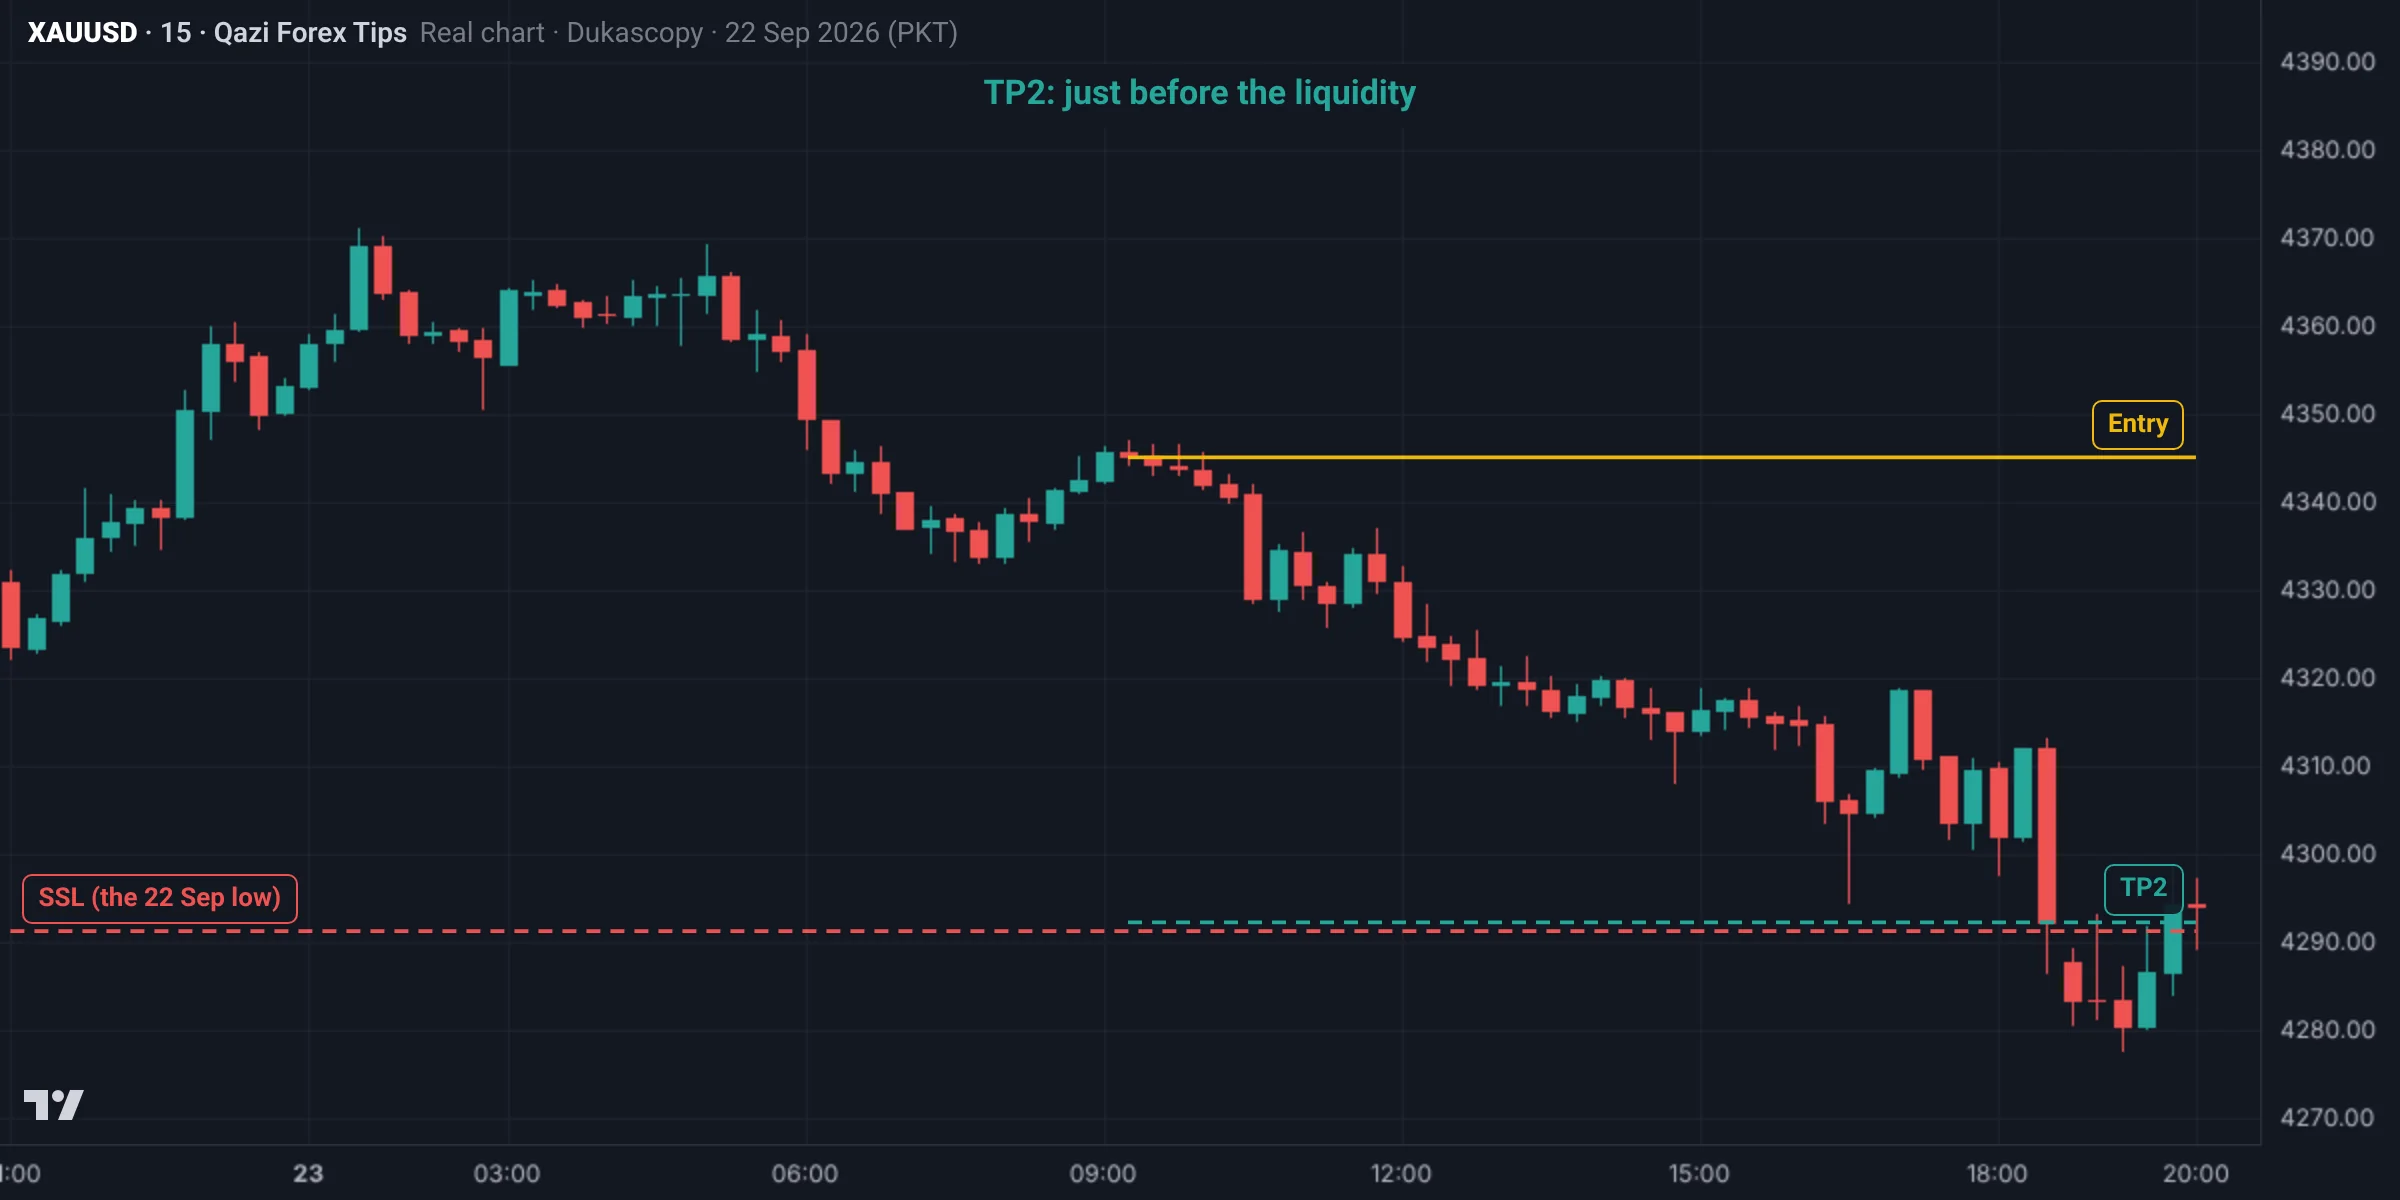
A (4,292.2): just before the liquidity, because price often turns at it or a little before. That day price reached 4,277.7, so TP2 was hit. B is beyond the liquidity (it may never get there), C is too close (a TP1 perhaps, not the DOL), and D is above the entry, the wrong side for a sell.
The marked chart
Test yourself: Lesson 6.2 quiz
9 questions. Pick one answer for each and you will see at once whether it is right and why. Your score and grade appear at the end. You need 70% to pass.
0 correct · 0 / 9
Question 1Where does the target come from in SMC?
Place targets a little before the liquidity (0.5 to 1 dollar on Gold).
Question 2What is a common balanced management approach?
If price returns after TP1 it's still a profit; if it reaches the DOL you get the full move.
Question 3When is it better to move to break-even?
Early break-even is the most common mistake; price retests the entry to fill the FVG, then runs.
Question 4How do you trail a runner's stop?
Normal Gold pullbacks are large, so fixed trailing stops you out early.
Question 5At a 40% win rate and 1:3 RR, what is the average result per trade?
0.4 × 3 − 0.6 = 0.6R; about +60R over 100 trades.
Question 6At a 60% win rate and 1:1 RR, what is the result per trade?
0.6 − 0.4 = 0.2R; that is why SMC can profit with a modest win rate and good RR.
Question 7What should you not do during a trade?
Don't hold an intraday trade overnight after the London close unless the plan says so.
Question 8Gold example: entry 4,116, SL 4,108, 0.02 lot. Half closed at 4,131.5, half at 4,148.5. Total?
+15.5 and +32.5; had price returned after TP1, still +15.5 (about +1R).
Question 9Which is one of the Phase 6 gate conditions?
Also: written risk limits, TP and break-even rules, and a positive backtest expectancy.
Lesson checklist
Tick each point once you understand it. Your ticks are saved in this browser.
Assignment
- Recount your last 20 trades (or backtest) three ways: all to TP2, half TP1 and half TP2, and all at TP1.
- Write the total R for each method.
- Count how often an early break-even took you out of a winner.
- Write your take profit and trade management rule.
- Post your results in the group.
Post your assignment screenshots with your reasons in our free Facebook group, where your charts will be checked.
Join the free group
Who wrote this lesson
Dr. Qazi Abdul Basit, Ph.D
Ph.D in Business Administration and a forex and Gold trader since 2013. Founder of Qazi Forex Tips, which teaches traders in Pakistan and India price action, risk management and trading psychology in their own language: 65 student batches so far, free courses on YouTube, and MT5 tools for traders (QFT Replay Simulator, QFT Trade Assistant).
- 2013 trading since
- 75K+ Facebook group members
- 65 student batches
- 15K+ YouTube subscribers
How this lesson was made: the content follows Dr. Qazi's teaching method and years of trading. Real charts are built from Dukascopy Gold (XAUUSD) data, and backtest results are shown as they came out, even when negative. We do not sell signals, manage accounts or take money from any broker. Last updated: 19 November 2026.
Questions
Where should take profit go in SMC?
At liquidity: TP1 at the nearby high or low, TP2 at the draw on liquidity, a little before the level.
When should I move to break-even?
After TP1, or once price makes a new BOS and is at least 1R away; not out of fear.
What is expectancy in trading?
The average result per trade in R: win rate times average win minus loss rate times one R.
What is a trailing stop?
Moving the stop loss along with price as a trade goes into profit, for example behind each new swing. It protects profit but sometimes leaves the last part of a big move.
What risk-reward should I use in SMC?
At least 1:2, with the target always at the next liquidity. If the RR to the DOL is below 1:2, skipping the trade is better.
Read more
Education only, not financial advice. Trading forex, Gold and CFDs carries a high risk of loss. SMC concepts describe tendencies, not guarantees. Lesson 34 of 38.