 Qazi Forex Tips

Why daily liquidity matters most
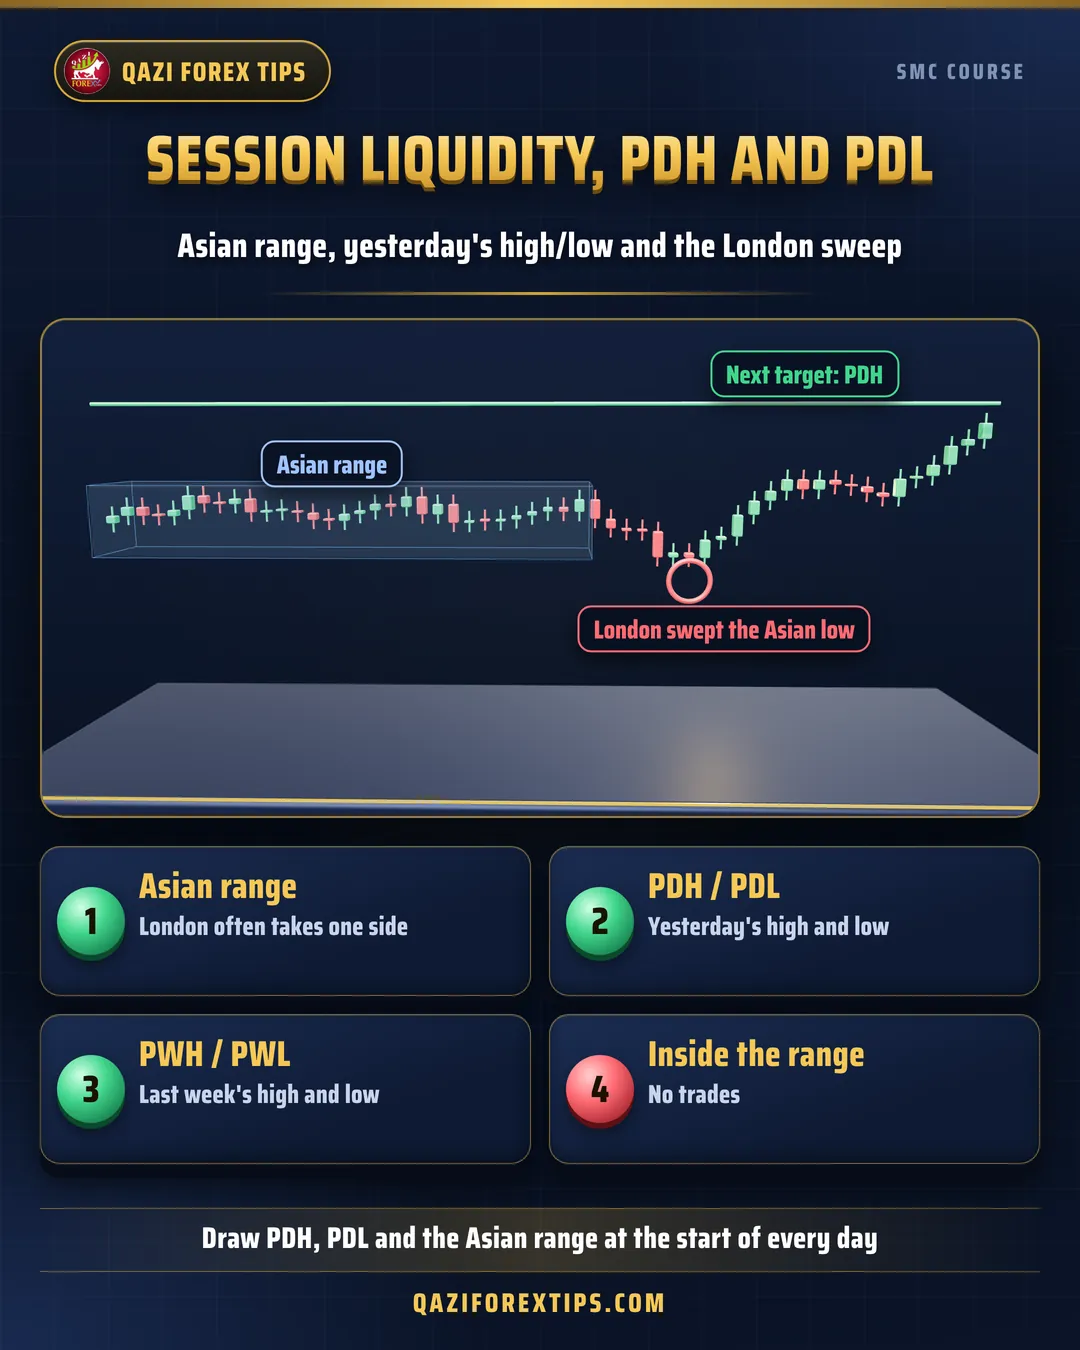
For an intraday trader, the most useful liquidity is the kind that forms fresh every day: session highs and lows, yesterday's high and low, and last week's high and low. Traders all over the world see the same levels, so the most stops and targets gather there. Many days tell a simple story: price takes one side's liquidity, then travels to the other side.
The key daily liquidity
| Name | Meaning | Why it matters |
|---|---|---|
| Asian high / low | The range of the Asian session (about 5 am to 12 pm Pakistan time) | London often sweeps one side right after it opens |
| London high / low | The range of the London session | Often taken during the New York session |
| PDH / PDL | Previous Day High / Low | Stops and targets for intraday traders |
| PWH / PWL | Previous Week High / Low | A big target for swing traders |
The Asian range and the London sweep
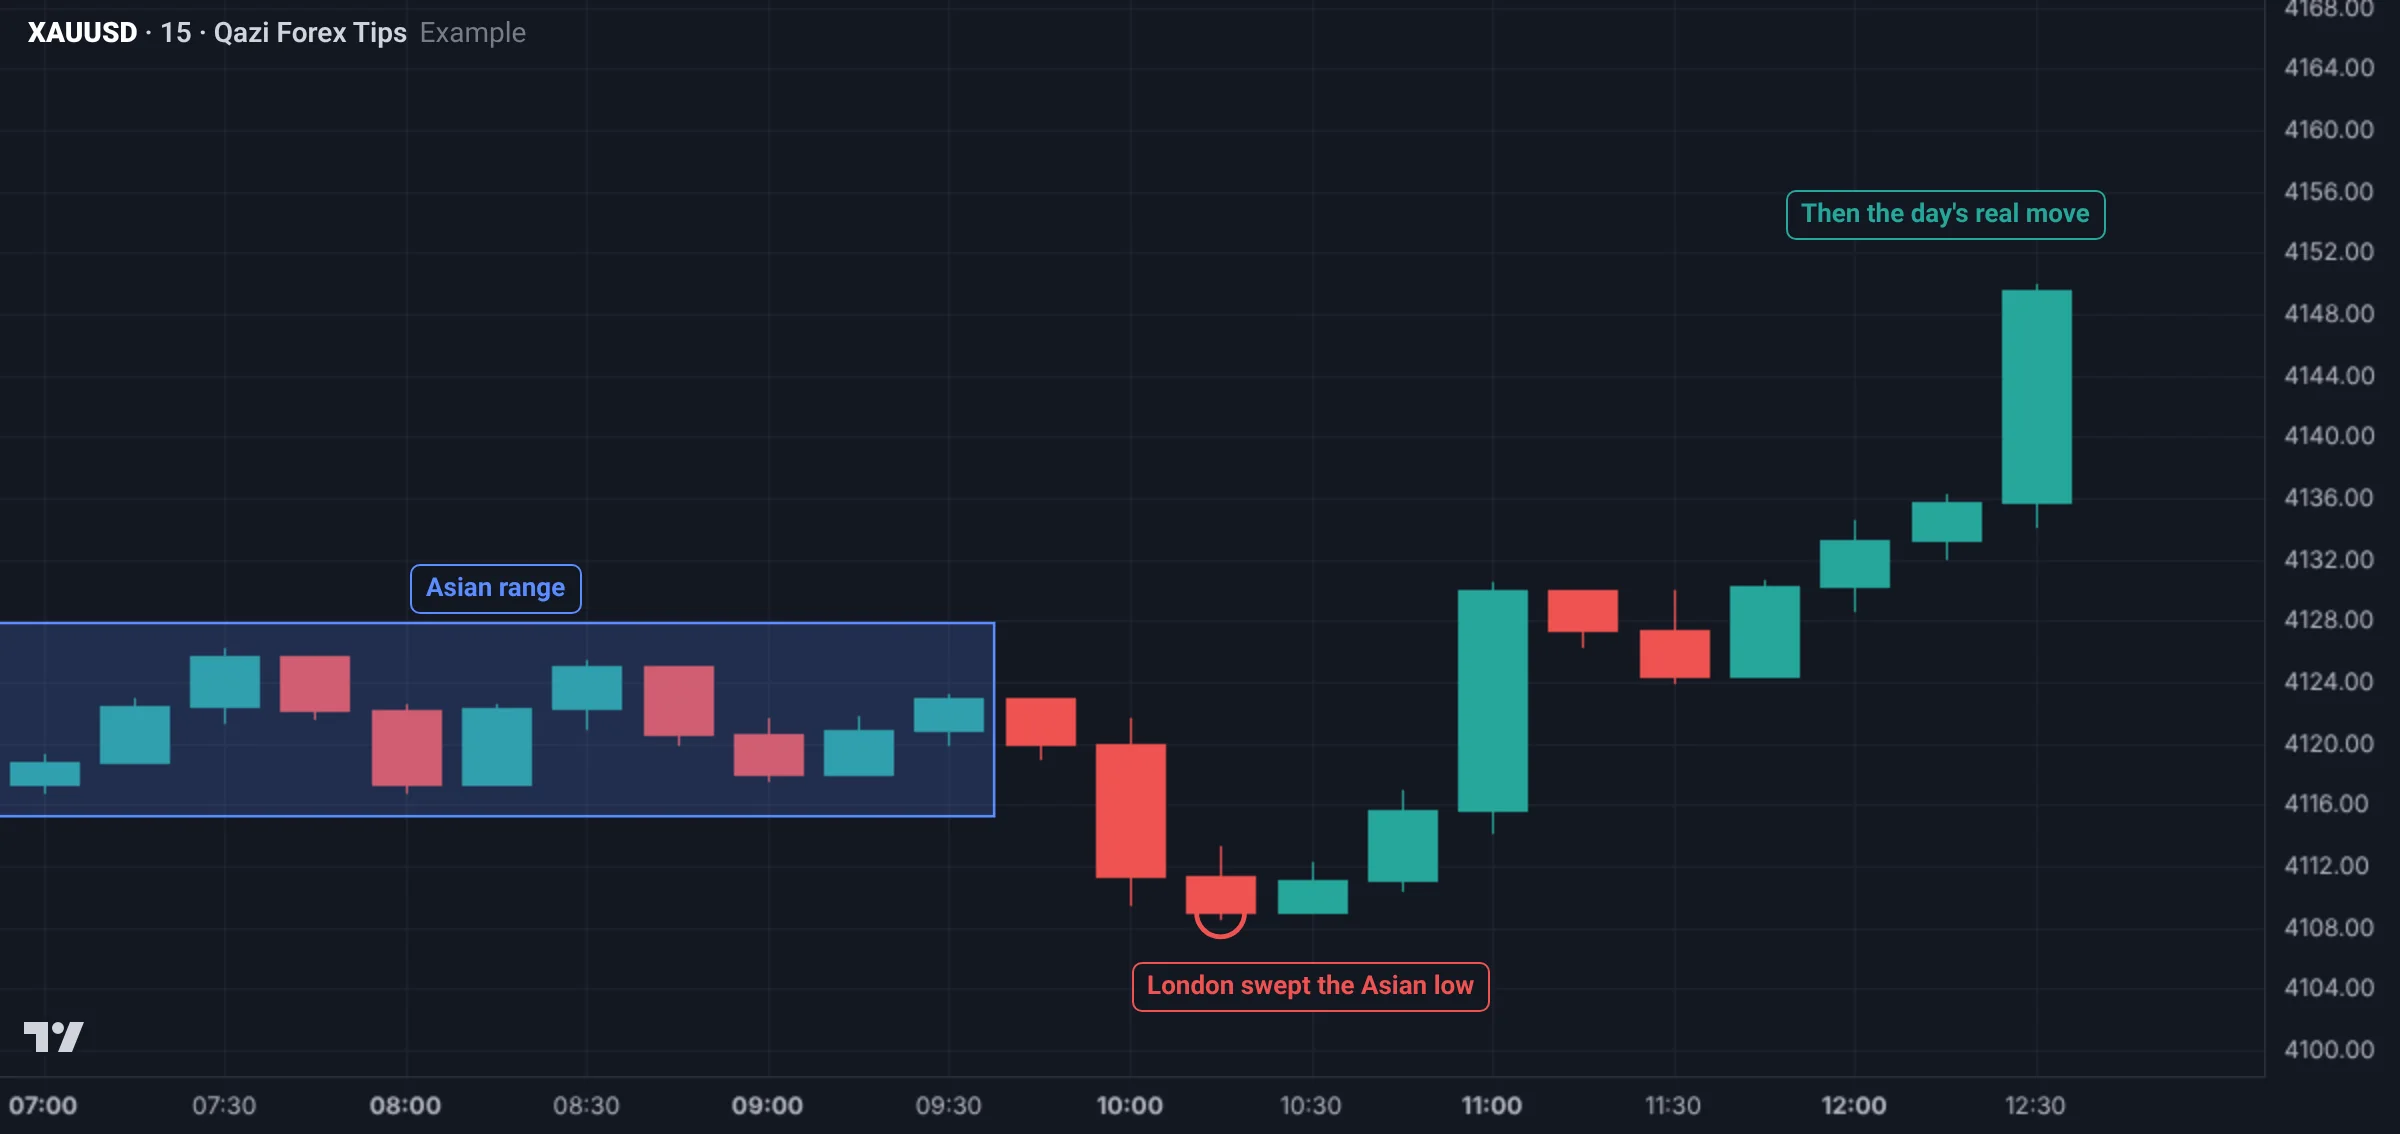
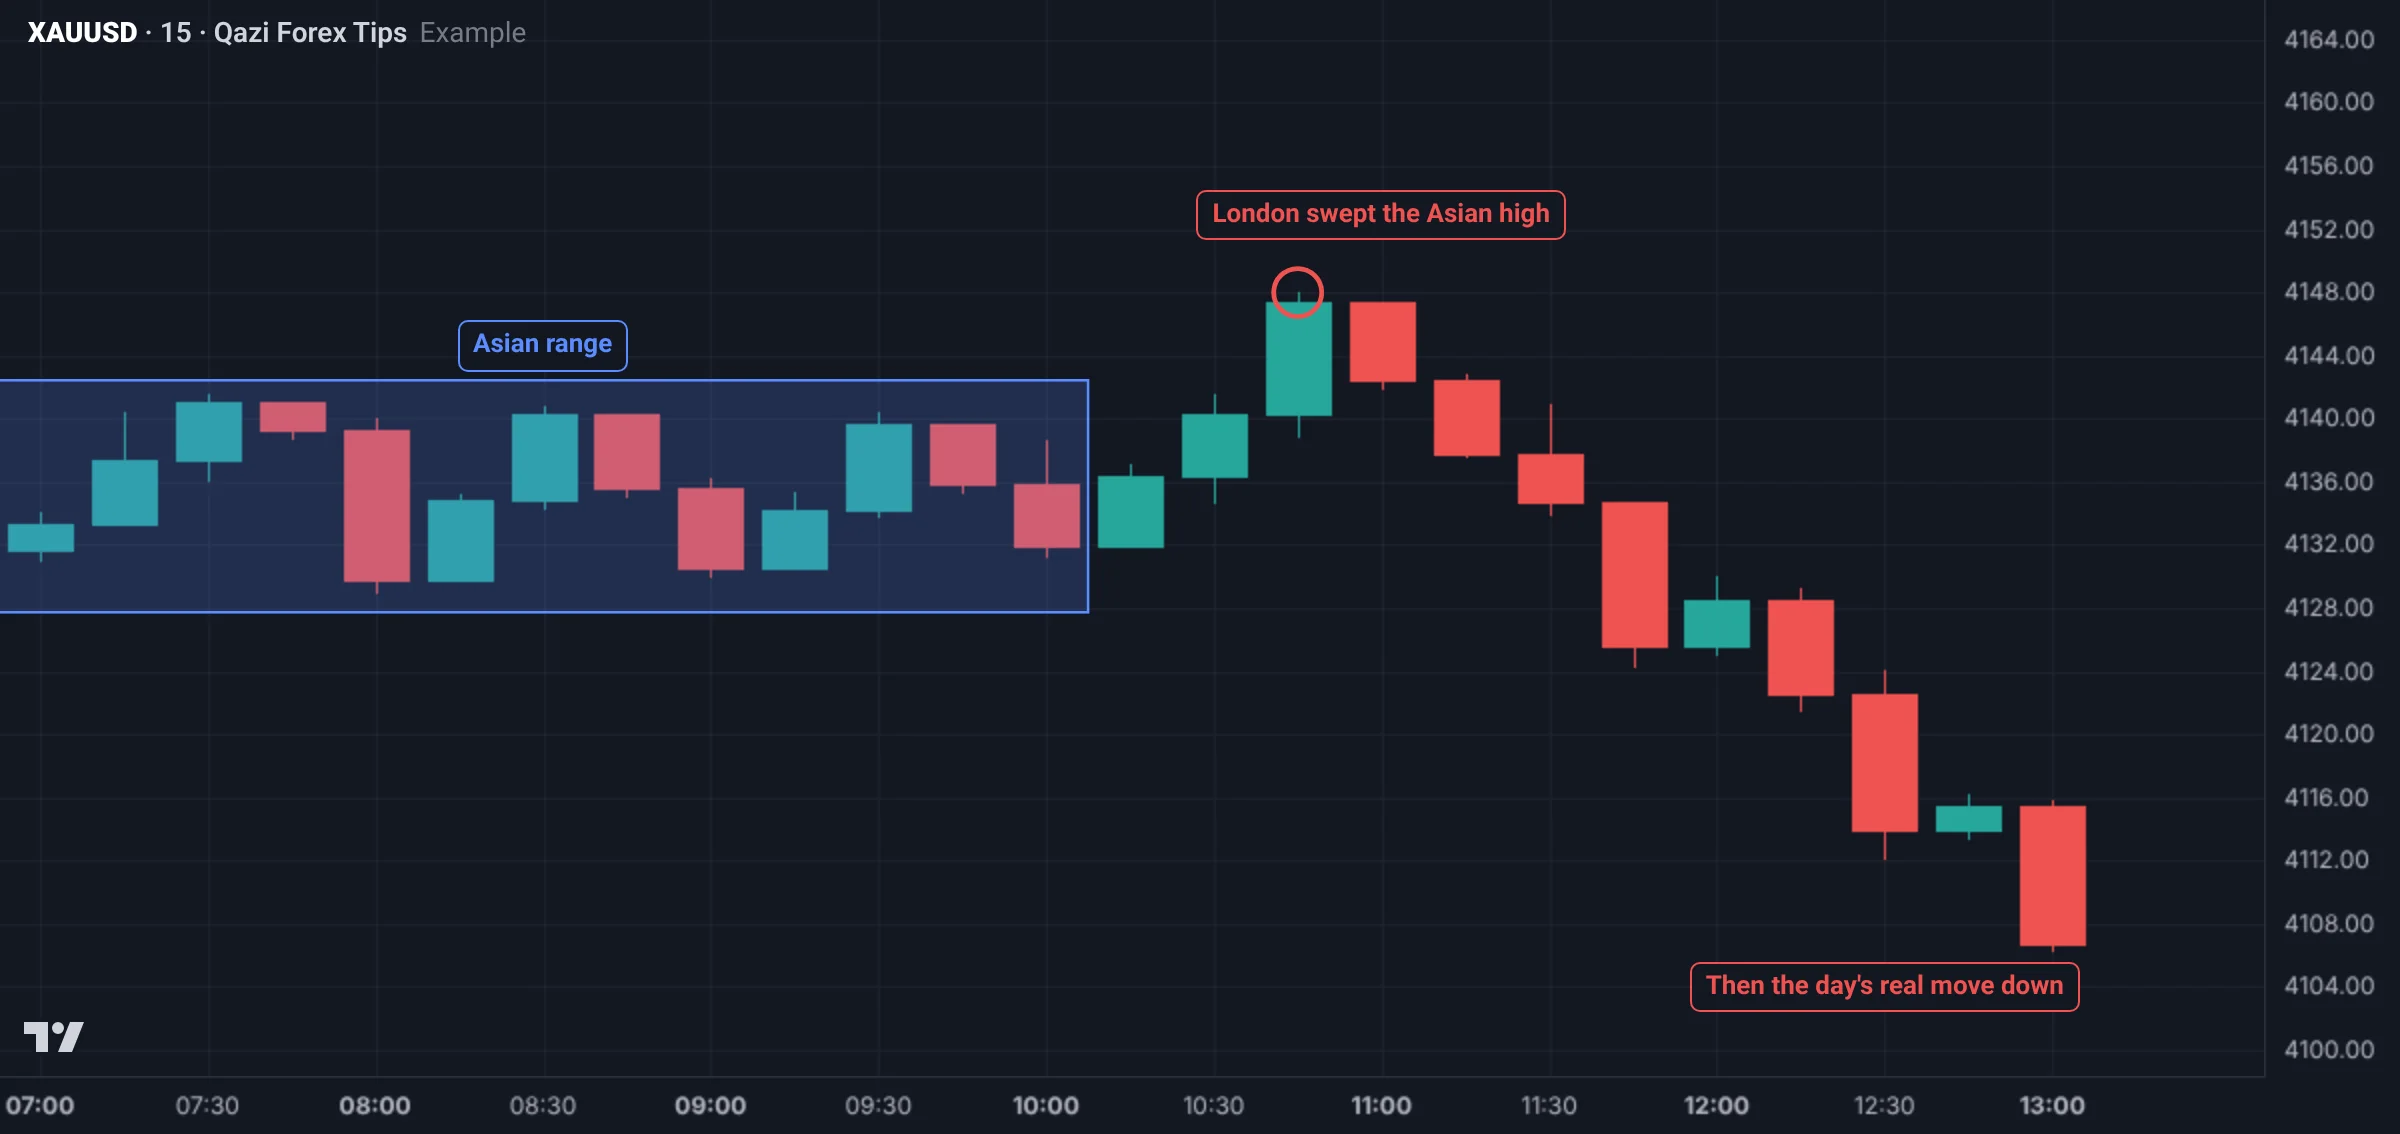
Volume is usually low in the Asian session and price stays in a narrow range. Stops build up above and below it: buyers' stops below, sellers' stops above, and breakout orders on both sides. London brings big volume. Price often sweeps one side first, then moves in the day's real direction. Many traders call this the London Judas swing.
How do you know which side London will take?
- Higher timeframe bias: if H4 is bullish, London is more likely to take the Asian low first (liquidity for buying); if bearish, the Asian high.
- Nearest liquidity: the edge of the Asian range that sits close to other liquidity (PDL, EQL) is more attractive.
- Wait: don't trade on a guess. Let the sweep happen, then look for a CHoCH.
PDH and PDL
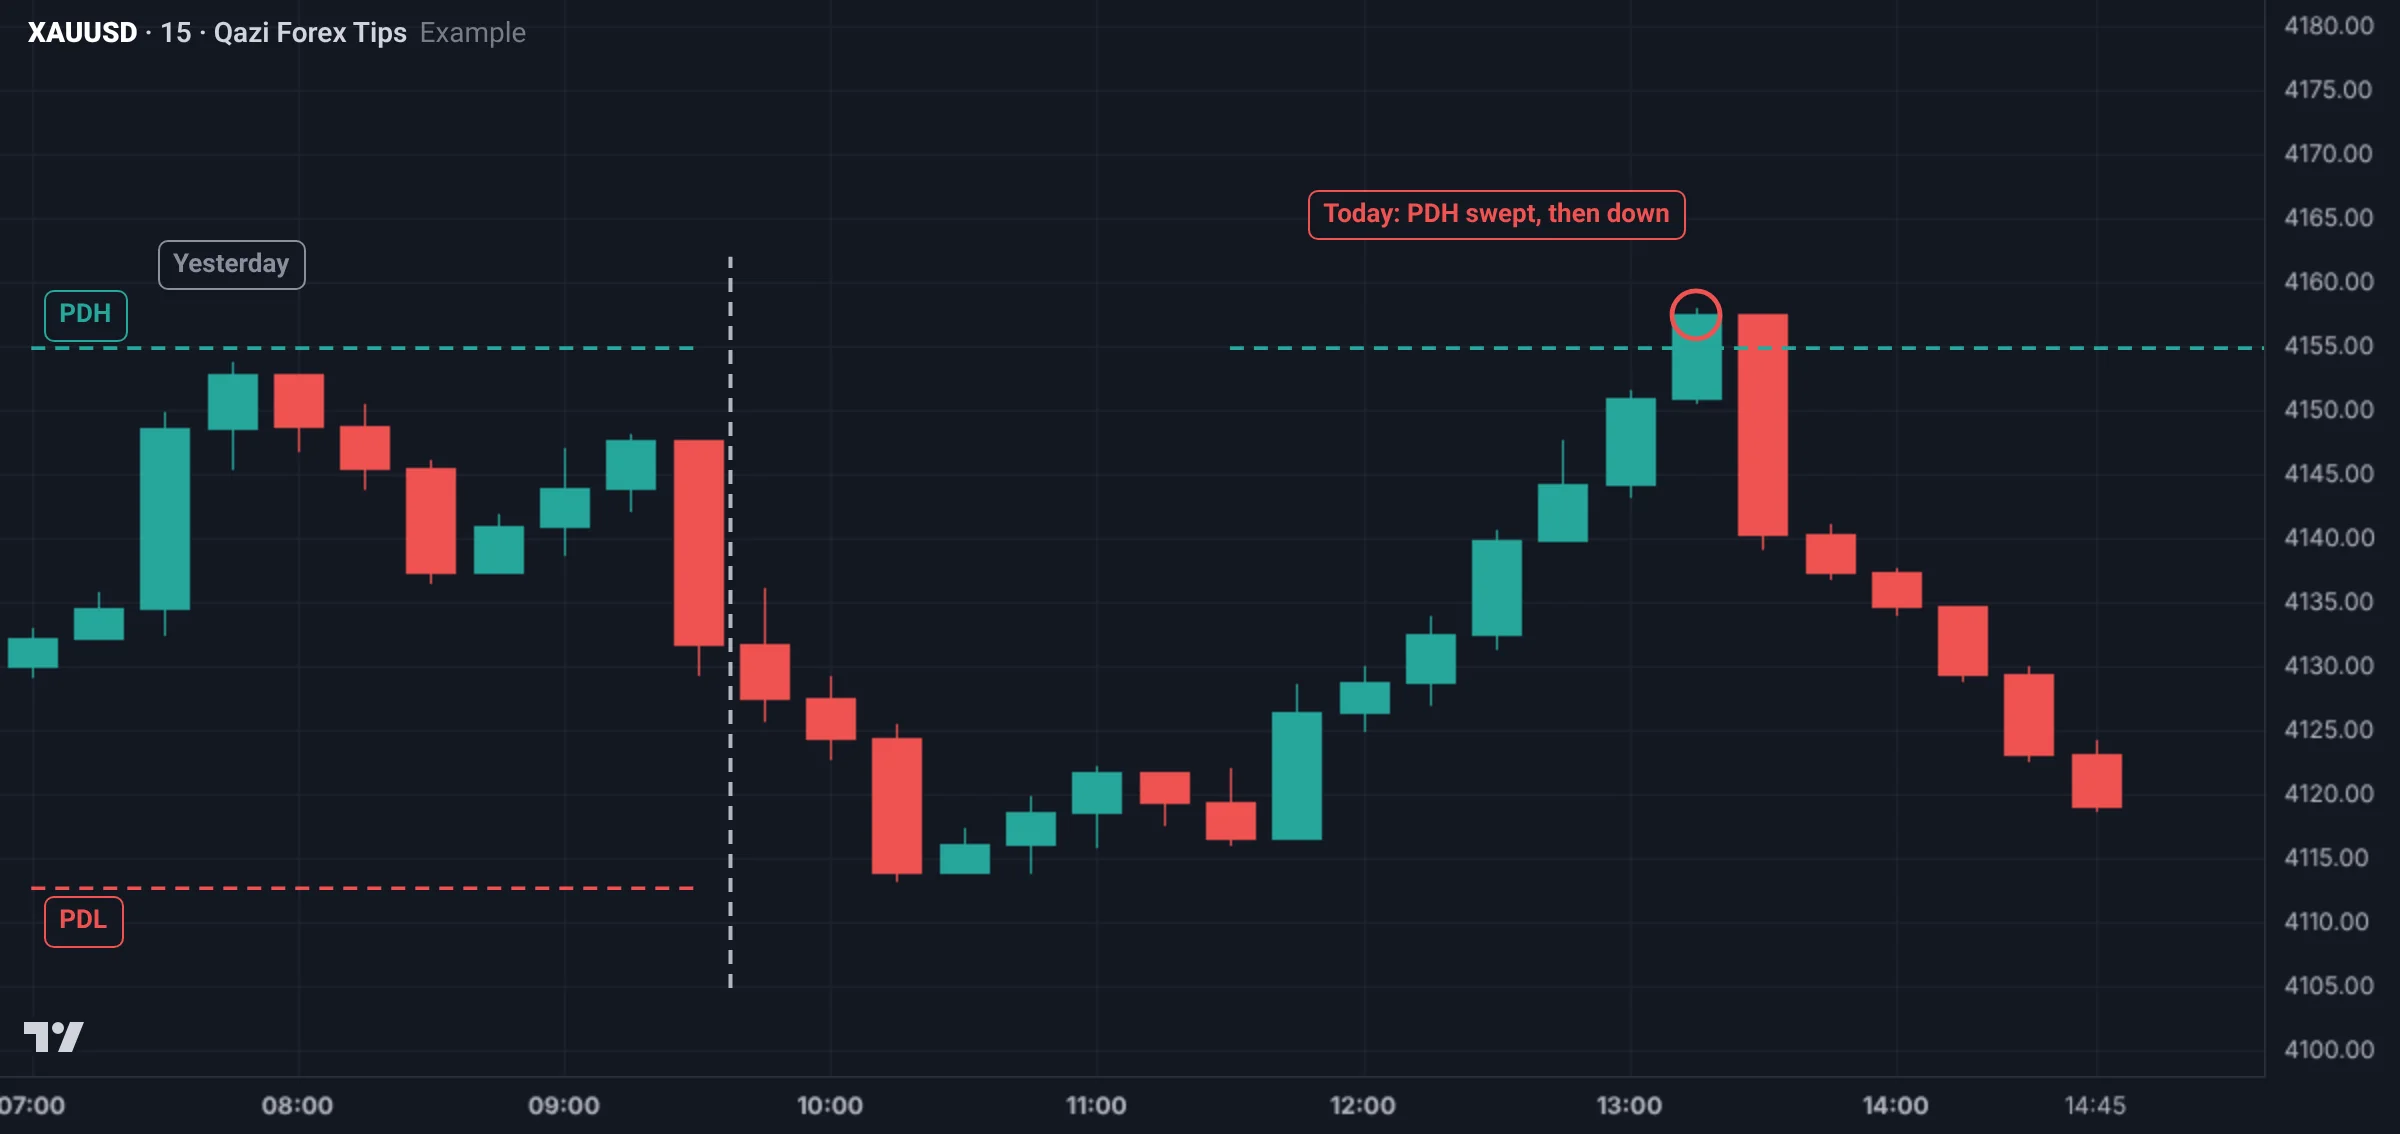
Almost every intraday trader sees yesterday's high and low. Whether price reaches one of them today is the big question of the day.
How to use PDH and PDL
- At the start of every day, draw PDH, PDL and the Asian range.
- Check the higher timeframe bias: with a bullish bias PDH is the target and a sweep of PDL is a buying opportunity; with a bearish bias, the opposite.
- If PDH or PDL is swept, wait for a lower timeframe CHoCH.
- If price closes above PDH with a strong body and holds there, treat it as a break, not a sweep. The next target may then be PWH.
Weekly liquidity
Monday often builds a narrow range. Moves toward PWH or PWL in the middle of the week are common. A typical pattern: early in the week one side's liquidity (for example PWL) is taken, and the rest of the week travels toward the other side (PWH). For a swing trader, PWH and PWL are the best target candidates.
A 10-minute morning routine
- D1 and H4: write the bias, bullish or bearish.
- Lines: draw PDH, PDL, PWH, PWL and the Asian high and low.
- Target: which clean liquidity is nearest in the direction of the bias?
- Sweep zone: which liquidity against the bias could be taken first?
- One line: "Bias bullish; watching for a London sweep of the Asian low; target PDH."
A Gold example
Suppose H4 is bullish. Yesterday's high (PDH) is 4,152.00 and low (PDL) 4,118.00. The Asian range was 4,128.00 to 4,136.00.
- As London opens, price drops to 4,125.40, below the Asian low, and the M15 candle closes at 4,129.10: a sweep.
- A bullish CHoCH forms on M5, with a pullback near 4,130.00. Buy there with the stop at 4,124.40 (below the wick): 5.6 dollars of risk.
- Target slightly before PDH at 4,150.50: 20.5 dollars, about 1:3.6.
- If London had instead closed strongly above the Asian high and held, that would be a break, and this buy plan would be dropped for a fresh picture.
Real Gold chart examples
Gold M15 on 27 Oct 2026 (data: Dukascopy, bid price; Pakistan time). The previous New York day (26 Oct) had a high of 4,029.7 (PDH) and a low of 3,988.5 (PDL):
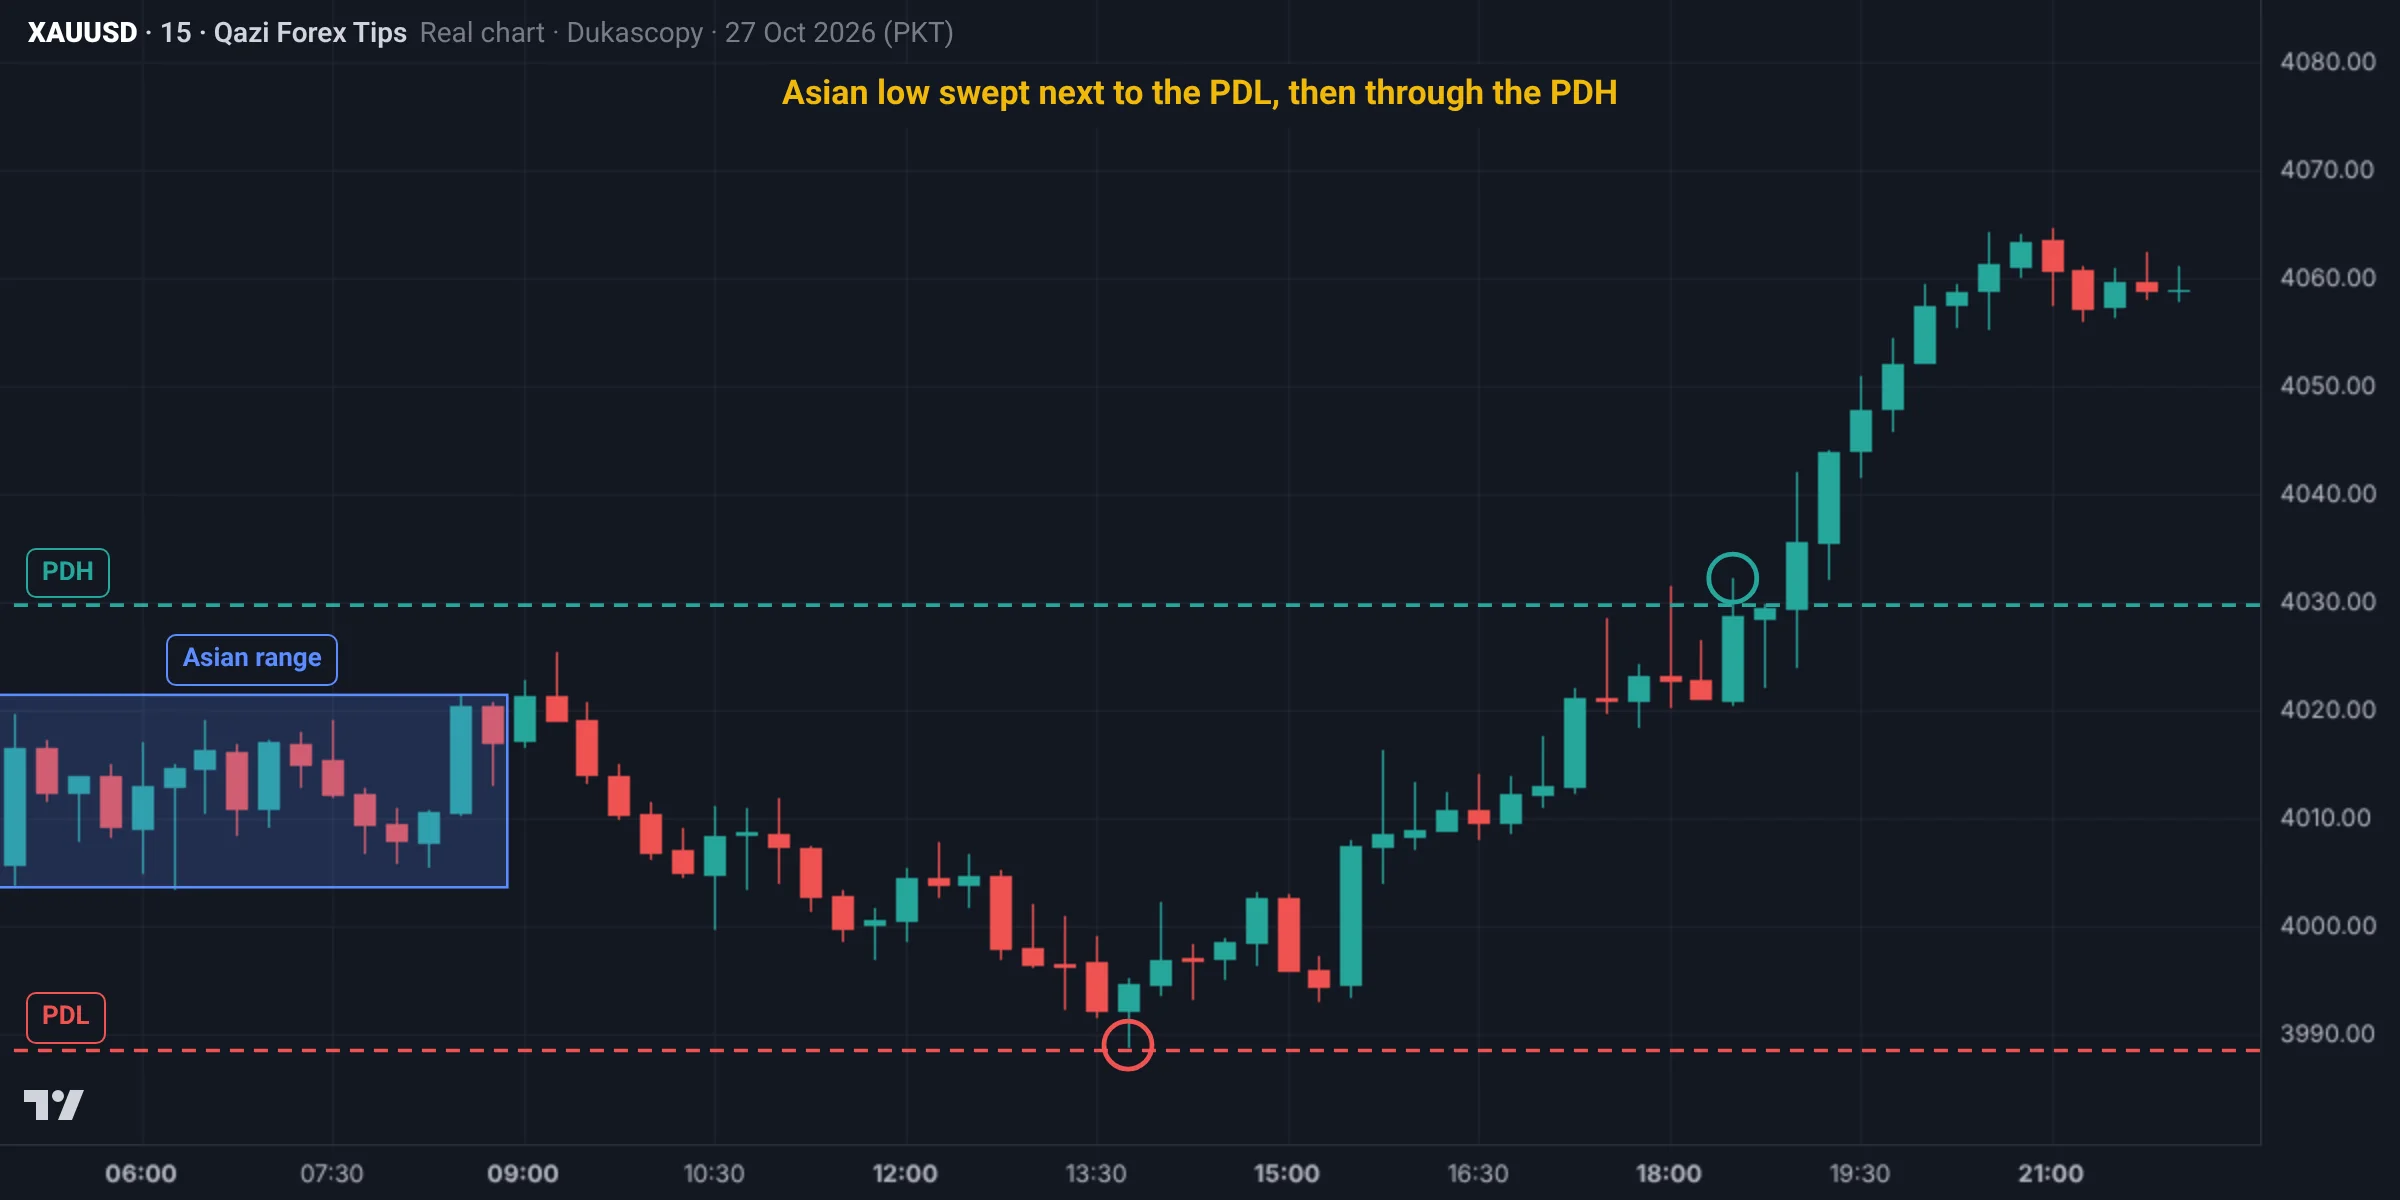
- Asian range: 4,003.6 to 4,021.4.
- London: the Asian low was swept and price reached 3,989.0, just $0.5 above the PDL. Two liquidity levels (the Asian low and PDL) sat in the same place.
- New York: around 18:30 price broke above the PDH at 4,029.7, and reached 4,064.5 by night.
Draw these four lines every morning: Asian high, Asian low, PDH and PDL. On this day those four lines told the whole story.
Second example: the Asian low and PDL break (30 Oct)
Gold H1 on 30 Oct 2026 (data: Dukascopy, bid price; Pakistan time). The previous day (29 Oct, New York day) had a high of 4,046.2 (PDH) and a low of 3,990.2 (PDL):
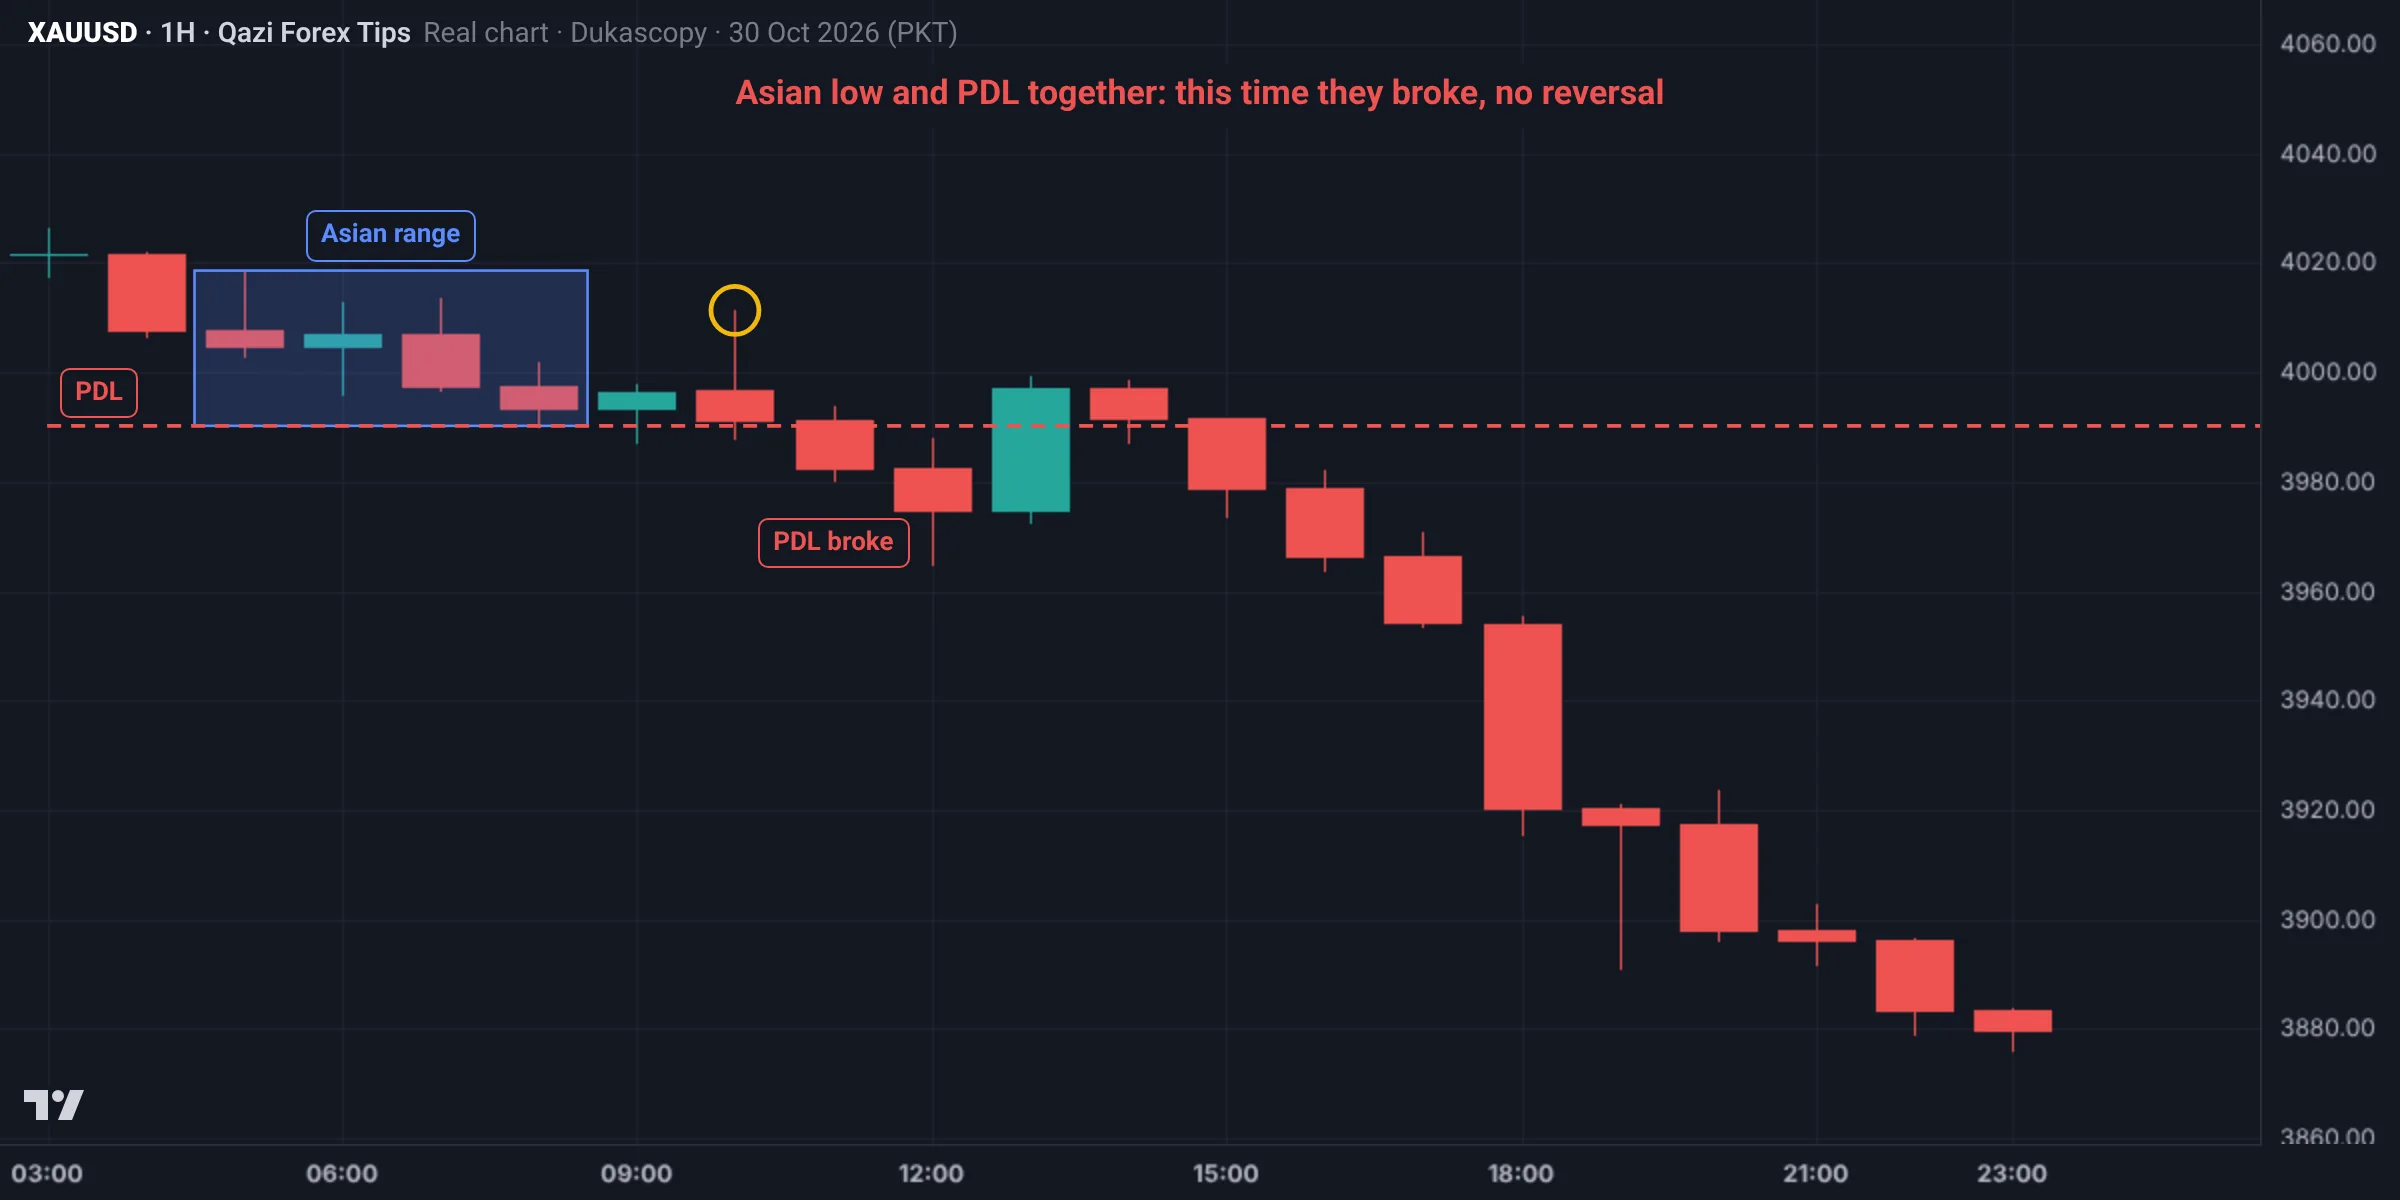
- Asian range (05:00 to 09:00): 3,990.2 to 4,018.6. The Asian low and the PDL were almost the same level.
- Before London: at 10:00 price rose to 4,011.3 but stopped far below the PDH and turned there.
- London: the 11:00 candle closed at 3,982.7, below both the Asian low and the PDL, and price did not come back.
- New York: a sharp drop in the evening, to 3,876.1 by night.
In the first example these levels were swept and price reversed; here they broke and price continued. The difference is the one from lesson 2.4: where the close happened, and whether price came back.
Common mistakes
Summary
- Asian high and low, London high and low, PDH/PDL and PWH/PWL are the most important daily liquidity.
- London often sweeps one edge of the Asian range first, then the real move comes.
- The bias decides which liquidity is the target and which is the sweep zone.
- A 10-minute morning routine gives you the whole day's plan.
Try this lesson on your own chart
Qazi Forex Tips' own tools that make this lesson easier. A tool helps; your rules make the decision.
QFT Sessions & Killzones indicator
100% free · MT5 & MT4Asia, London and New York sessions, the four ICT killzones and the previous day high and low on your chart, with a Pakistan or India time clock and automatic daylight saving.
Details and downloadSpot it on the chart: practice
This is a real Gold chart (Dukascopy data, Pakistan time). Study it and pick an answer. After you answer, the fully marked chart and the explanation appear.
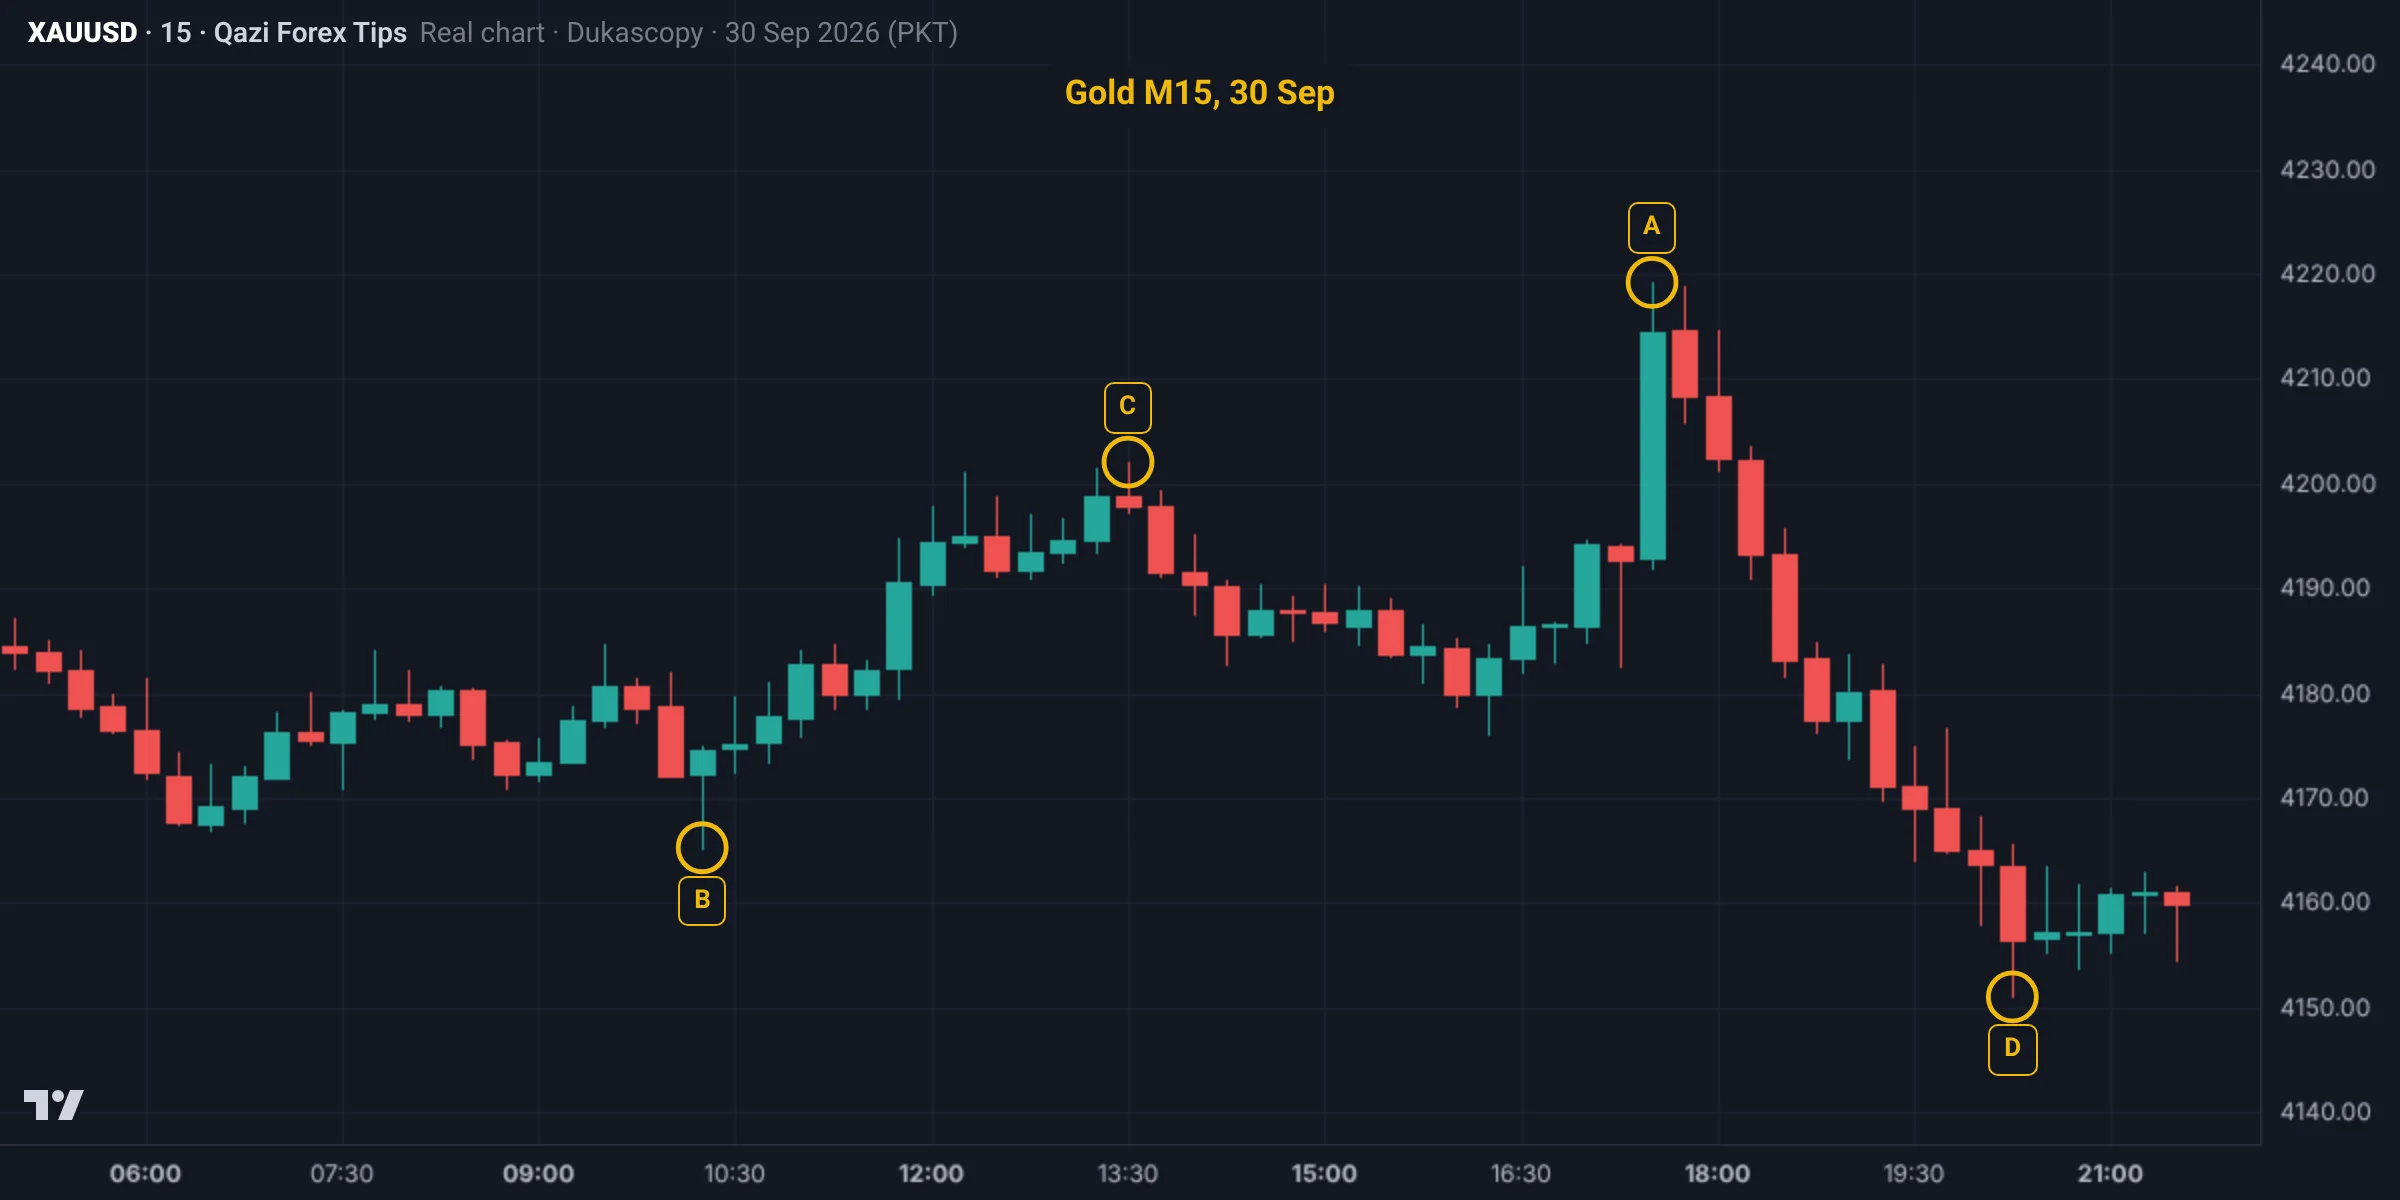
Where on 30 Sep was session liquidity swept, with price reversing afterwards?
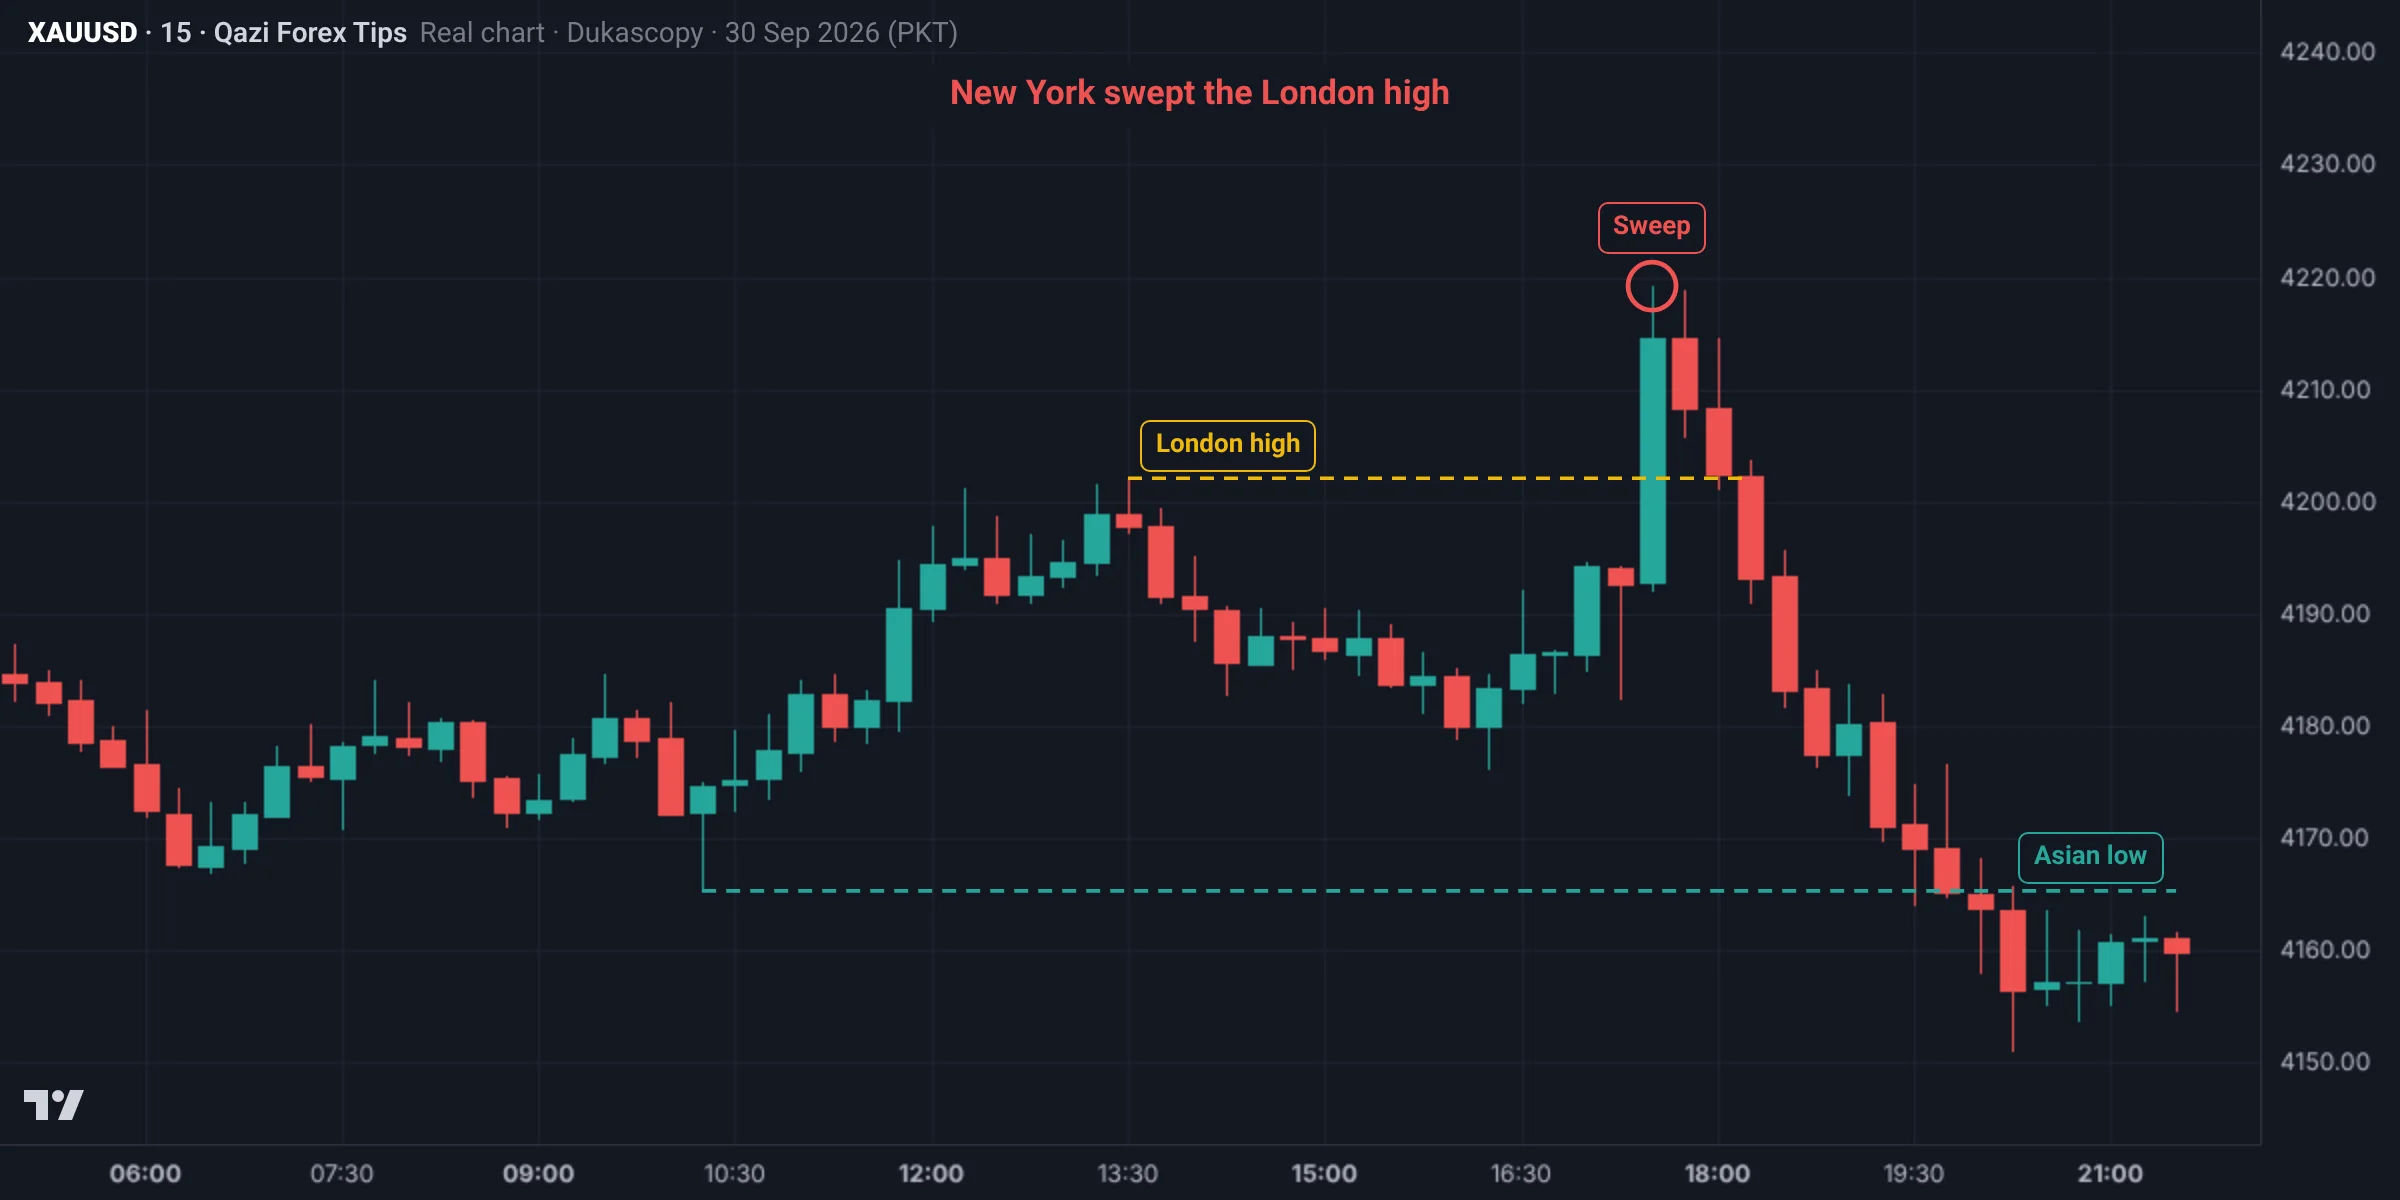
The London high was 4,202.0. At the New York open the 17:30 candle reached 4,219.2 (A), taking the stops above the London high, and by 18:15 price had closed back below. Gold then broke the Asian low at 4,165.3 too and fell to 4,151.0. B is the Asian low, which later broke (not a sweep), C is the London high itself, D is part of the drop.
The marked chart
Test yourself: Lesson 2.3 quiz
9 questions. Pick one answer for each and you will see at once whether it is right and why. Your score and grade appear at the end. You need 70% to pass.
0 correct · 0 / 9
Question 1What are PDH and PDL?
Almost every intraday trader watches them, so stops and targets gather there.
Question 2Roughly when is the Asian session in Pakistan time?
Read session times in real time, not broker server time; summer and winter differ by an hour.
Question 3What is the London Judas swing?
Low Asian volume builds a narrow range with stops on both sides.
Question 4H4 is bullish. Which side of the Asian range is London more likely to take first?
Still, don't trade a guess; let the sweep happen and look for a CHoCH.
Question 5Price closes above PDH with a strong body and holds there. How do you treat it?
In a sweep the body comes back inside; here the price was accepted.
Question 6What is a typical weekly liquidity pattern?
PWH and PWL are the best targets for swing traders; Monday often builds a narrow range.
Question 7What does the final line of the 10-minute morning routine look like?
One line with bias, sweep zone and target.
Question 8Why is trading inside the Asian range a mistake?
The Asian range is liquidity for London.
Question 9Gold: PDH 4,152, Asian range 4,128 to 4,136, H4 bullish. In London price hits 4,125.40 and M15 closes 4,129.10. What is the target?
A sweep of the Asian low, an M5 bullish CHoCH, buy near 4,130, stop 4,124.40; RR about 1:3.6.
Lesson checklist
Tick each point once you understand it. Your ticks are saved in this browser.
Assignment
- Open the last 10 days on Gold M15 and draw each day's Asian range, PDH and PDL.
- For each day, write which edge of the Asian range London took first and which way the day went after that.
- Count how many days price touched PDH or PDL, and how many of those were sweeps versus breaks.
- For the next 5 days, write a one-line plan every morning and the result at the end of the day.
- Post your table in the group.
Post your assignment screenshots with your reasons in our free Facebook group, where your charts will be checked.
Join the free group
Who wrote this lesson
Dr. Qazi Abdul Basit, Ph.D
Ph.D in Business Administration and a forex and Gold trader since 2013. Founder of Qazi Forex Tips, which teaches traders in Pakistan and India price action, risk management and trading psychology in their own language: 65 student batches so far, free courses on YouTube, and MT5 tools for traders (QFT Replay Simulator, QFT Trade Assistant).
- 2013 trading since
- 75K+ Facebook group members
- 65 student batches
- 15K+ YouTube subscribers
How this lesson was made: the content follows Dr. Qazi's teaching method and years of trading. Real charts are built from Dukascopy Gold (XAUUSD) data, and backtest results are shown as they came out, even when negative. We do not sell signals, manage accounts or take money from any broker. Last updated: 19 November 2026.
Questions
What are PDH and PDL?
The previous day's high and low, key intraday liquidity levels and targets.
Why is the Asian range important?
Stops build up above and below it, and London often sweeps one edge soon after it opens.
How do I tell a PDH sweep from a break?
In a sweep the wick goes above and the body closes back below; in a break a strong body closes above and holds.
What is the London Judas swing?
Price taking one side's liquidity at the London open before moving in the day's real direction.
Which lines should I draw every morning?
PDH, PDL, PWH, PWL and the Asian high and low, plus a one-line bias and plan.
When does the forex market open and close in Pakistan?
The week opens at 5 pm New York time on Sunday: 03:00 on Monday in Pakistan in winter, 02:00 in summer. It closes at 5 pm New York on Friday: 03:00 (winter) or 02:00 (summer) on Saturday in Pakistan. Gold usually opens an hour later; your broker's times may differ slightly.
What is the Asian session time in Pakistan?
ICT's Asian killzone (8 pm to midnight New York) is 06:00 to 10:00 in Pakistan in winter and 05:00 to 09:00 in summer. The range made in that window is the Asian range.
Read more
Education only, not financial advice. Trading forex, Gold and CFDs carries a high risk of loss. SMC concepts describe tendencies, not guarantees. Lesson 14 of 38.