 Qazi Forex Tips

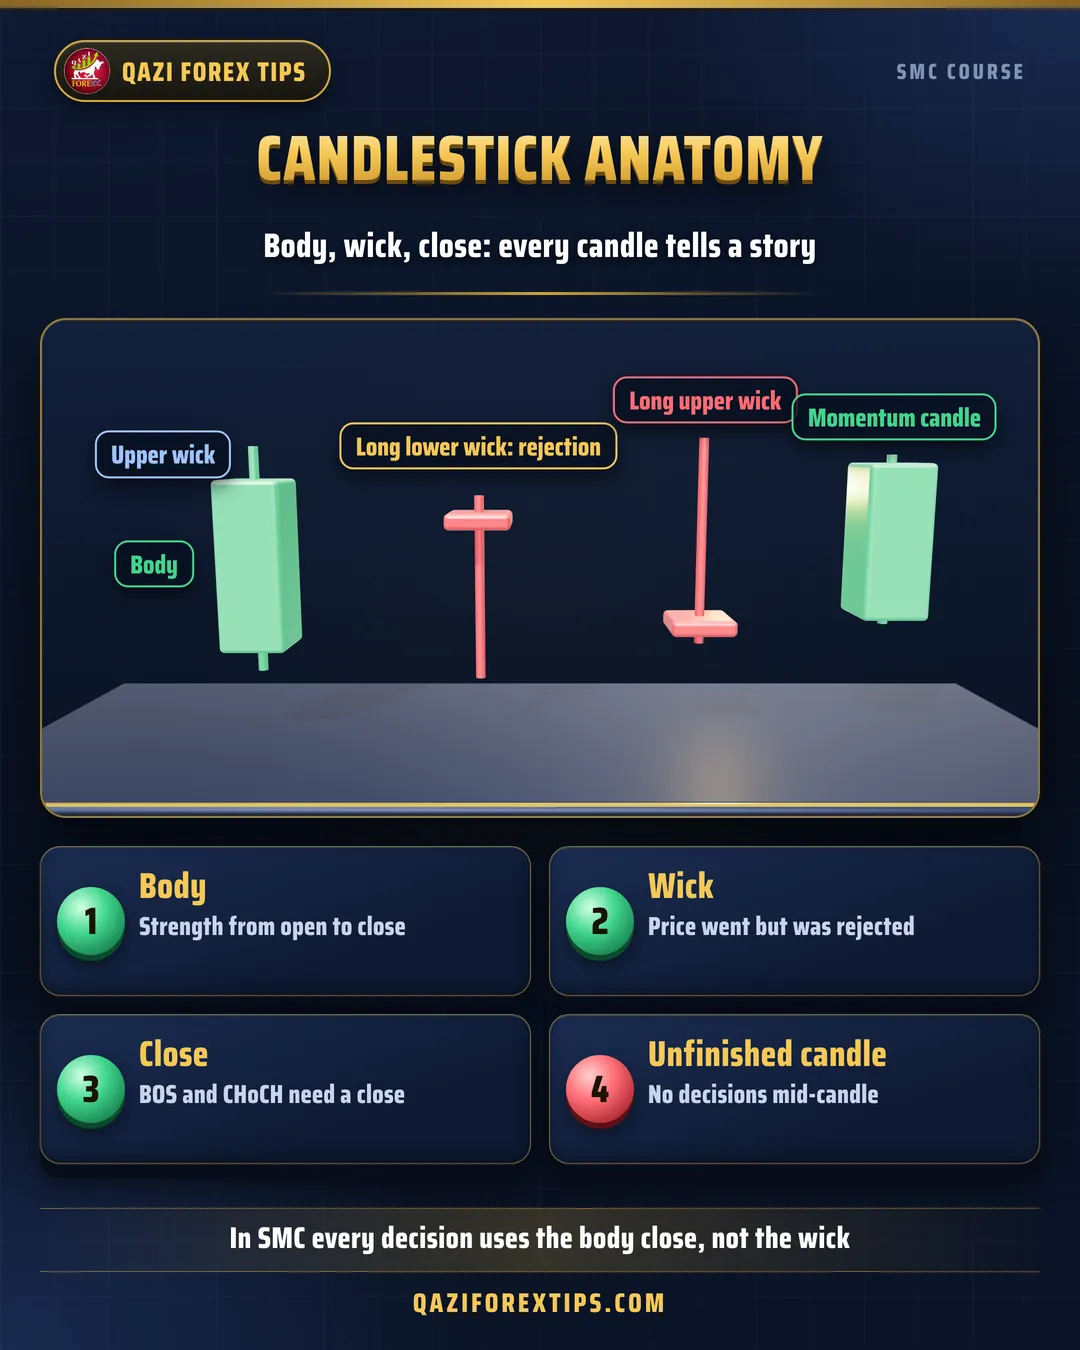
What does one candle tell you?
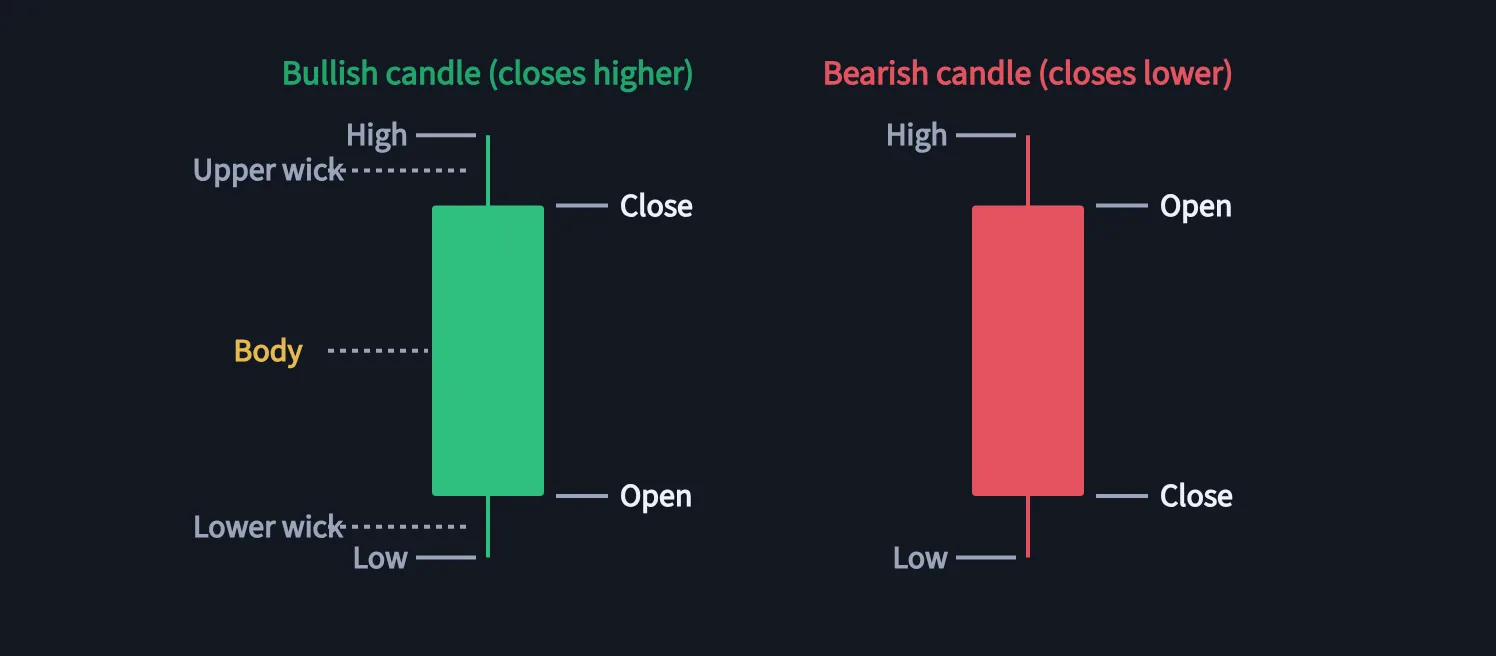
Each candle is the story of one slice of time (one hour on H1, for example). It has four numbers:
- Open: the price at the start of that time
- Close: the price at the end of that time
- High: the highest price during that time
- Low: the lowest price during that time
If the close is above the open the candle is bullish (usually green); if it is below, the candle is bearish (usually red).
What the body and wick mean
- The body shows whose pressure won in the end. A big body means a strong decision in one direction.
- The wick shows that price went there but was not accepted. A long upper wick means selling came in above; a long lower wick means buying came in below.
Three candles you must recognise
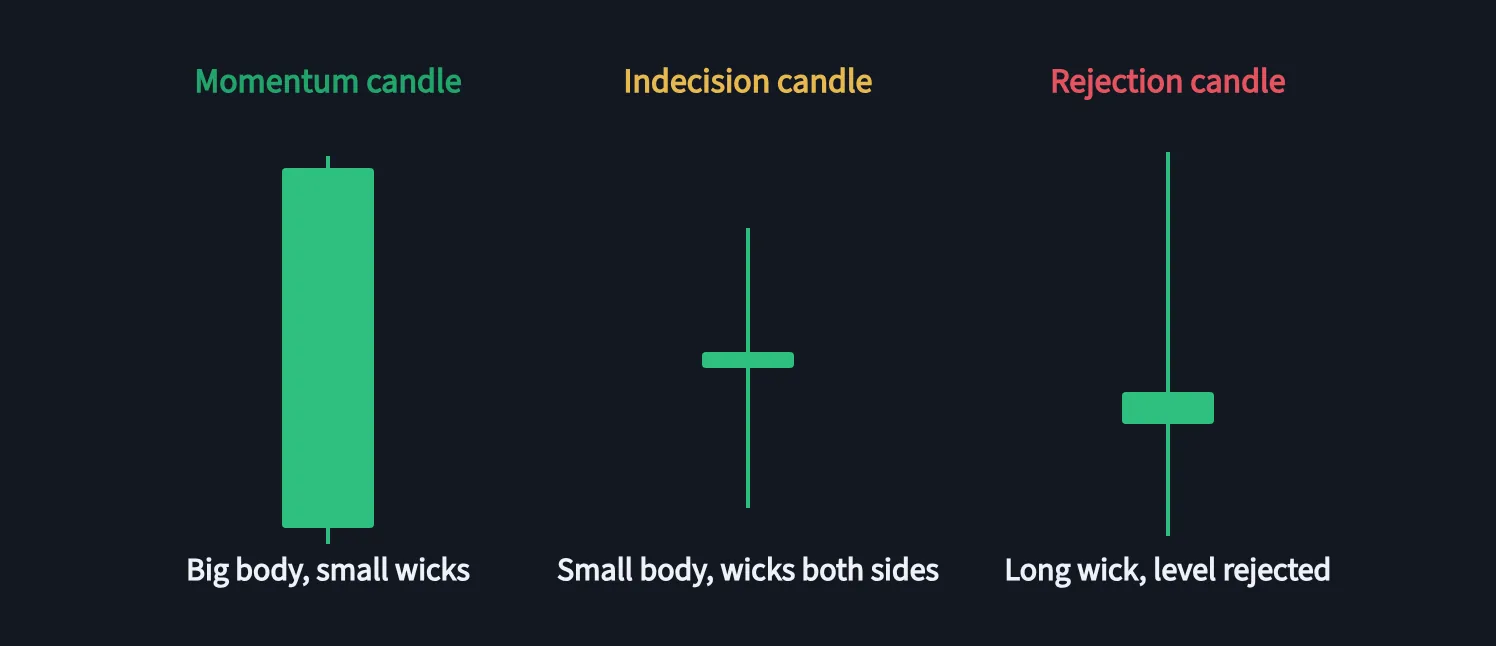
1. Momentum candle
- The body is at least 70 percent of the whole candle, with small wicks.
- Clearly bigger than the surrounding candles.
- Meaning: a fast, strong decision by one side. In SMC this is called displacement, and order blocks and FVGs form with it.
2. Indecision candle
- Small body, wicks on both sides.
- Meaning: buyers and sellers are balanced and no decision was made. Common in ranges and near levels.
3. Rejection candle
- A very long wick on one side, with the body near the opposite end.
- Meaning: price went one way but was pushed back. At a level or a liquidity sweep it is an important signal.
The story of candles at a level
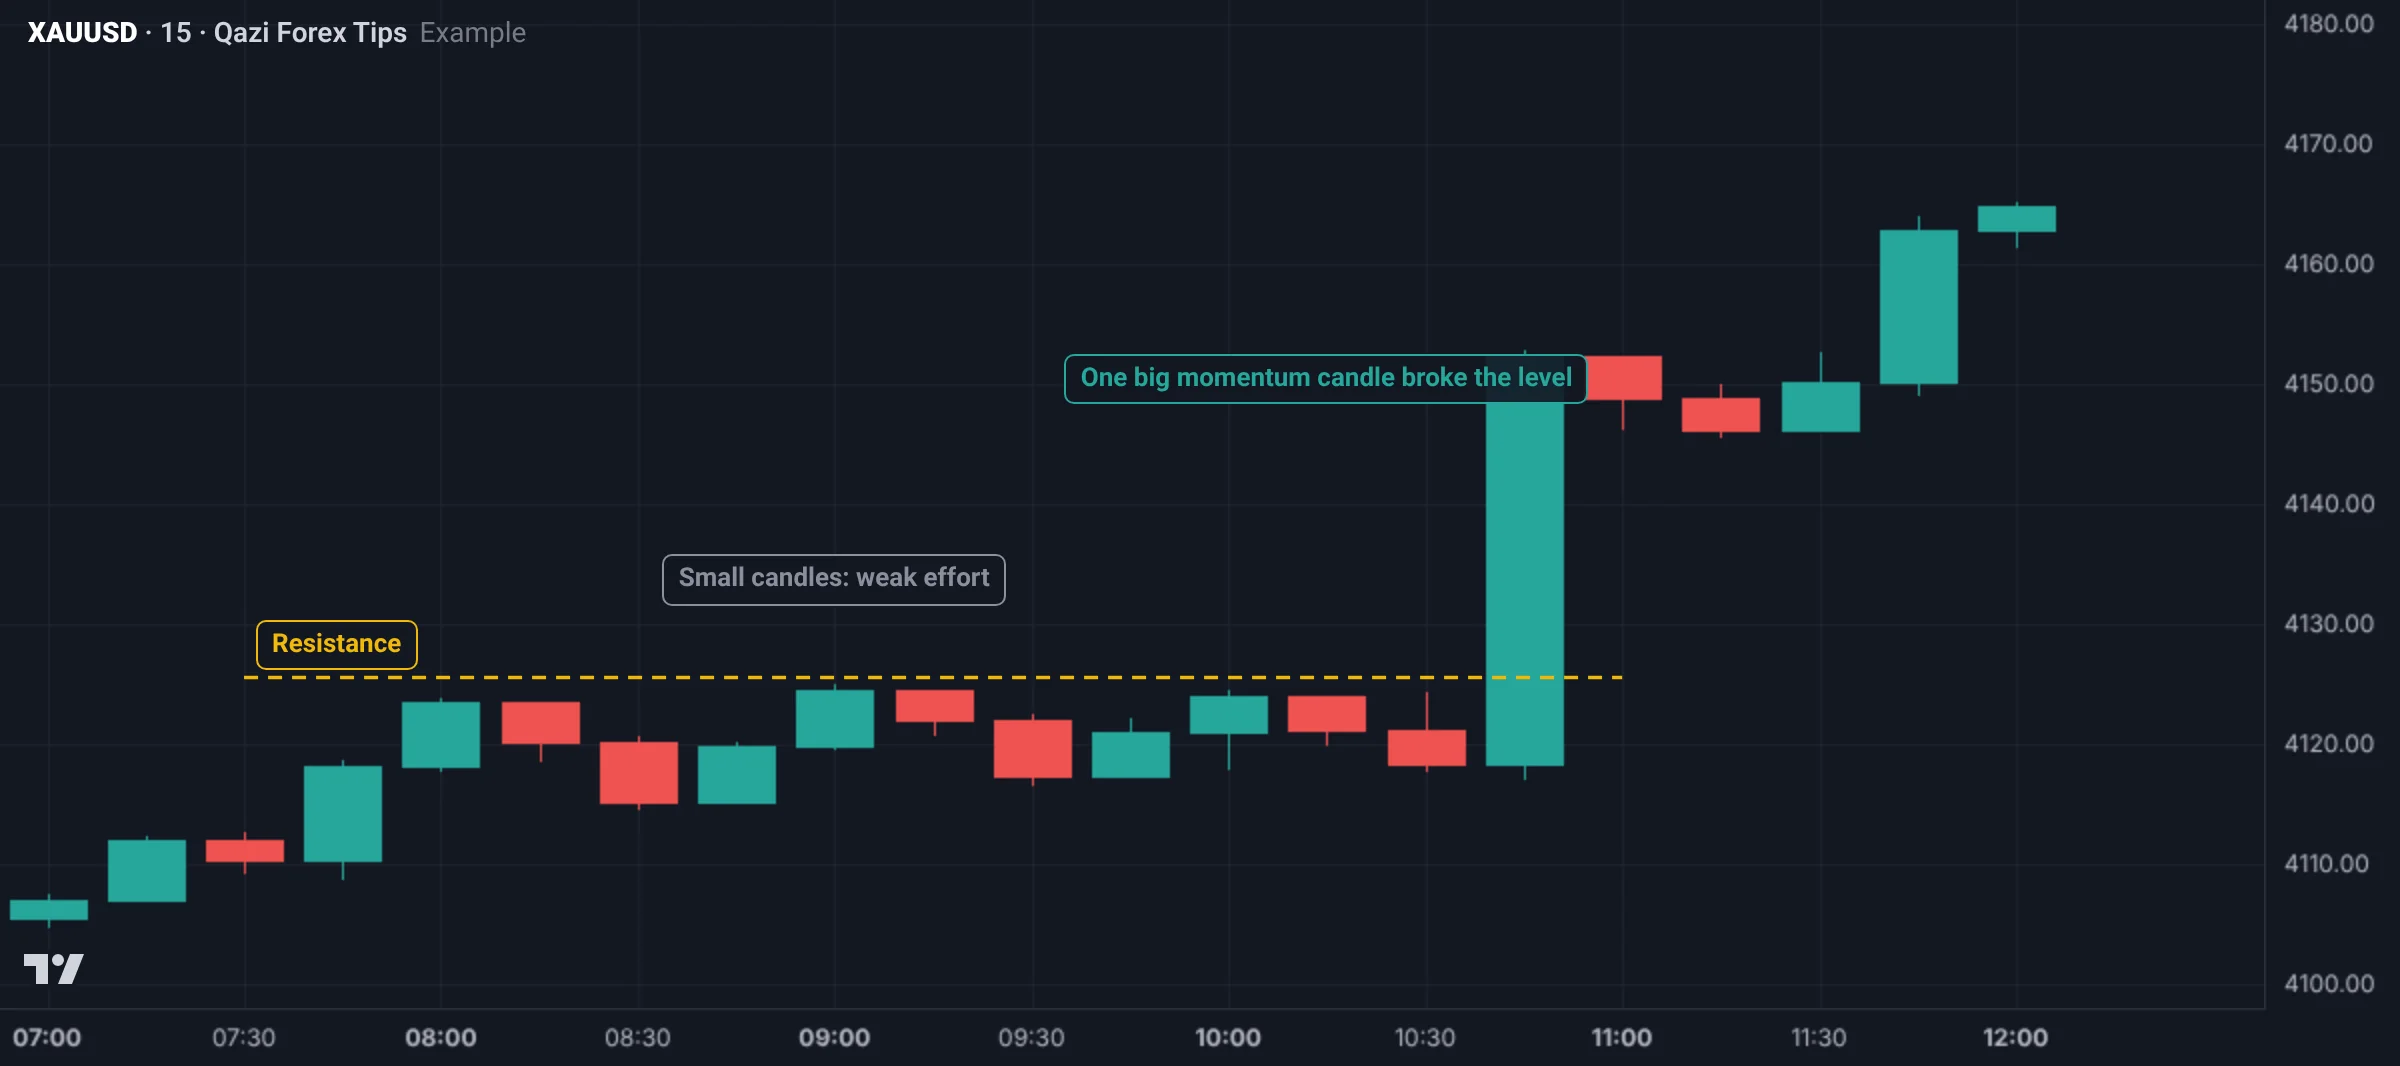
Never decide from one candle. Read the sequence: how price arrived at the level and what happened there.
| What you see at the level | What it often means |
|---|---|
| Small candles, repeated touches | The level is weakening |
| Long rejection wicks | The level is being defended |
| A momentum candle closes beyond the level | A break is more likely |
| Wick beyond, body back inside | A sweep; a reversal is possible |
Candles across timeframes
One H4 candle contains four H1 candles. That is why one rejection candle on a higher timeframe is a complete sweep and reversal on a lower timeframe. This idea returns in the multi-timeframe lesson.
The four numbers of a candle: OHLC
Every candle is made of just four numbers: Open, High, Low, Close. For example, one Gold M15 candle:
| Number | Price | Meaning |
|---|---|---|
| Open | 4,128.40 | Where the candle started |
| High | 4,135.90 | The highest price in those 15 minutes |
| Low | 4,127.10 | The lowest price in those 15 minutes |
| Close | 4,134.80 | Where the candle closed |
- The close is above the open, so this is a bullish (green) candle.
- Body = close − open = 6.4 dollars. Full range = high − low = 8.8 dollars.
- The body is about 73% of the range, so this is a momentum candle.
- The upper wick is only 1.1 dollars: buyers closed the candle close to its high.
Body ratio: judge a candle with numbers
Besides your eyes, keep a simple yardstick:
| Body as part of the full range | Candle type | Meaning |
|---|---|---|
| 70% or more | Momentum candle | Strong control by one side |
| 30% to 70% | Normal candle | Balance, some push from both sides |
| Below 30% | Indecision or rejection | No decision, or one side's price rejected |
If one wick is twice the body or longer, treat it as a rejection: price went there but was not accepted.
Strong moves and weak pullbacks
This difference is very useful in SMC. In the real move (impulse) candles are big, bodies are long and wicks are small. In the pullback candles are small, overlapping and mixed in colour.
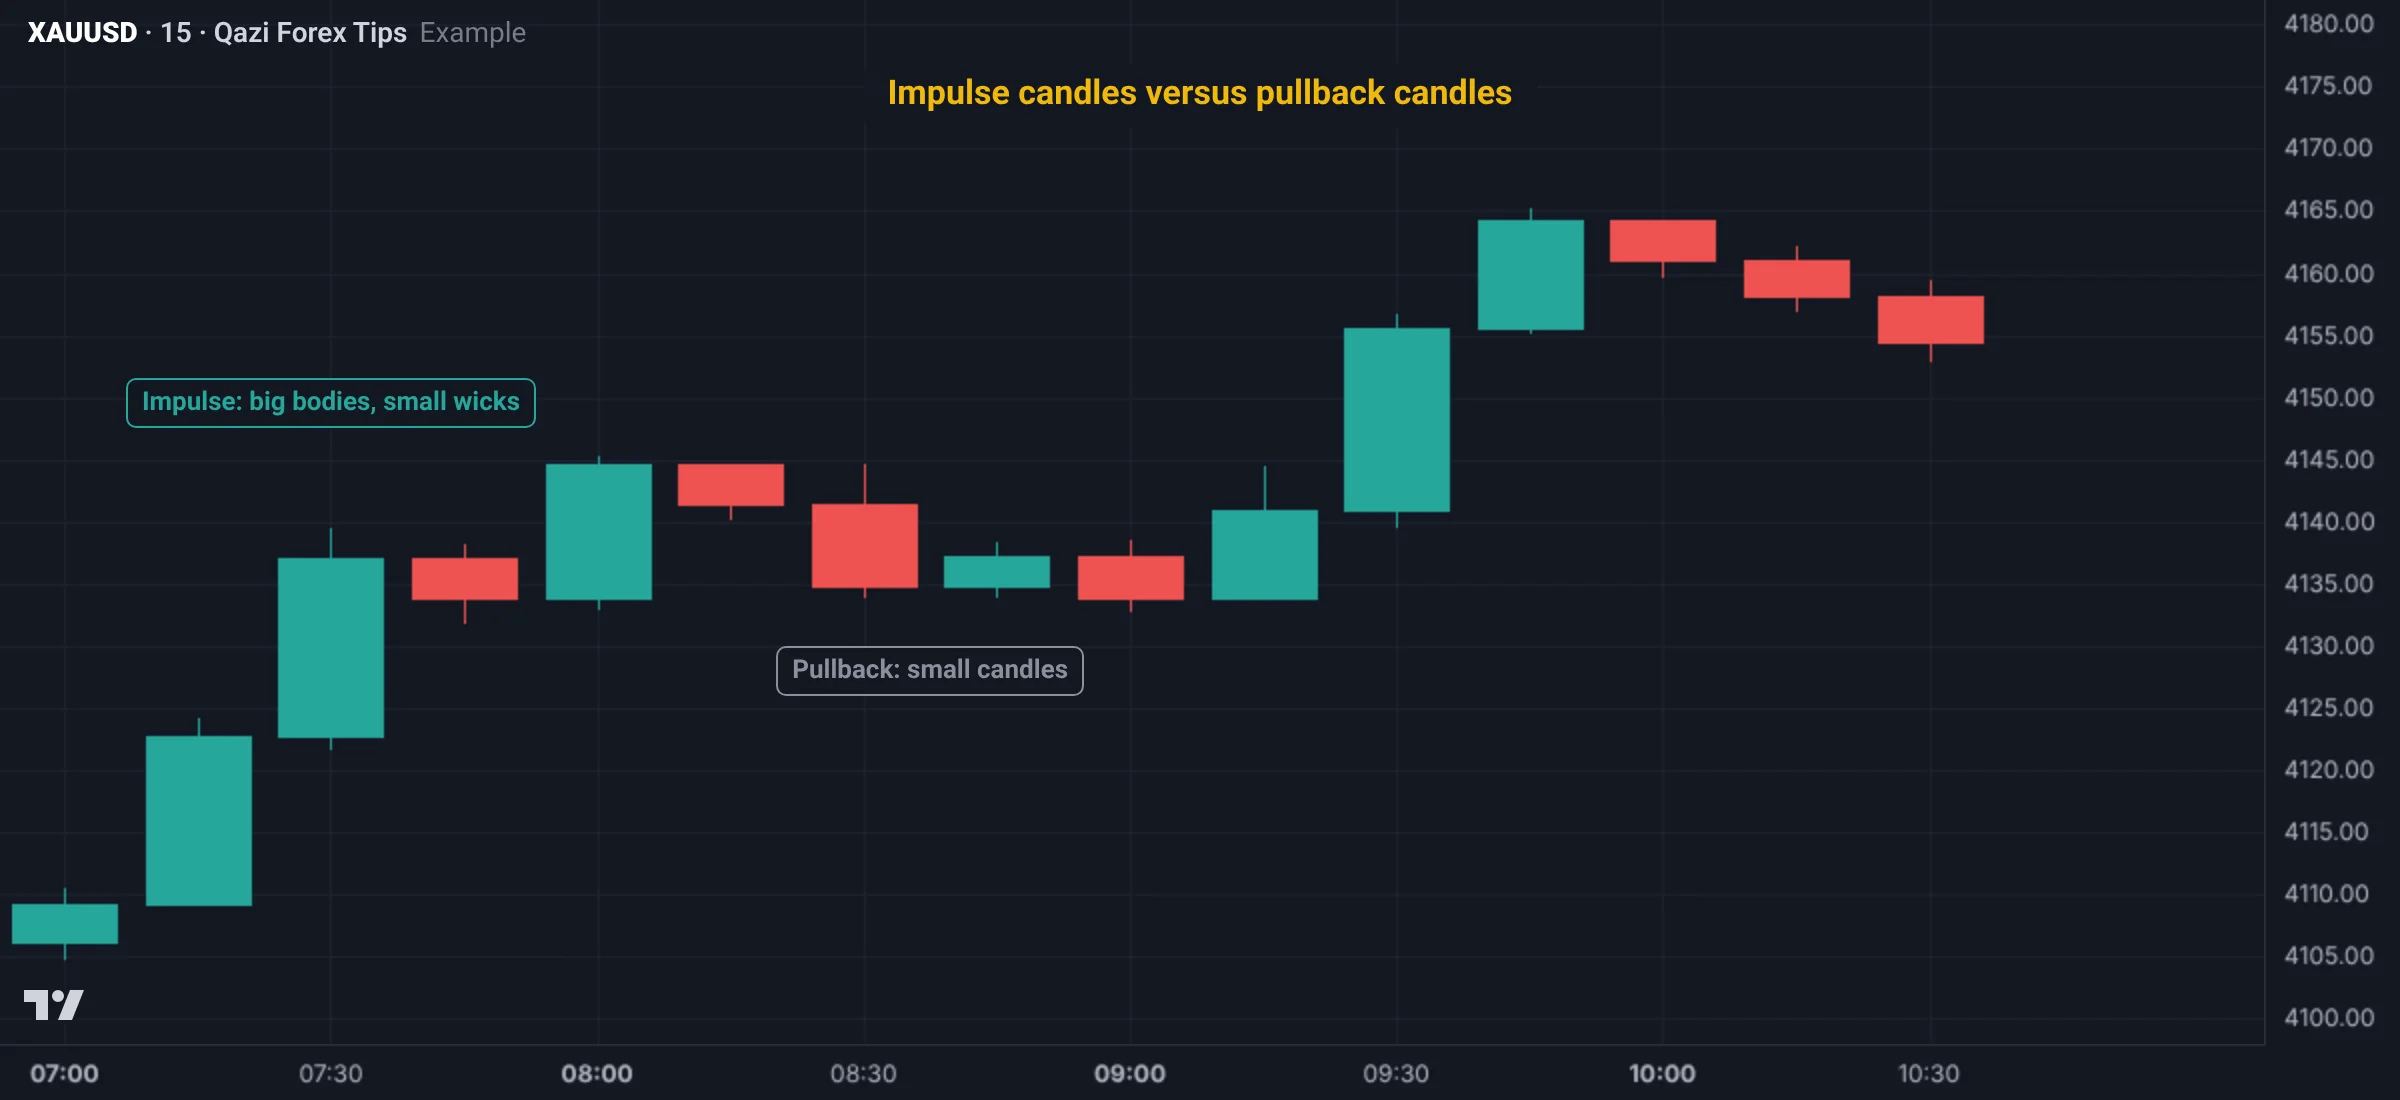
When big momentum candles suddenly appear inside a pullback, it may not be a pullback any more; the trend may be changing. The CHoCH lesson covers this in detail.
Why waiting for the close matters
While a candle is forming, it can still become anything. An M15 candle can look like a big green momentum candle for 10 minutes and, in the last 5, give everything back and become a long-wicked rejection candle. That is why every SMC decision on BOS, CHoCH and sweeps is made after the candle closes.
- An H1 decision: after the H1 candle closes.
- An M15 decision: after the M15 candle closes.
- Only a trader with a written plan and confirmation enters on a forming candle.
A big candle is made of small candles
One H1 candle is four M15 candles: its open is the first M15 open, its close the last M15 close, and its high and low the highest and lowest of the four. So a long H1 wick is often a full move on M15: price went and came back. This will matter a lot in the sweep lesson.
Real Gold chart examples
Gold H1 on 4 Nov 2026 (data: Dukascopy, bid price; Pakistan time):
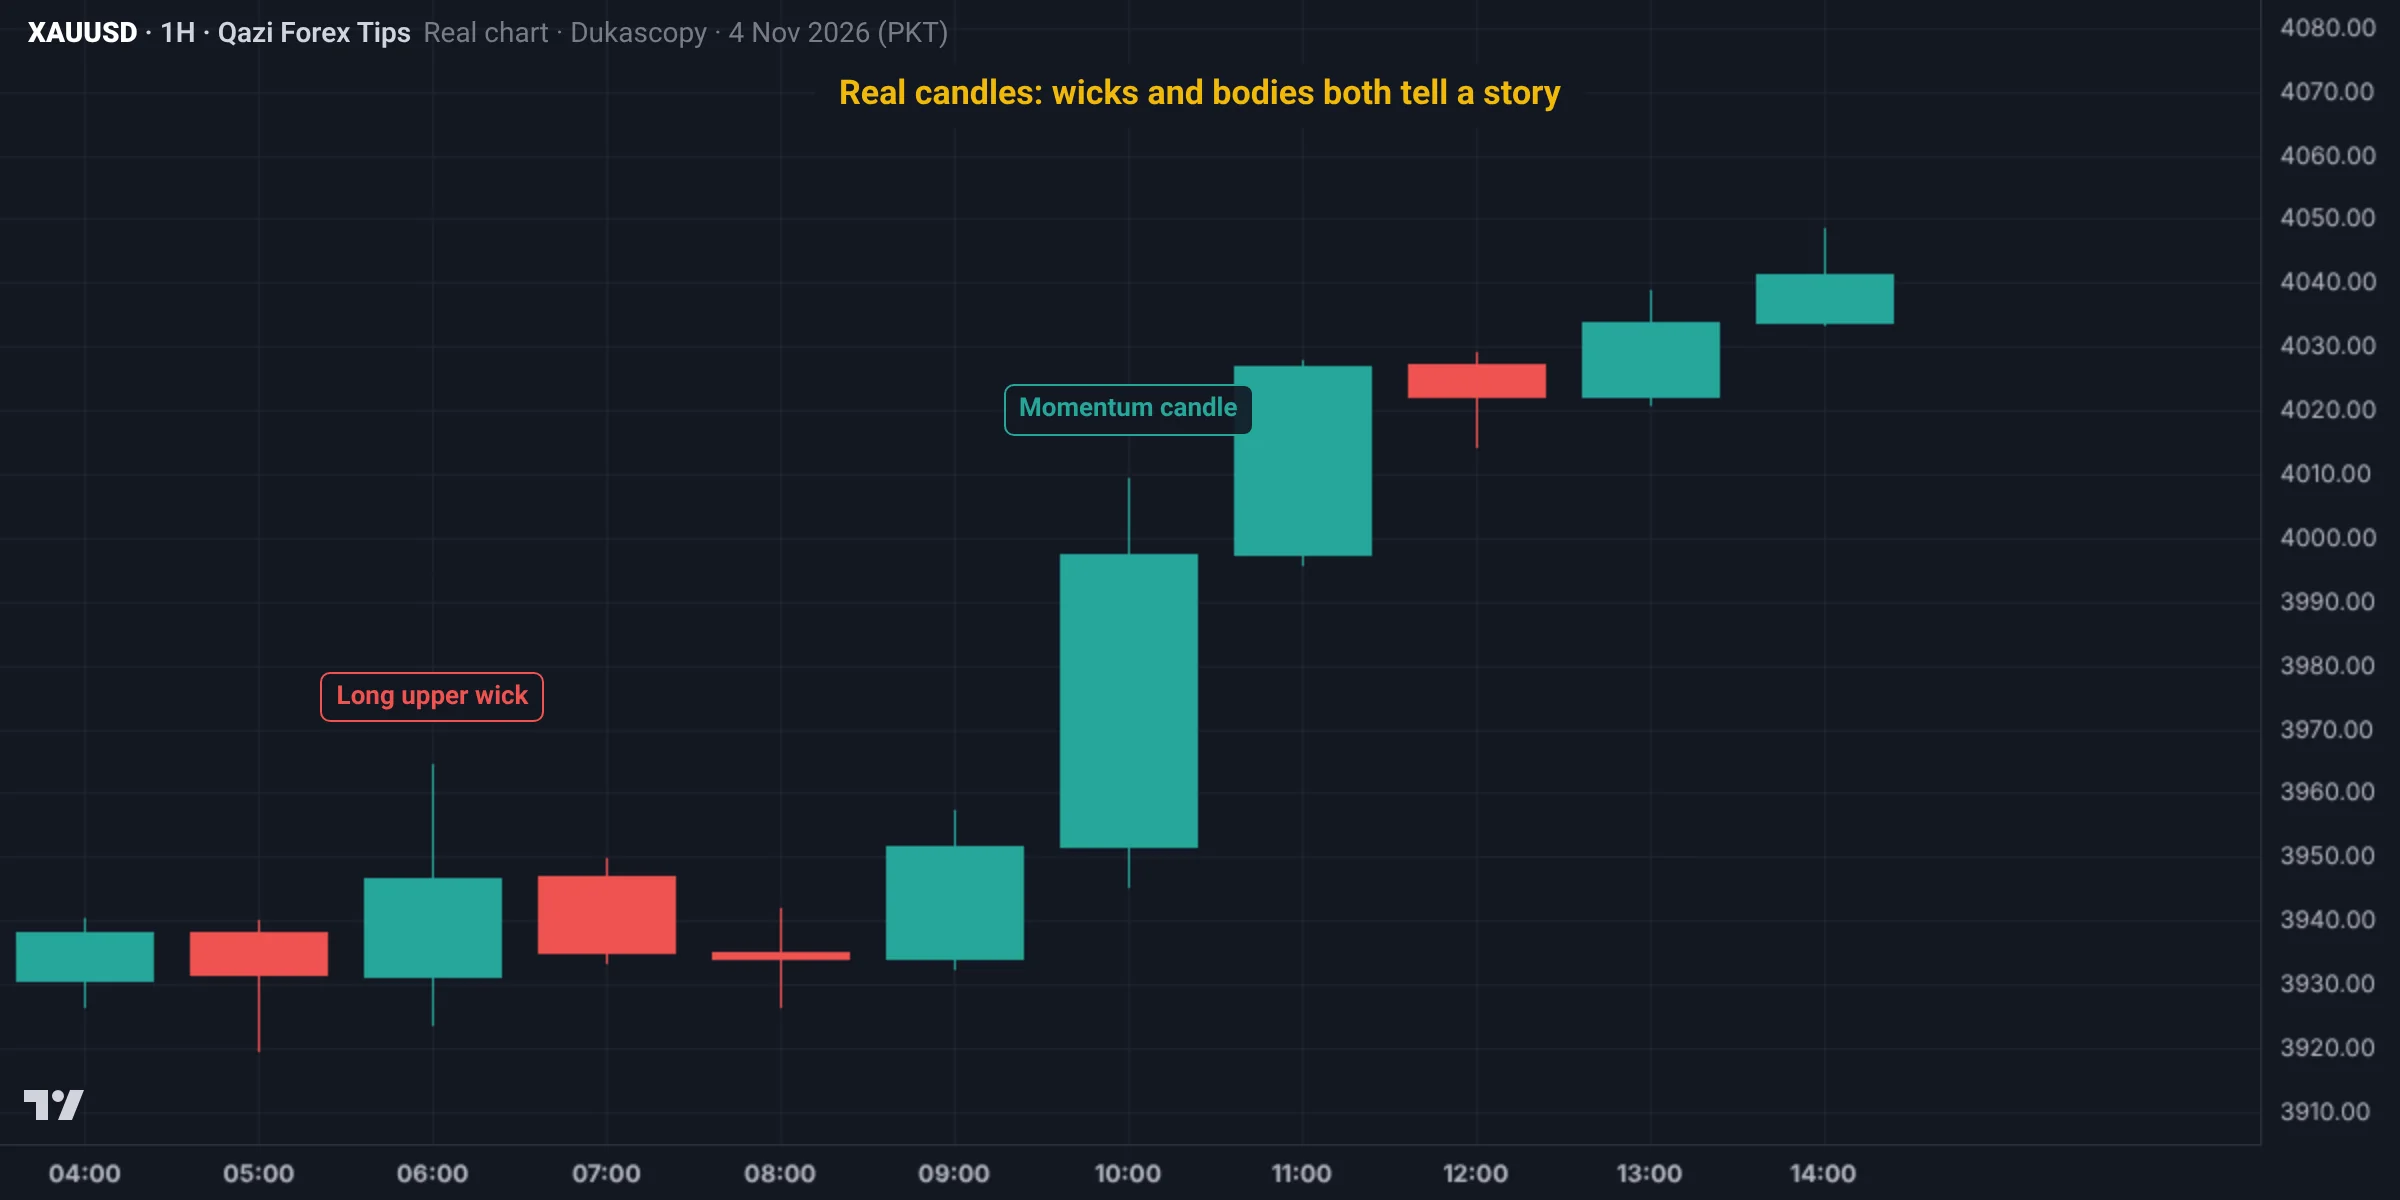
- The 06:00 candle: open 3,931.4, high 3,964.6, low 3,923.9, close 3,946.6. Price reached 3,964 but could not hold; the $18 upper wick shows sellers were waiting above.
- The 10:00 candle: open 3,951.7, close 3,997.5, a body of about $46. That is a momentum candle: a big body, a close near the high, and the previous high broken.
Always decide on the candle close; the 10:00 candle could have turned while forming, and the close showed buyers won.
Second example: bearish candles (30 Oct)
Gold H1 on 30 Oct 2026 (data: Dukascopy, bid price; Pakistan time), this time in a falling market:
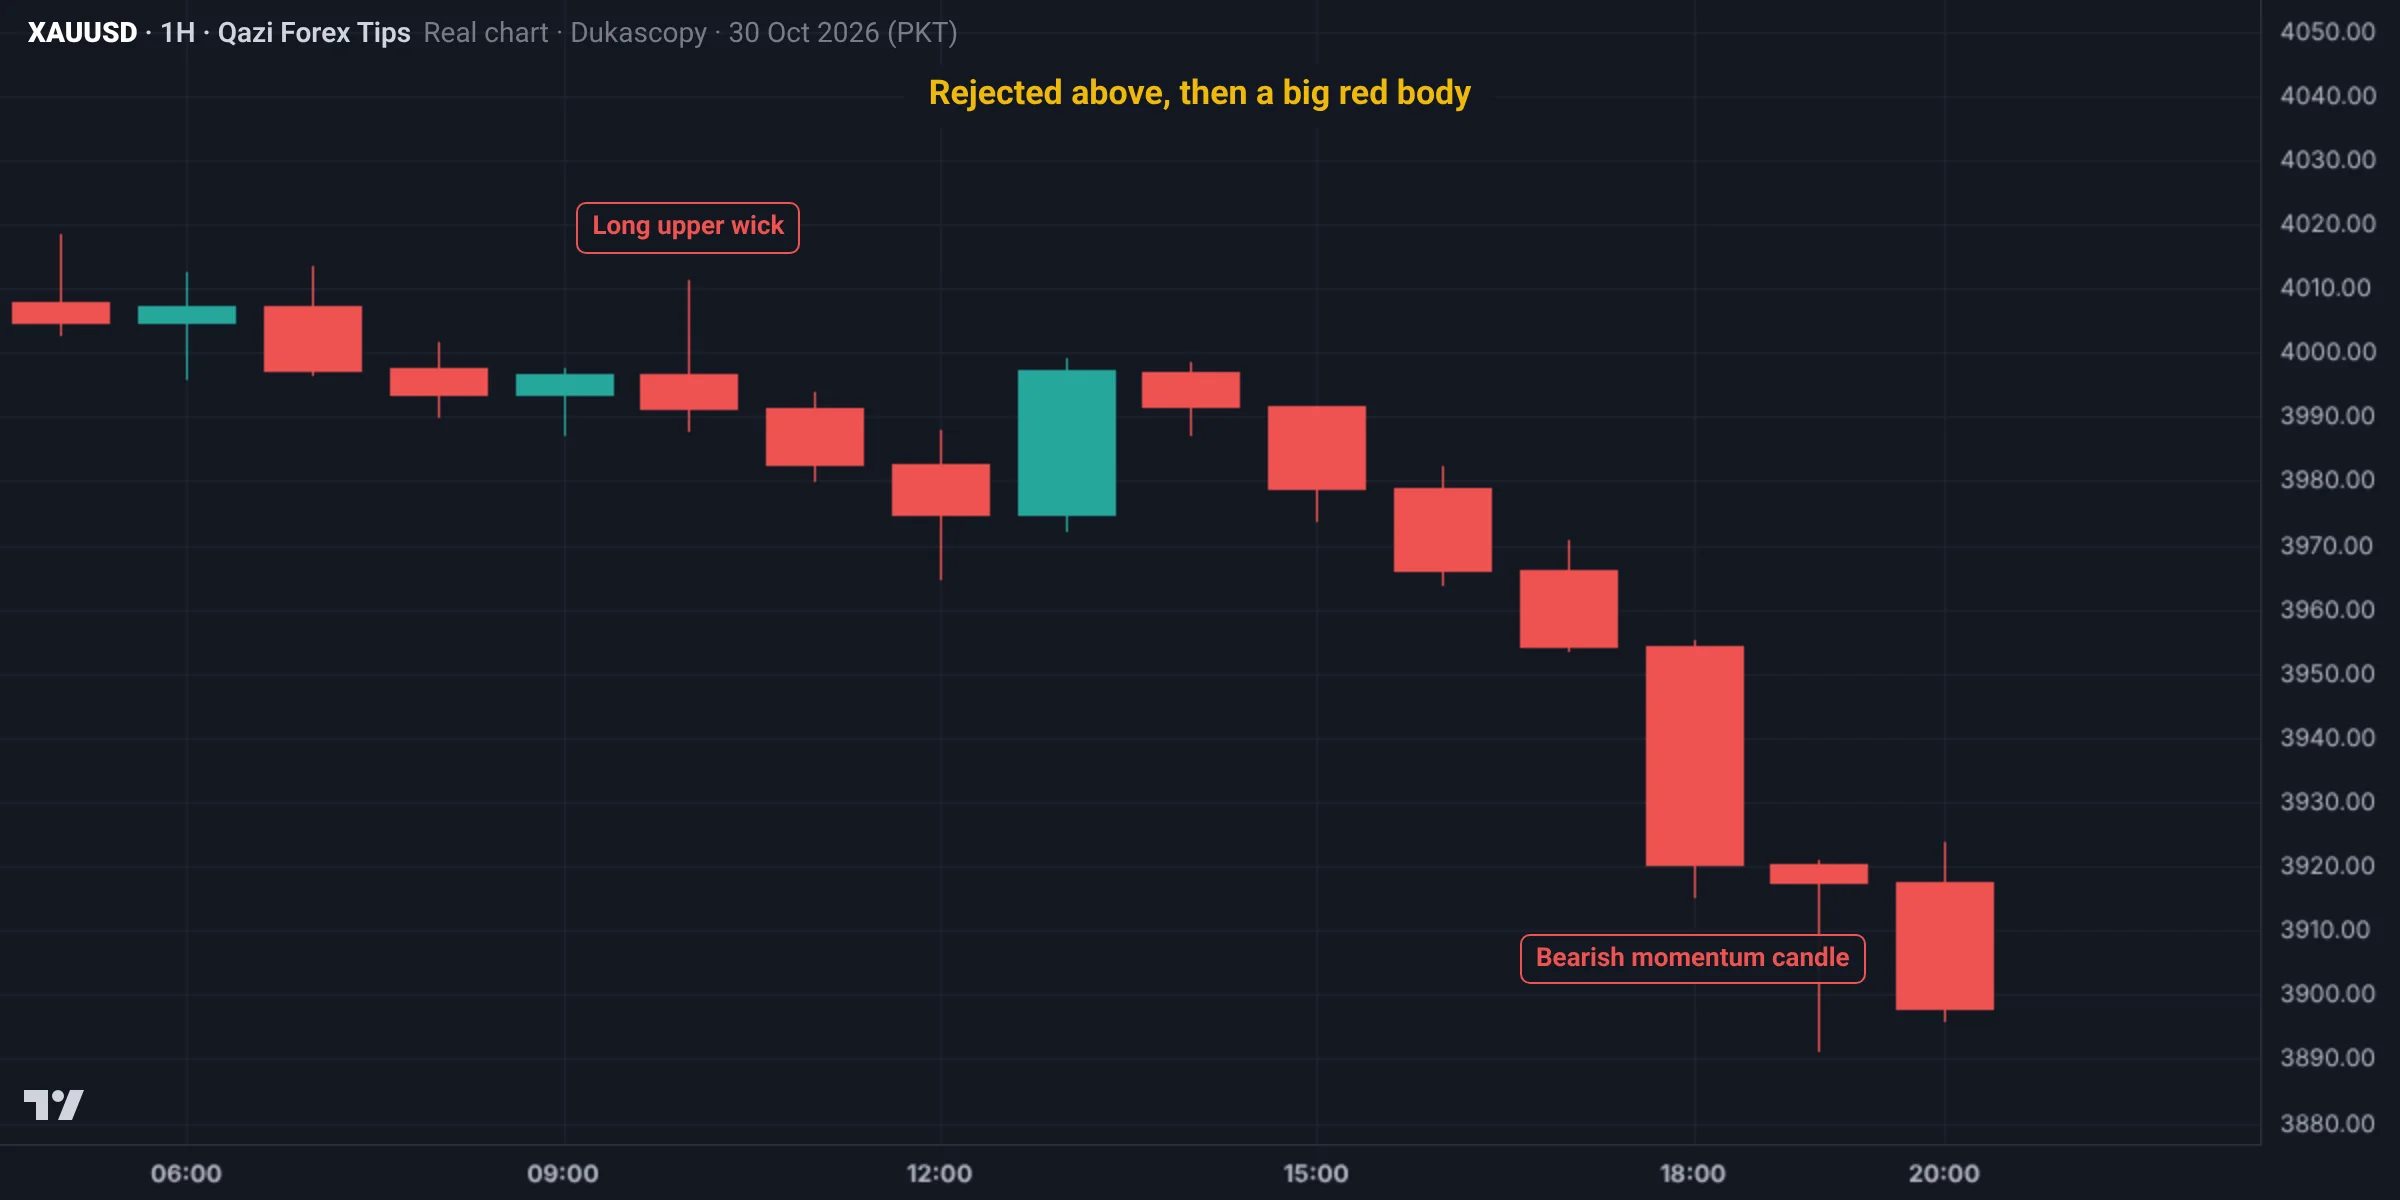
- The 10:00 candle: open 3,996.6, high 4,011.3, low 3,988.0, close 3,991.2. Price pushed up but left a $14.7 upper wick and closed lower: sellers were in control above.
- The 18:00 candle: open 3,954.2, close 3,920.4, a red body of about $34, 85% of the whole range. A close near the low: sellers held control to the end.
Bullish or bearish, the rule is the same: a wick shows rejection, a big body and the close show strength.
Common mistakes
Summary
- Every candle has four numbers: open, high, low, close.
- A body above 70% is momentum; below 30% is indecision or rejection.
- Impulses have big bodies; pullbacks have small candles.
- Every SMC decision is made on the candle close.
Spot it on the chart: practice
This is a real Gold chart (Dukascopy data, Pakistan time). Study it and pick an answer. After you answer, the fully marked chart and the explanation appear.
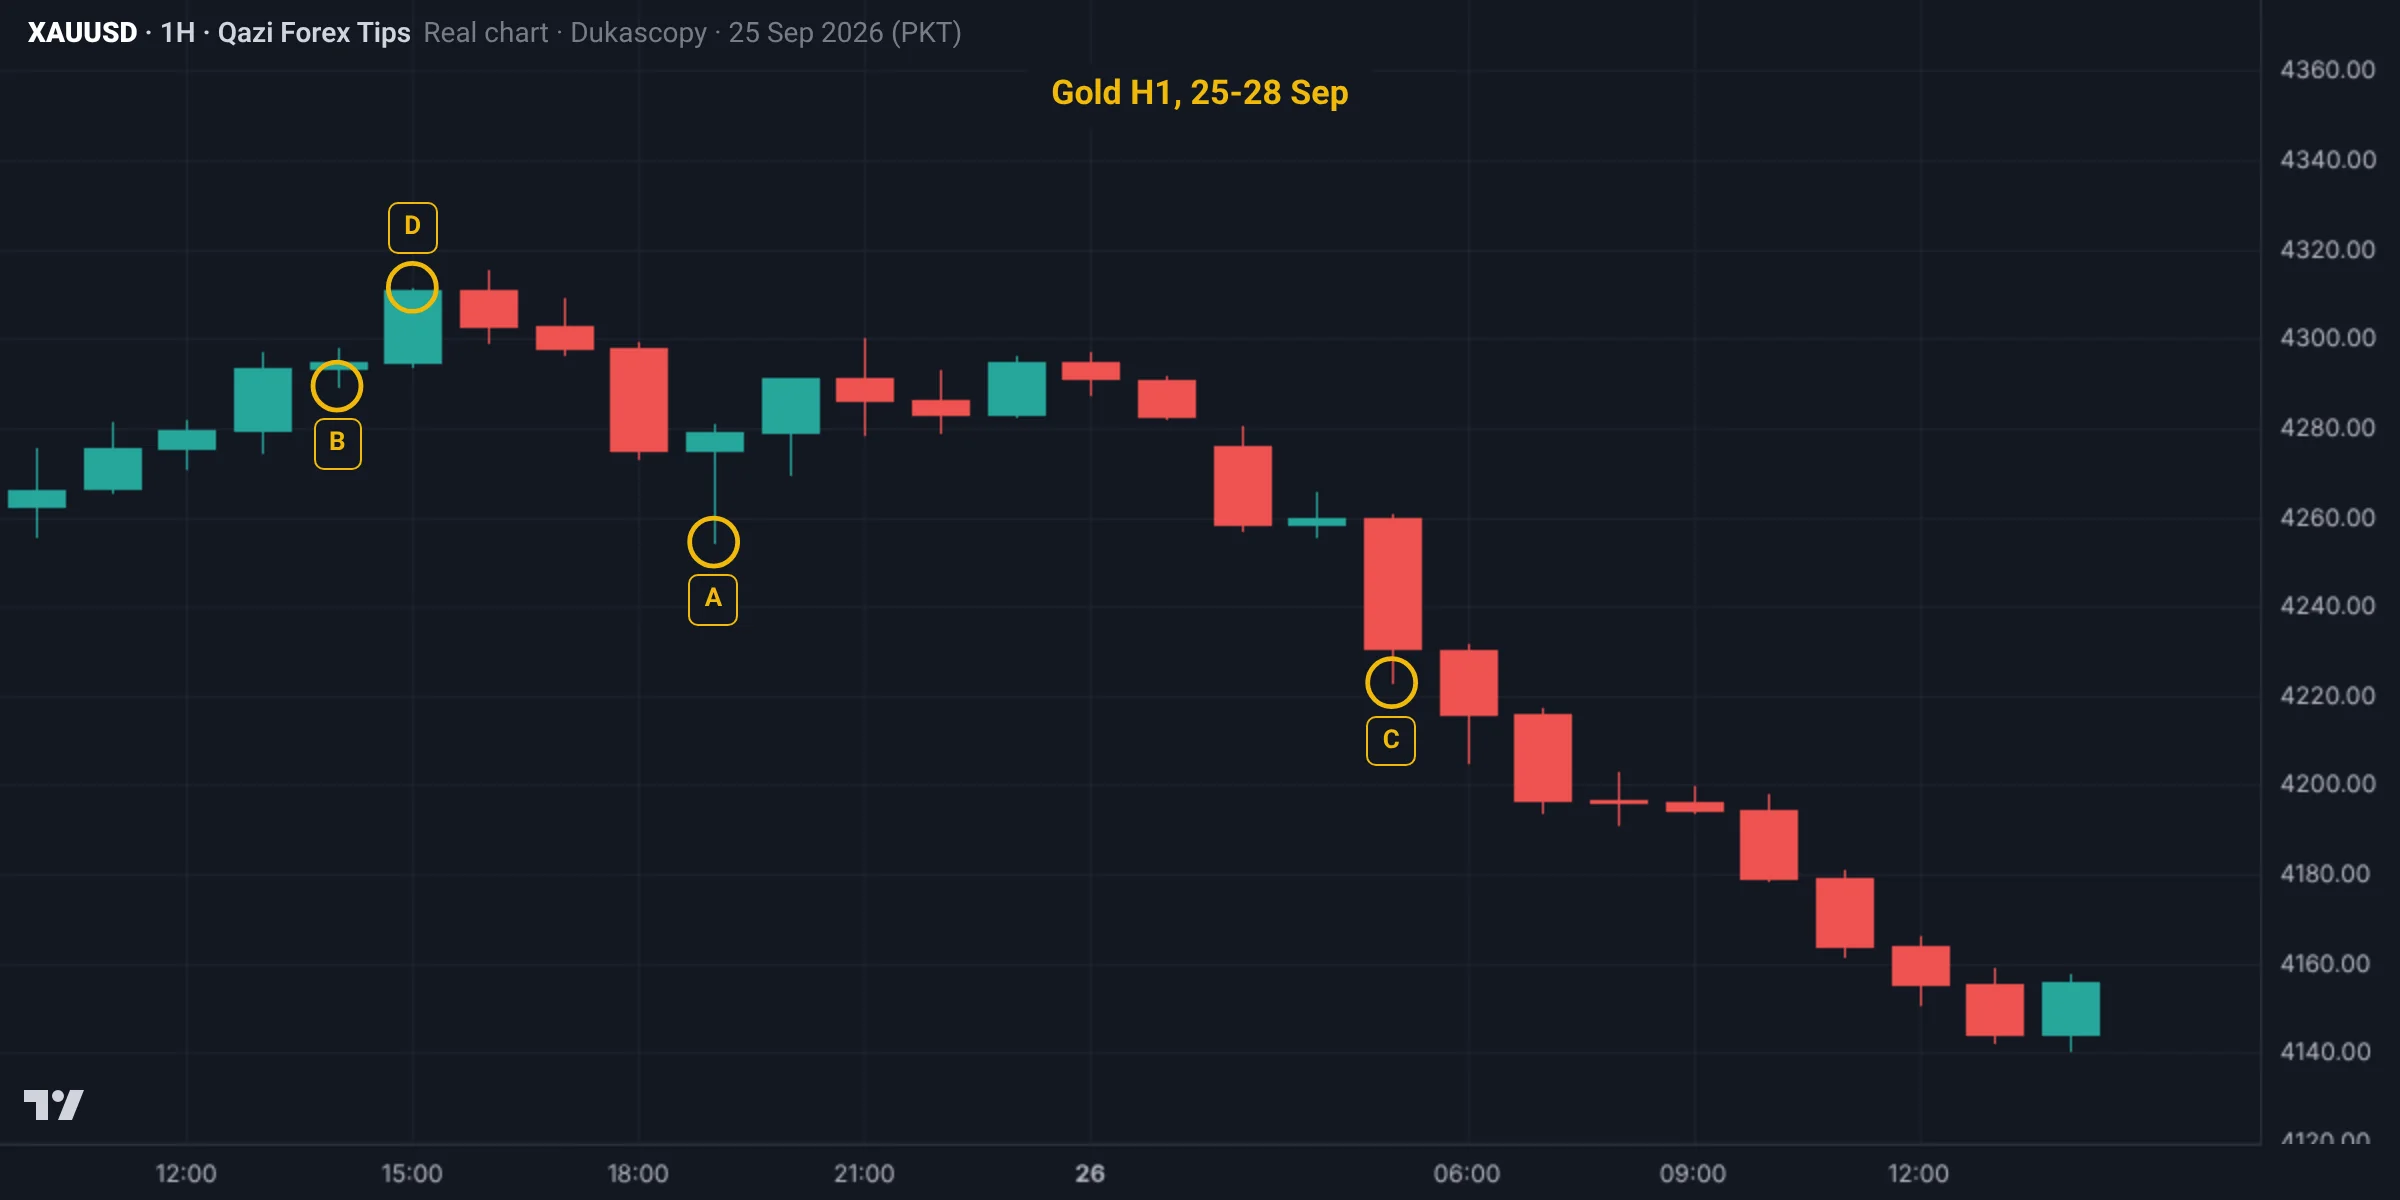
Which of these four candles is a bearish momentum candle?
C (05:00 on 28 Sep): open 4,260.0, close 4,230.8, a 37.7-dollar range and a body of about 77%. A has a long lower wick (rejection), B's body is only 19% (indecision), and D is a bullish momentum candle (91%).
The marked chart
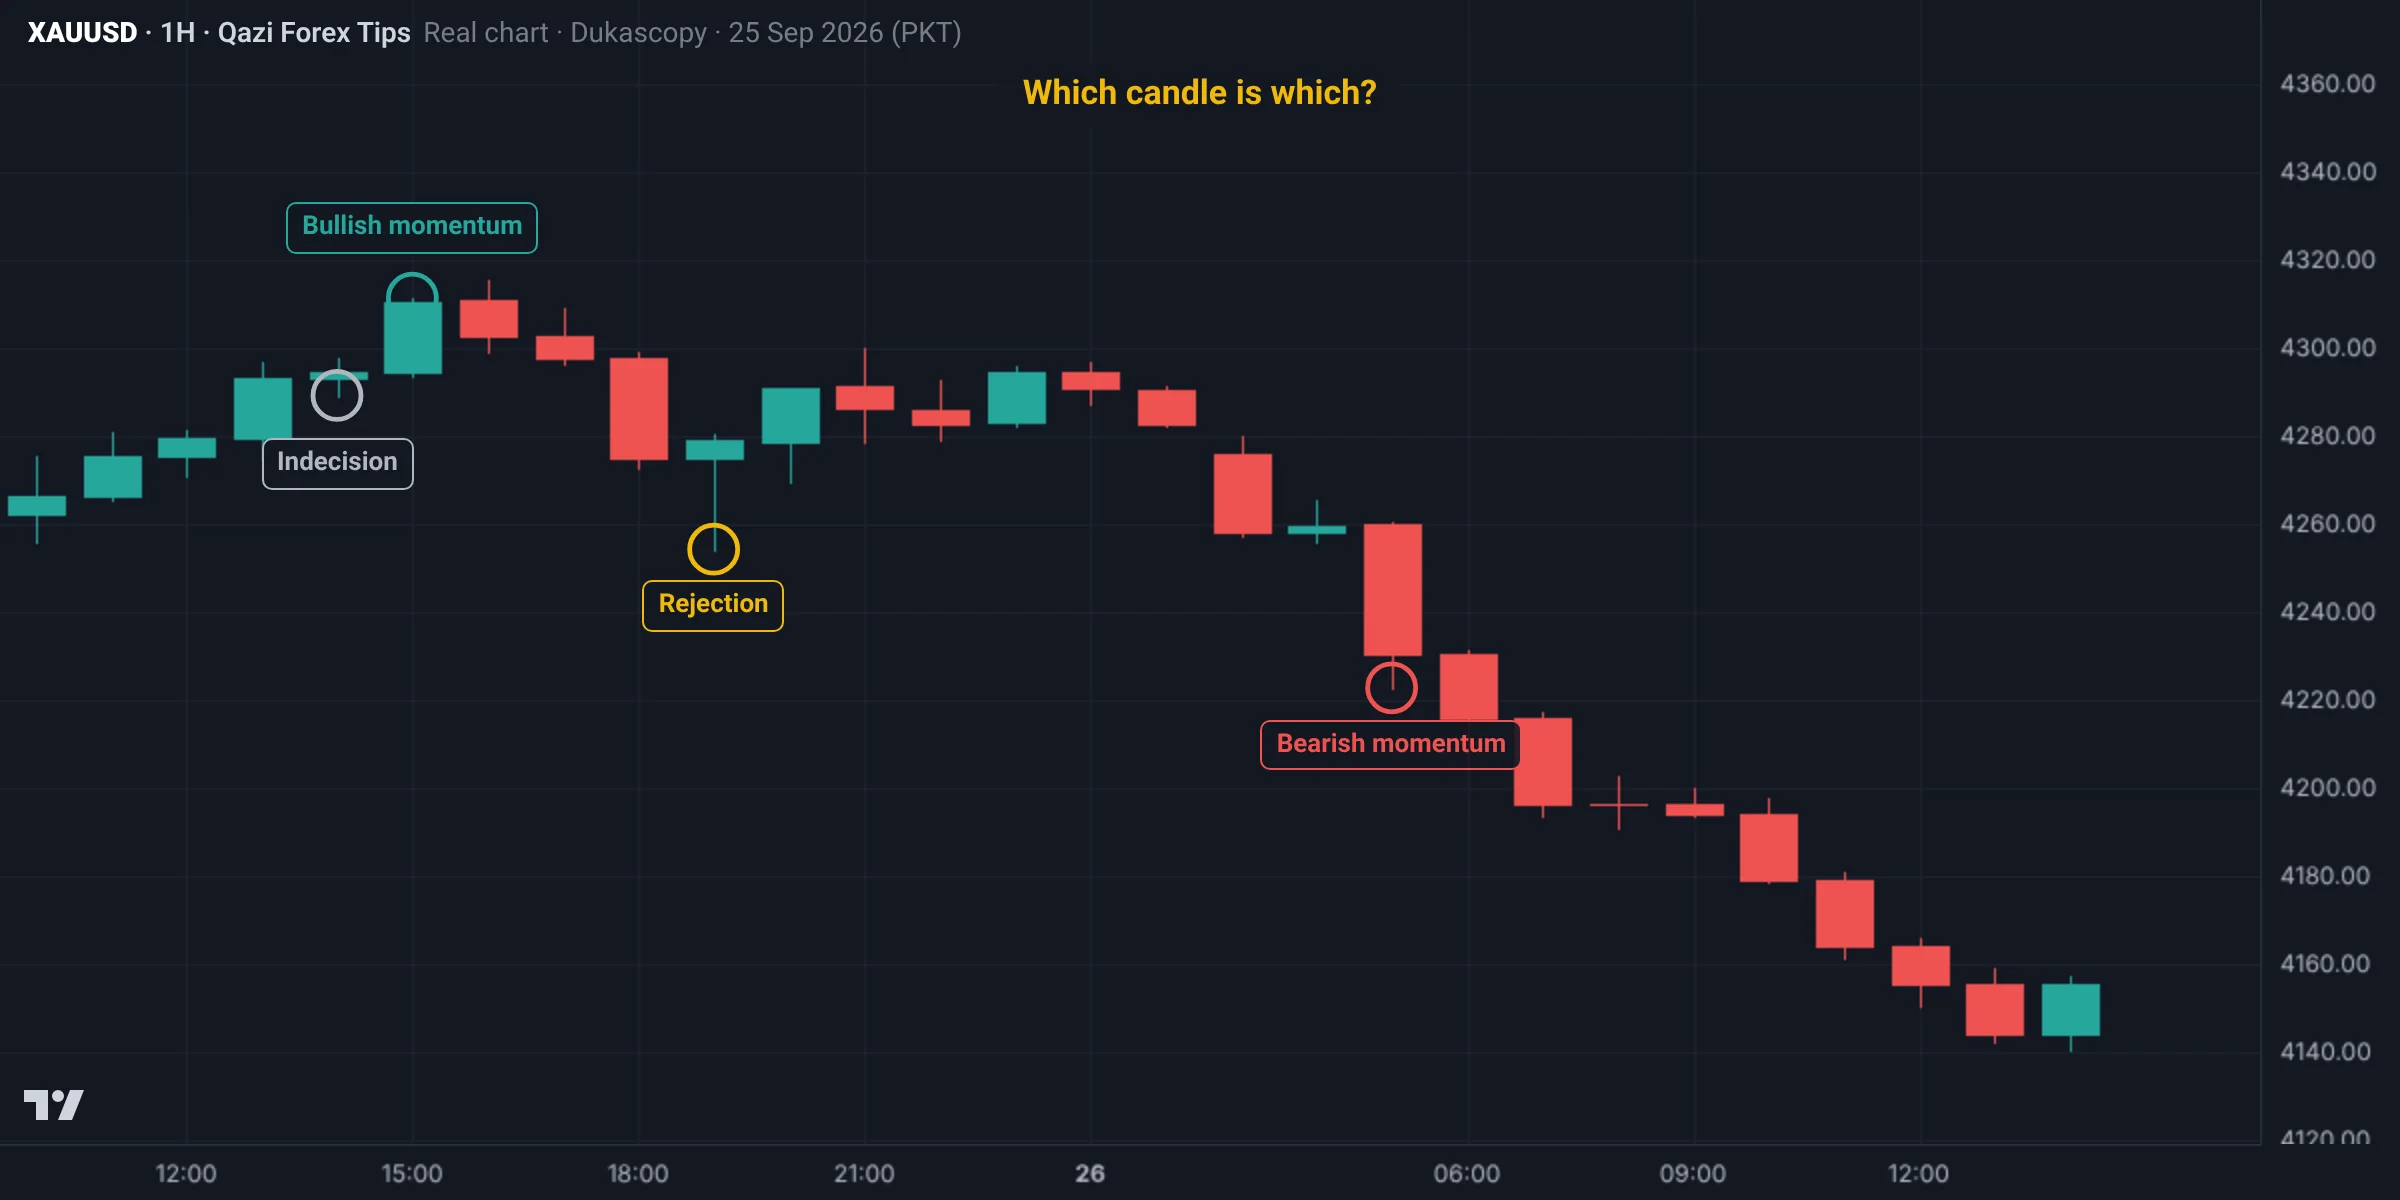
Test yourself: Lesson 0.2 quiz
12 questions. Pick one answer for each and you will see at once whether it is right and why. Your score and grade appear at the end. You need 70% to pass.
0 correct · 0 / 12
Question 1What are the four numbers of a candle?
Every candle is made of just four numbers: OHLC.
Question 2What does a candle's body tell you?
The body shows the decision; a big body means a strong decision in one direction.
Question 3What does a long upper wick mean?
A wick shows price went there but was not accepted; an upper wick shows selling from above.
Question 4When a wick crosses a level but the body closes back inside, what is it often in SMC?
Wick beyond, body back inside = sweep; body closing beyond = break.
Question 5How do you recognise a momentum candle?
A momentum candle is a fast decision by one side; in SMC it is called displacement.
Question 6Gold M15 candle: open 4,128.40, high 4,135.90, low 4,127.10, close 4,134.80. What kind is it?
Body 6.4 and range 8.8 dollars, about 73%; the close is above the open, so it is bullish.
Question 7If the body is below 30% of the full range, what is the candle?
A body under 30% means no decision, or one side's price was rejected.
Question 8When should you treat a candle as a rejection?
If one wick is twice the body or longer, price was not accepted there.
Question 9How do impulse candles differ from pullback candles?
If big momentum candles suddenly appear inside a pullback, the trend may be changing.
Question 10When should you decide on a BOS, CHoCH or sweep?
A forming candle can give everything back in its last minutes, so decide on the close.
Question 11How many M15 candles make one H1 candle, and what is a long H1 wick often on M15?
A higher-timeframe wick is often a complete sweep and reversal on the lower timeframe.
Question 12"Green means buy, red means sell." Why is this wrong?
A red candle with a big lower wick at support can be a bullish sign.
Lesson checklist
Tick each point once you understand it. Your ticks are saved in this browser.
Assignment
- On a Gold or EURUSD H1 chart, find 10 momentum candles, 10 indecision candles and 10 rejection candles.
- Screenshot the 3 best examples of each type and mark the candle.
- Find 3 places where a wick crossed a level but the body closed back inside, and 3 where the body closed beyond it. Write what price did after each.
- Write the OHLC of 10 Gold M15 candles, work out each body ratio and label it momentum, normal or indecision.
- Open one H1 candle on M15 and see what its long wick looks like on the lower timeframe.
Post your assignment screenshots with your reasons in our free Facebook group, where your charts will be checked.
Join the free group
Who wrote this lesson
Dr. Qazi Abdul Basit, Ph.D
Ph.D in Business Administration and a forex and Gold trader since 2013. Founder of Qazi Forex Tips, which teaches traders in Pakistan and India price action, risk management and trading psychology in their own language: 65 student batches so far, free courses on YouTube, and MT5 tools for traders (QFT Replay Simulator, QFT Trade Assistant).
- 2013 trading since
- 75K+ Facebook group members
- 65 student batches
- 15K+ YouTube subscribers
How this lesson was made: the content follows Dr. Qazi's teaching method and years of trading. Real charts are built from Dukascopy Gold (XAUUSD) data, and backtest results are shown as they came out, even when negative. We do not sell signals, manage accounts or take money from any broker. Last updated: 19 November 2026.
Questions
What is a momentum candle?
A candle whose body is at least about 70 percent of its range, clearly larger than the candles around it, showing a strong one-sided move (displacement).
What does a long wick mean?
Price reached that area but was not accepted there; a long upper wick shows selling, a long lower wick shows buying.
Why does SMC use the body close?
A wick beyond a level is often a liquidity sweep; only a body close beyond the level counts as a real break.
Does candle colour matter?
Much less than location and size. A small green candle at resistance means little; a momentum candle closing beyond a level means a lot.
What is an indecision candle?
A candle with a small body and wicks on both sides, showing balance between buyers and sellers.
What is displacement in SMC?
A strong move made of one or more momentum candles; order blocks and fair value gaps form with it.
How do you read a candlestick chart?
Each candle shows four prices: open, high, low and close. The body runs from open to close and the wicks reach the high and low. A green candle closed above its open, a red one below. A big body shows strength, a long wick shows rejection.
What does XAUUSD mean?
XAU is the code for Gold and USD is the US dollar, so XAUUSD is the price of one ounce of Gold in dollars. A price of 4,000 means one ounce costs $4,000.
Read more
Education only, not financial advice. Trading forex, Gold and CFDs carries a high risk of loss. SMC concepts describe tendencies, not guarantees. Lesson 2 of 38.