 Qazi Forex Tips

Five models, one family
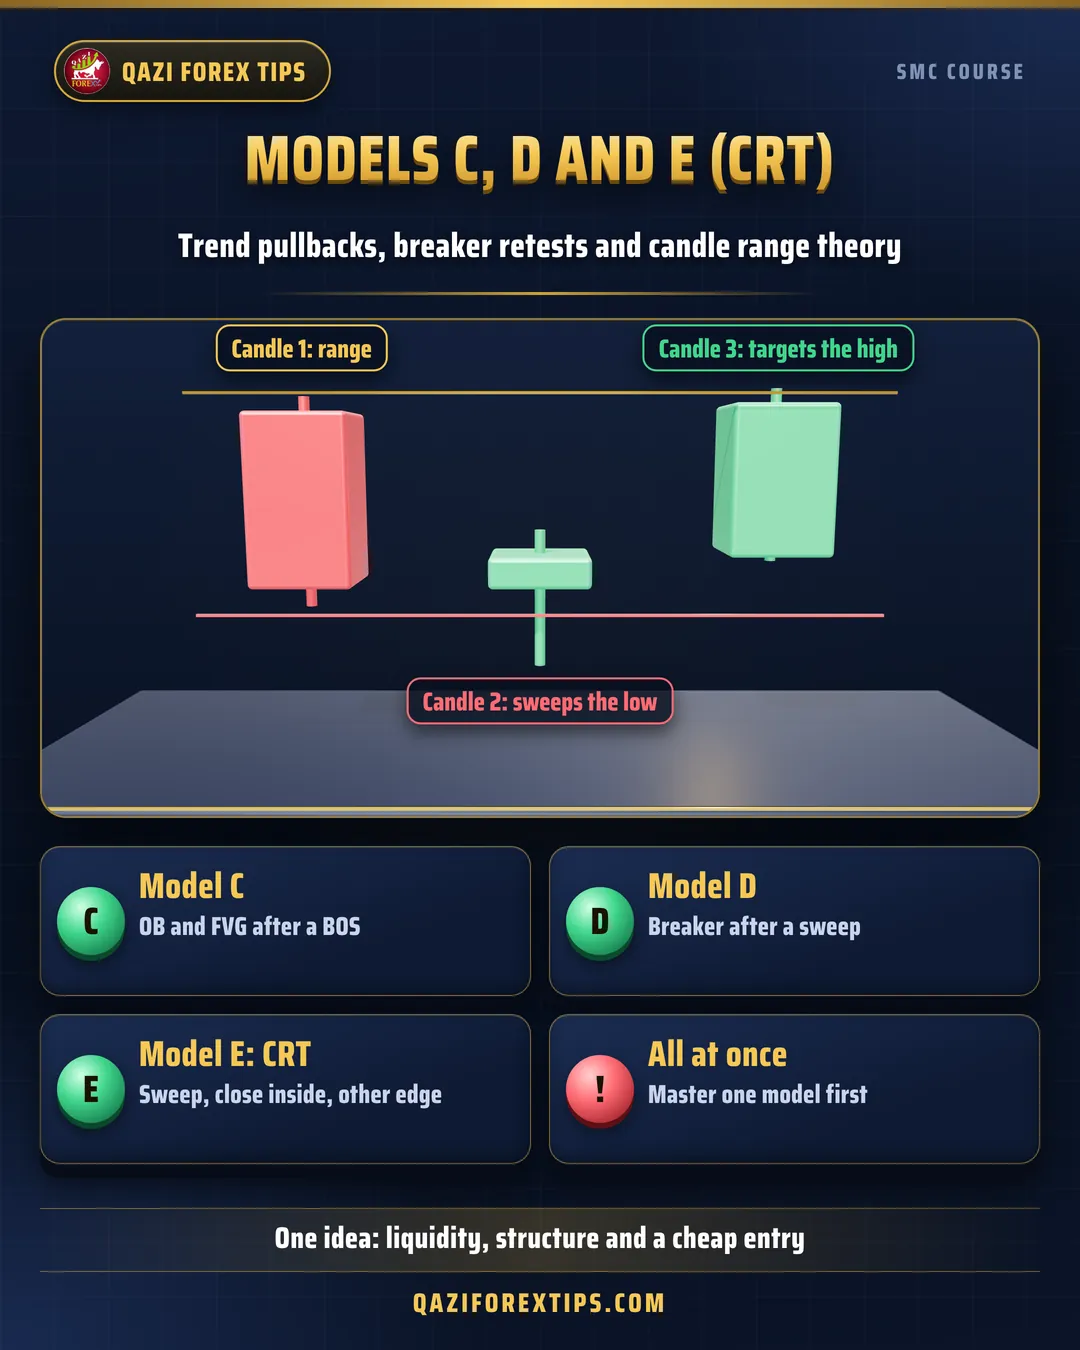
Every SMC model is a version of one idea: liquidity, a structure change or confirmation, and an entry from a cheap location. The difference is the situation:
| Model | Situation | Summary |
|---|---|---|
| A | Reversal, session open | Sweep, MSS, FVG |
| B | Any big POI | HTF POI, LTF CHoCH |
| C | Trend continuing | Pullback to OB and FVG after a BOS |
| D | Reversal, structure already shifted | Breaker retest after a sweep |
| E | A higher timeframe candle | CRT: a candle sweeps and closes back inside |
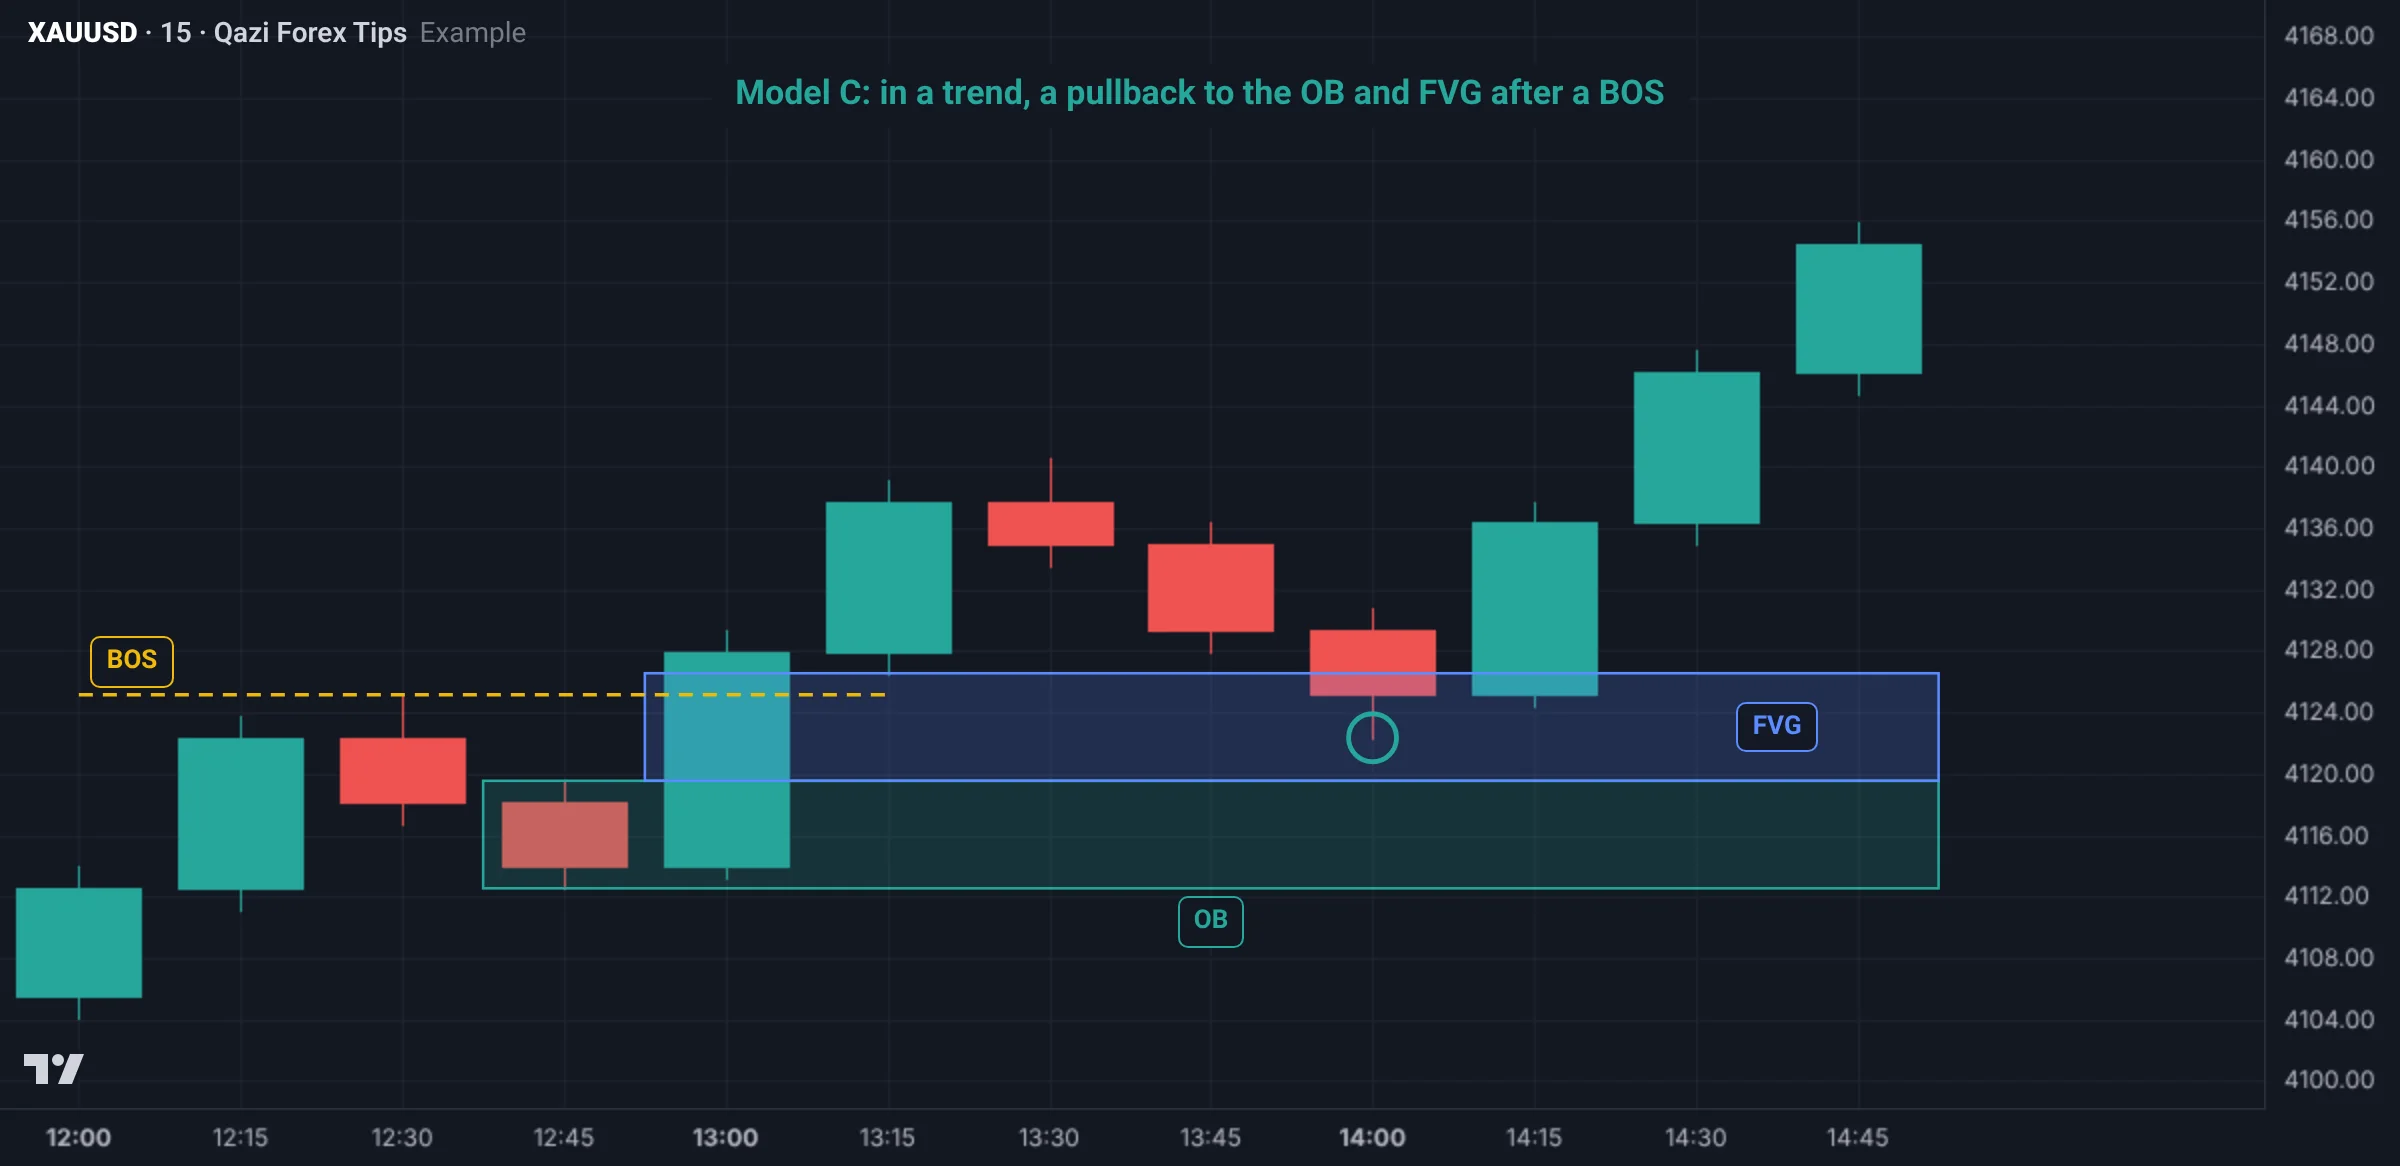
Model C: trend continuation (OB + FVG)
Rules:
- Higher timeframe and M15 both trending (HHs and HLs).
- A fresh BOS, and the BOS move left an order block and FVG.
- Let the pullback reach the OB and FVG, ideally in discount (50% of the BOS leg or deeper).
- Entry in the FVG or at the top of the OB, or after an M1 CHoCH there.
- SL below the OB. TP at the new high and the BSL above it.
When not to: when the trend is extended and price is in higher timeframe premium. Then the pullback may go deep and the OB may fail.
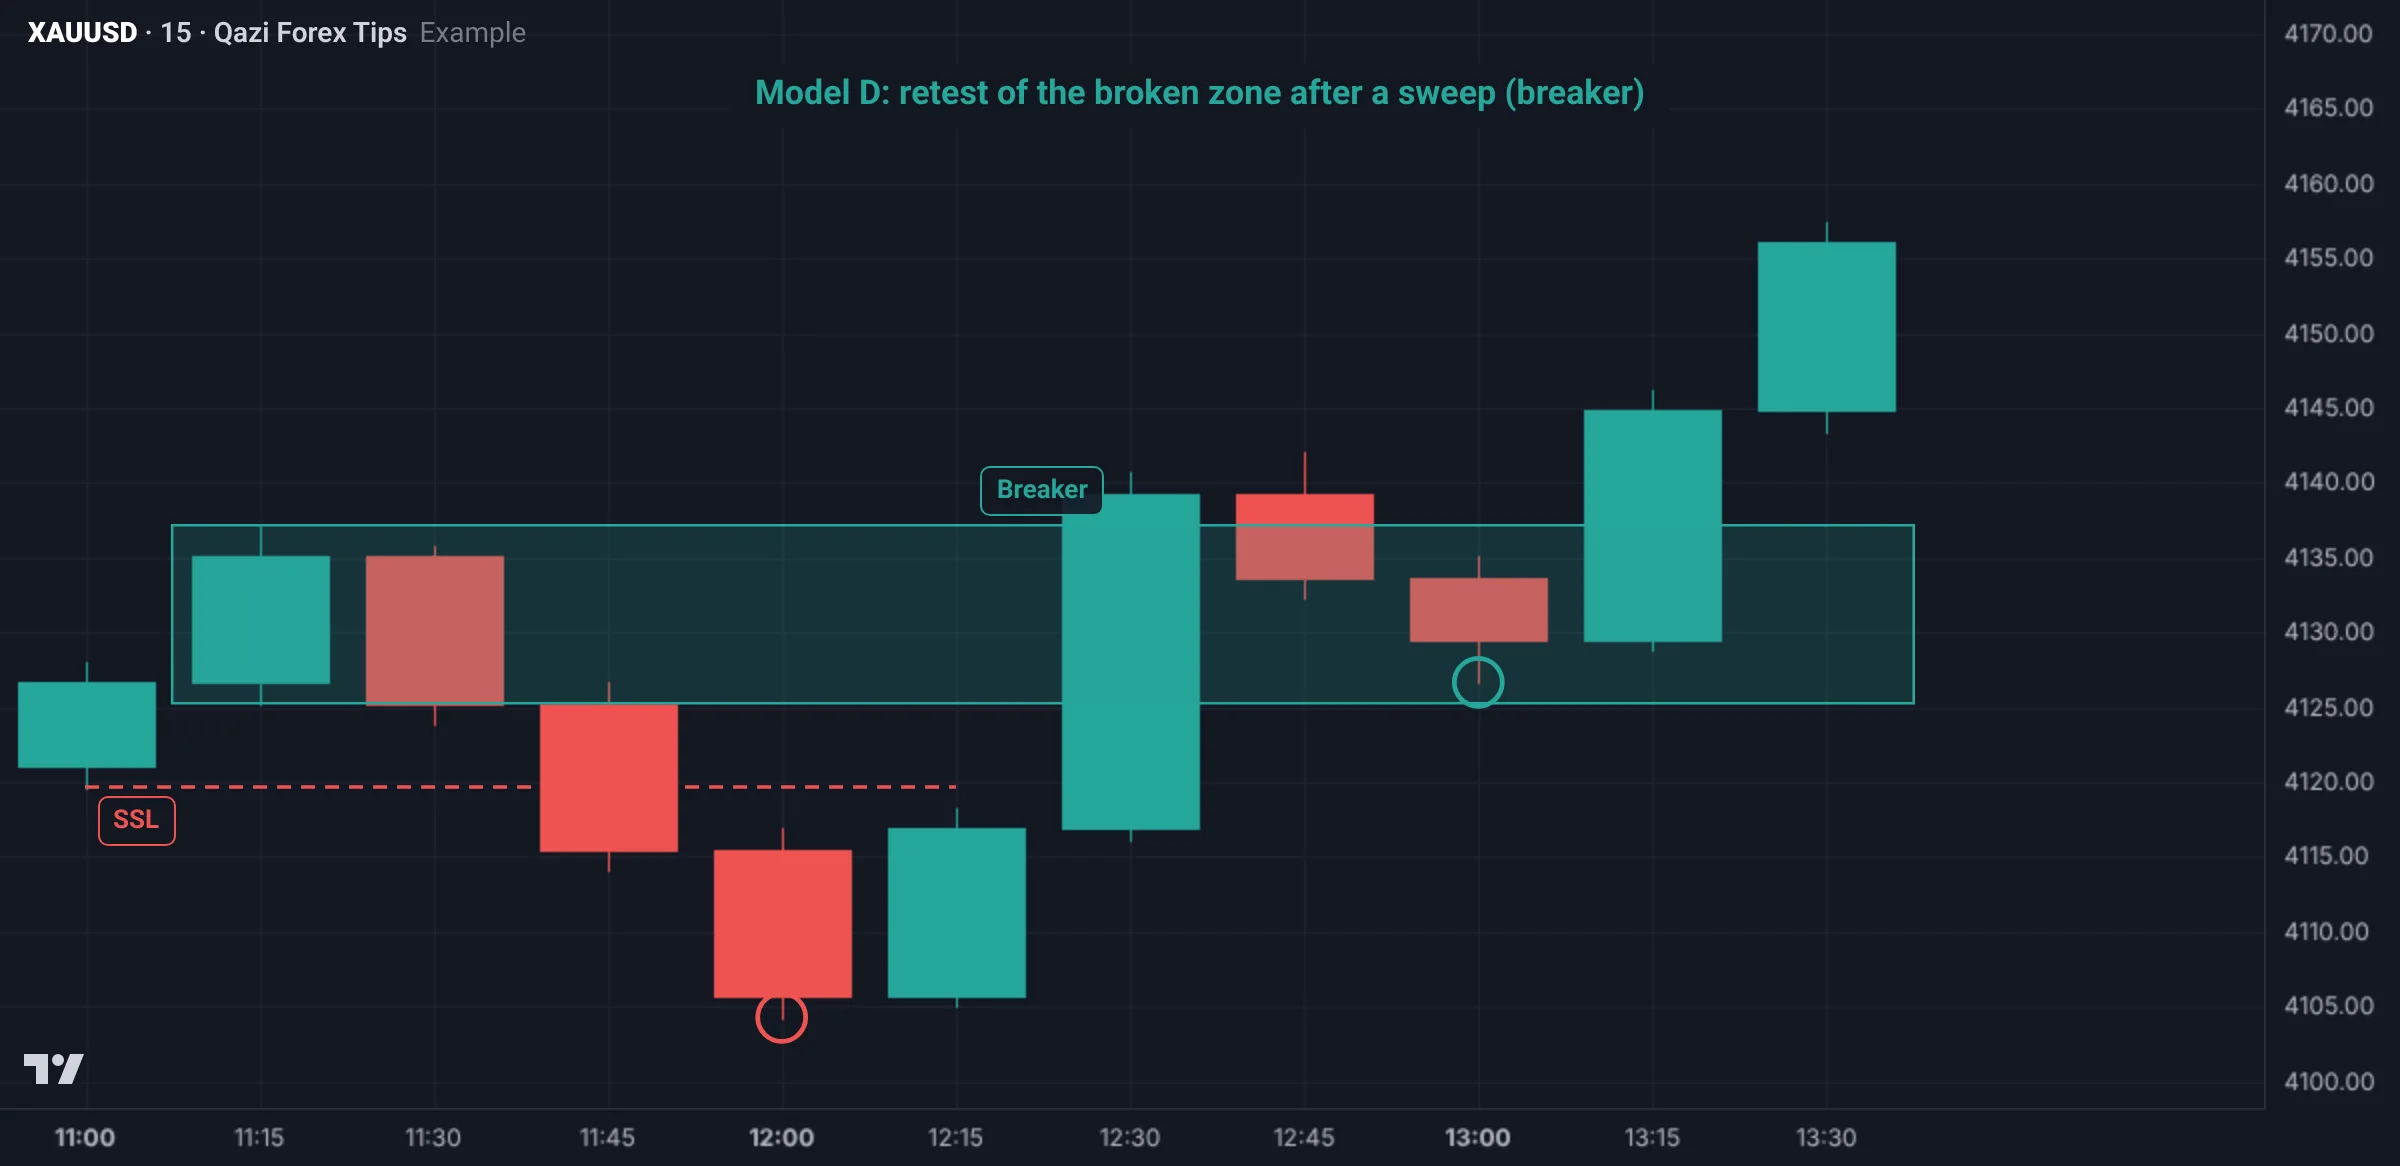
Model D: breaker retest
Rules (full detail in lesson 3.3):
- Low, high, lower low (SSL sweep), then the high breaks with displacement (MSS).
- The green candles that built the broken high form the breaker.
- Entry on the retest at the top or 50% of the breaker.
- SL below the breaker, or more safely below the swept low.
- TP at the first BSL above, then the DOL.
Models D and A often form in the same place. The difference is the entry location: the FVG in model A, the breaker zone in model D. Where they overlap is the best entry.
Model E: CRT (candle range theory)
The idea is simple: every candle is a range. Its high and low are the edges, and stops rest beyond them.
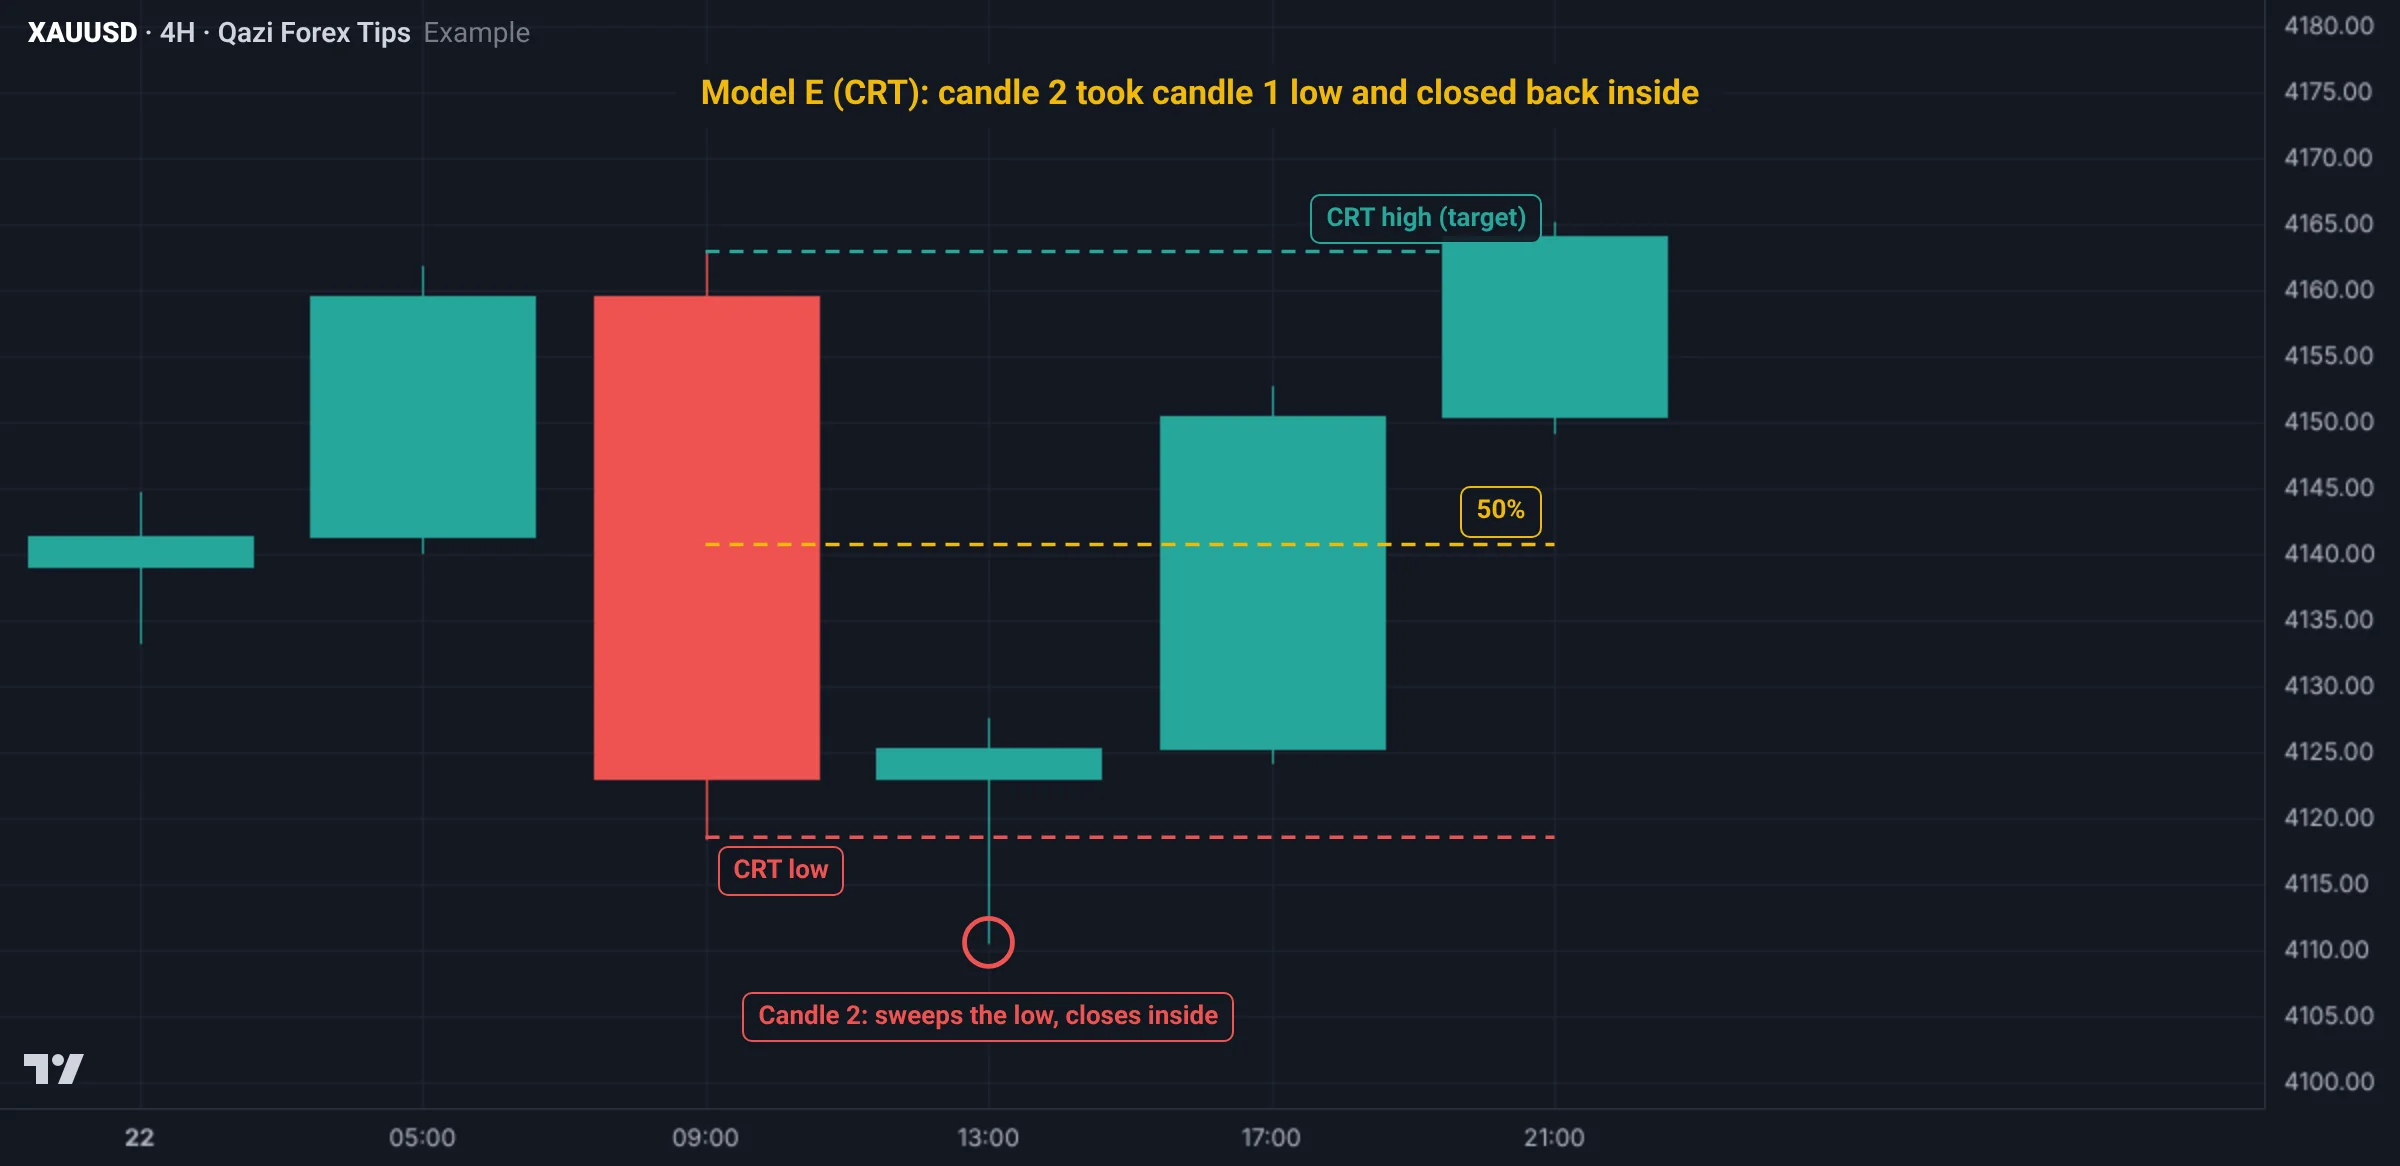
Bullish CRT rules:
- Candle 1: a large higher timeframe candle (H4 or D1). Mark its high and low.
- Candle 2: sweeps candle 1's low but does not take its high, and closes back inside candle 1's range.
- If candle 2 closes below the low, the CRT is cancelled. If candle 2 takes both the high and the low, it is not a CRT.
- Entry: on a lower timeframe (M15 or H1), late in candle 2 or early in candle 3, from a CHoCH and FVG.
- SL: below the swept low (candle 2's low).
- TP1: candle 1's 50%. TP2: candle 1's high.
The bearish CRT is the mirror: candle 2 sweeps candle 1's high and closes back inside; the target is candle 1's low.
An honest point about CRT
A candle taking the previous candle's high or low and closing back inside happens every day on every chart. So CRT alone is weak. These filters make it strong:
- the sweep takes significant liquidity (PDL, the weekly low, inside an HTF POI);
- the higher timeframe bias agrees;
- an LTF CHoCH and FVG confirm;
- candle 2 sweeps during a killzone.
Which model when?
| What you see | Model |
|---|---|
| Clean trend, fresh BOS, pullback starting | C |
| An Asian or PDL sweep at a session open | A (and often D) |
| Structure has shifted, the broken zone is being retested | D |
| Price inside a big H1 or H4 POI | B |
| An H4 or D1 candle took one edge of the previous candle and closed inside | E |
Advice: start with one model (A or B), backtest 50 trades, then add another. Learning and trading all five at once creates confusion.
Gold example: model E (CRT)
- Candle 1 (H4): high 4,146, low 4,110. 50% = 4,128.
- Candle 2 (next H4): in London price dropped to 4,103 (sweeping candle 1's low and PDL 4,106), then closed at 4,114: back inside. A bullish CRT.
- On M15: a CHoCH and an FVG from 4,111 to 4,115. Entry 4,113, SL 4,101, risk $12.
- TP1: the 50% at 4,128 ($15, 1:1.25): close half and move the stop to break-even. TP2: 4,146 ($33, about 1:2.75).
Real Gold chart examples
Gold H4 on 27 Oct 2026 (data: Dukascopy, bid price; Pakistan time). H4 candles are counted from New York midnight (09:00, 13:00 and 17:00 in Pakistan that day):
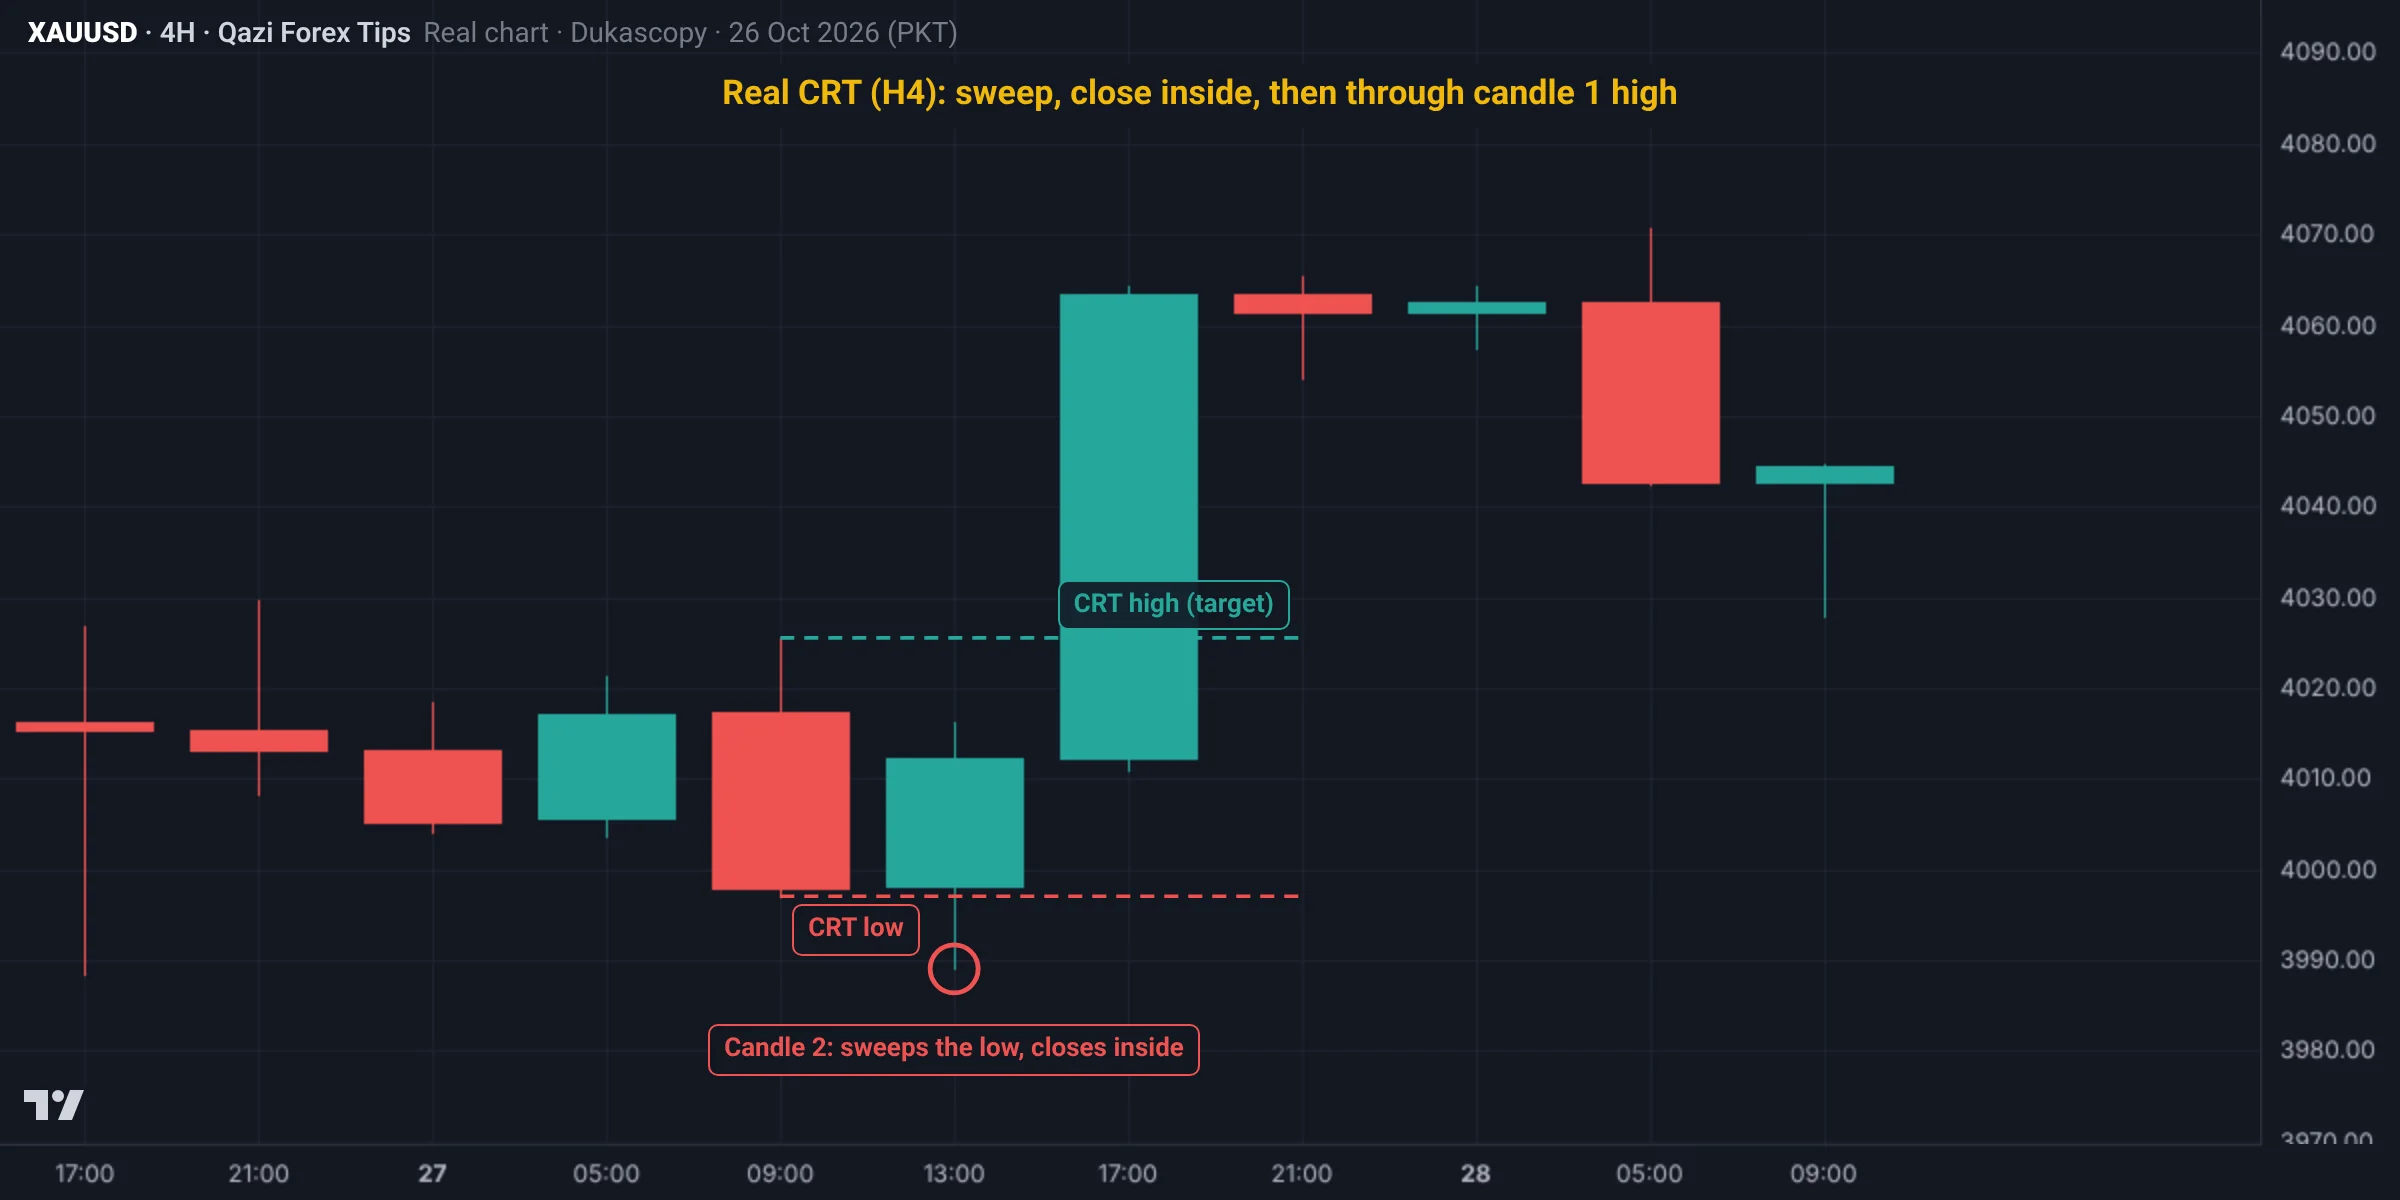
- Candle 1 (09:00 to 13:00): high 4,025.5, low 3,997.0. 50% = 4,011.3.
- Candle 2 (13:00 to 17:00): low 3,989.0, sweeping candle 1's low without taking its high, and closing inside candle 1's range at 4,012.2: a bullish CRT.
- Candle 3 (17:00 to 21:00): high 4,064.3: through candle 1's high, the full target.
This is the same day as model A (lesson 5.2): the CRT gave the big picture, model A the entry. But remember, in lesson 7.1's backtest CRT on its own was negative over two months.
Second example: a bearish CRT (29 Oct)
Gold H4 on 28 and 29 Oct 2026 (data: Dukascopy, bid price; Pakistan time). The first example was a bullish CRT; this is a bearish CRT:
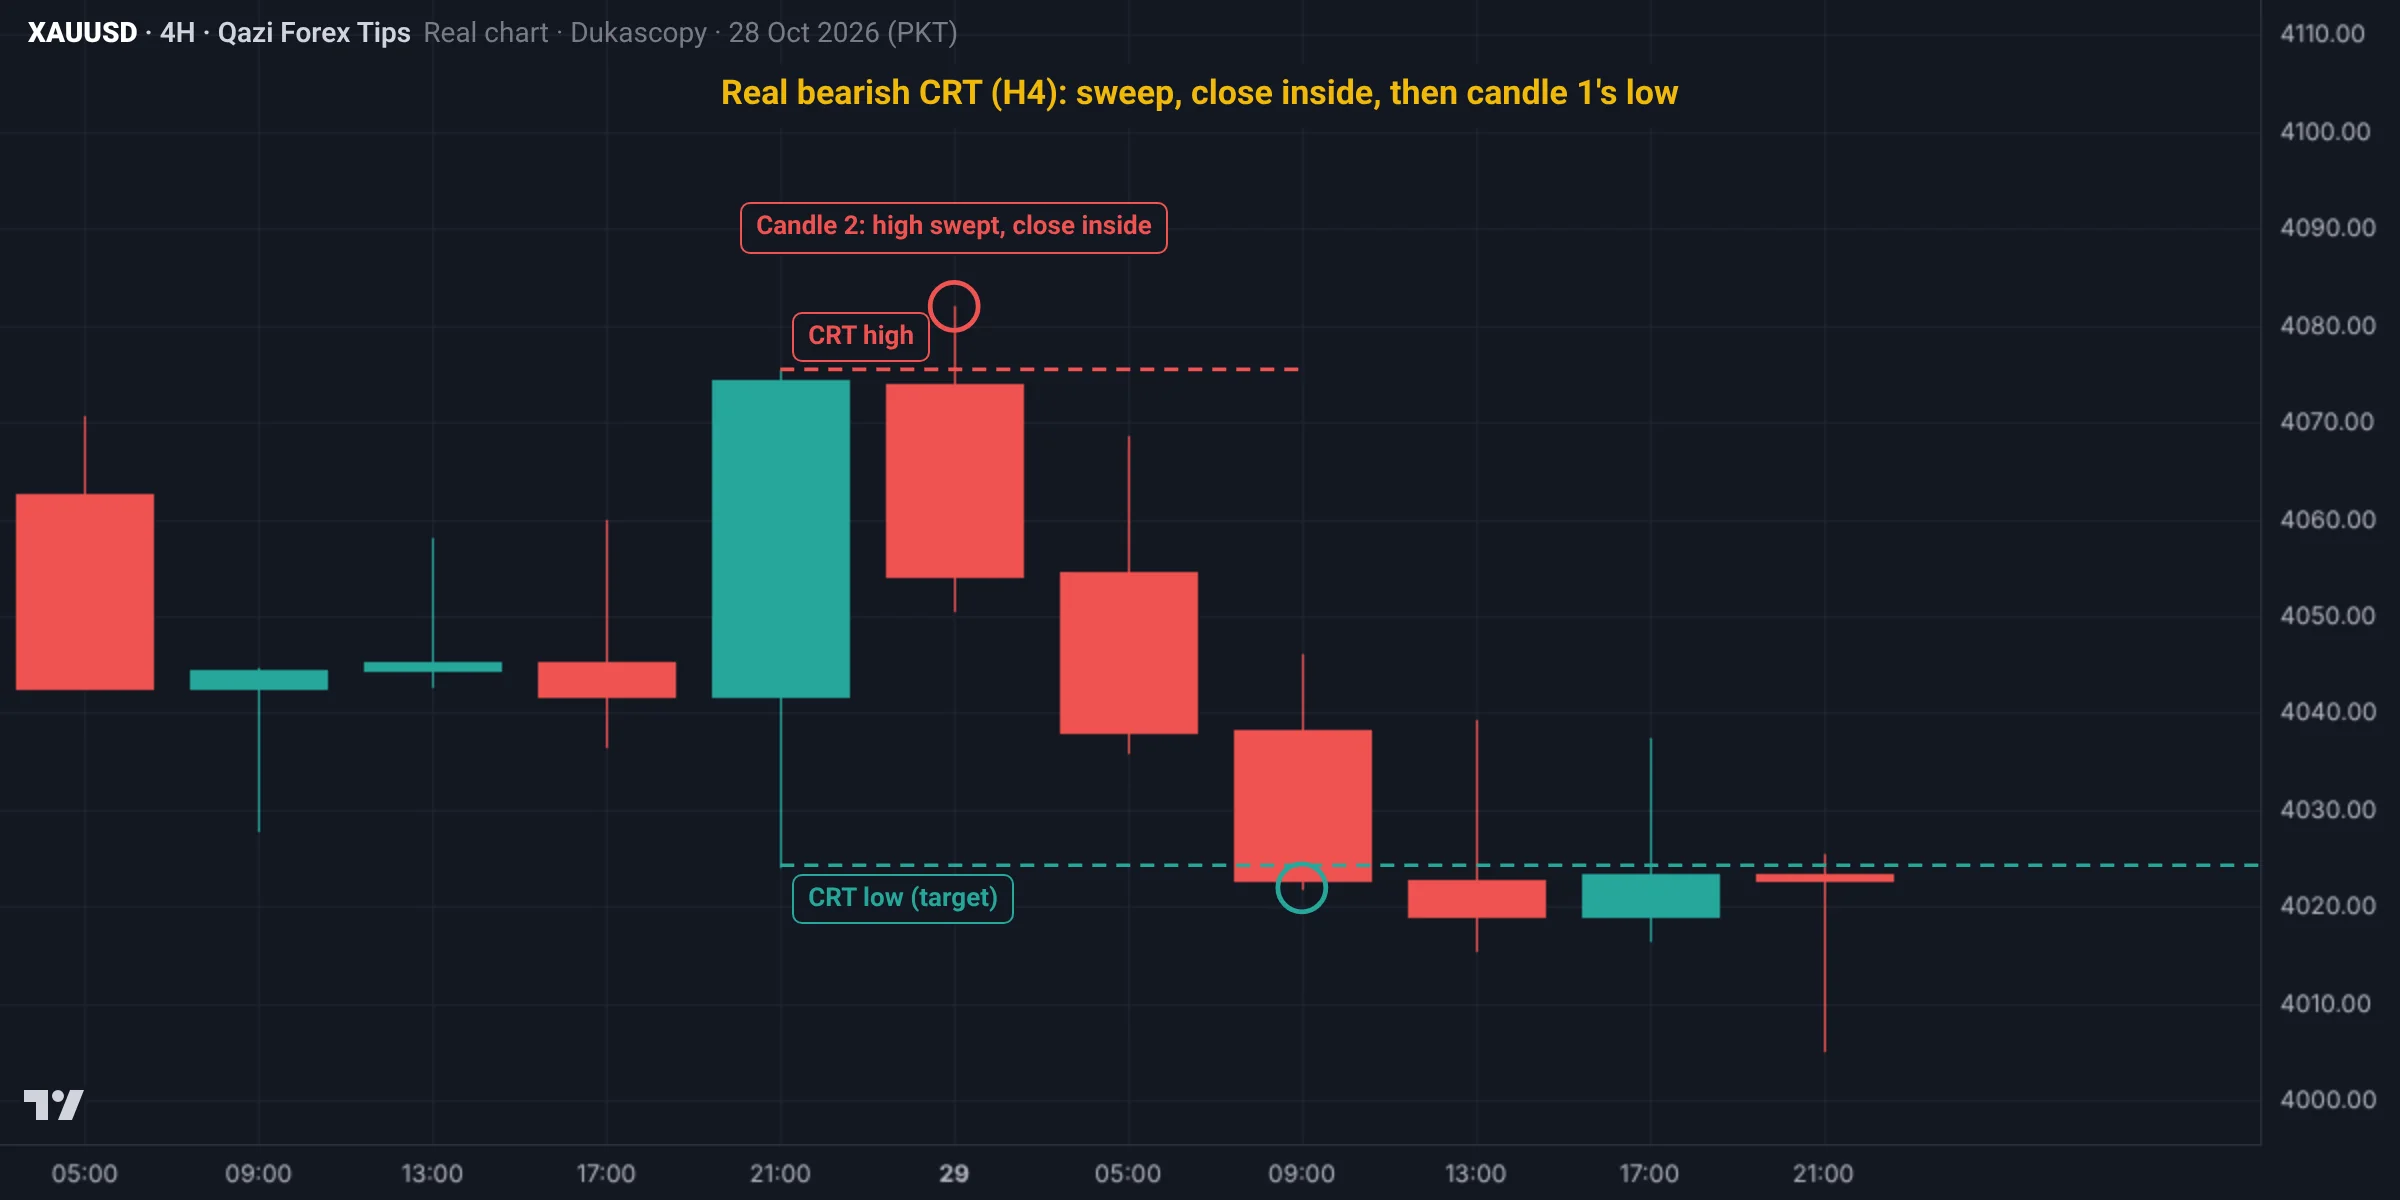
- Candle 1 (28 Oct, 21:00 to 01:00): high 4,075.5, low 4,024.3.
- Candle 2 (29 Oct, 01:00 to 05:00): high 4,082.0, so it swept candle 1's high, did not take its low, and closed inside candle 1's range at 4,054.2: a bearish CRT.
- Trade: sell at candle 2's close, SL above its high (risk about $27.8), target candle 1's low (about $29.9).
- Result: the H4 candle at 09:00 on 29 Oct 2026 took 4,024.3: about +1.1R.
This trade is also in lesson 7.1's backtest. Remember, there CRT on its own was negative over two months; this is one winning example, not the rule.
Common mistakes
Summary
- Model C: a pullback to the OB and FVG after a BOS in a trend.
- Model D: a breaker retest after a sweep and MSS.
- Model E (CRT): candle 2 sweeps one edge of candle 1 and closes inside; the target is the other edge.
- Master one model first.
Spot it on the chart: practice
This is a real Gold chart (Dukascopy data, Pakistan time). Study it and pick an answer. After you answer, the fully marked chart and the explanation appear.
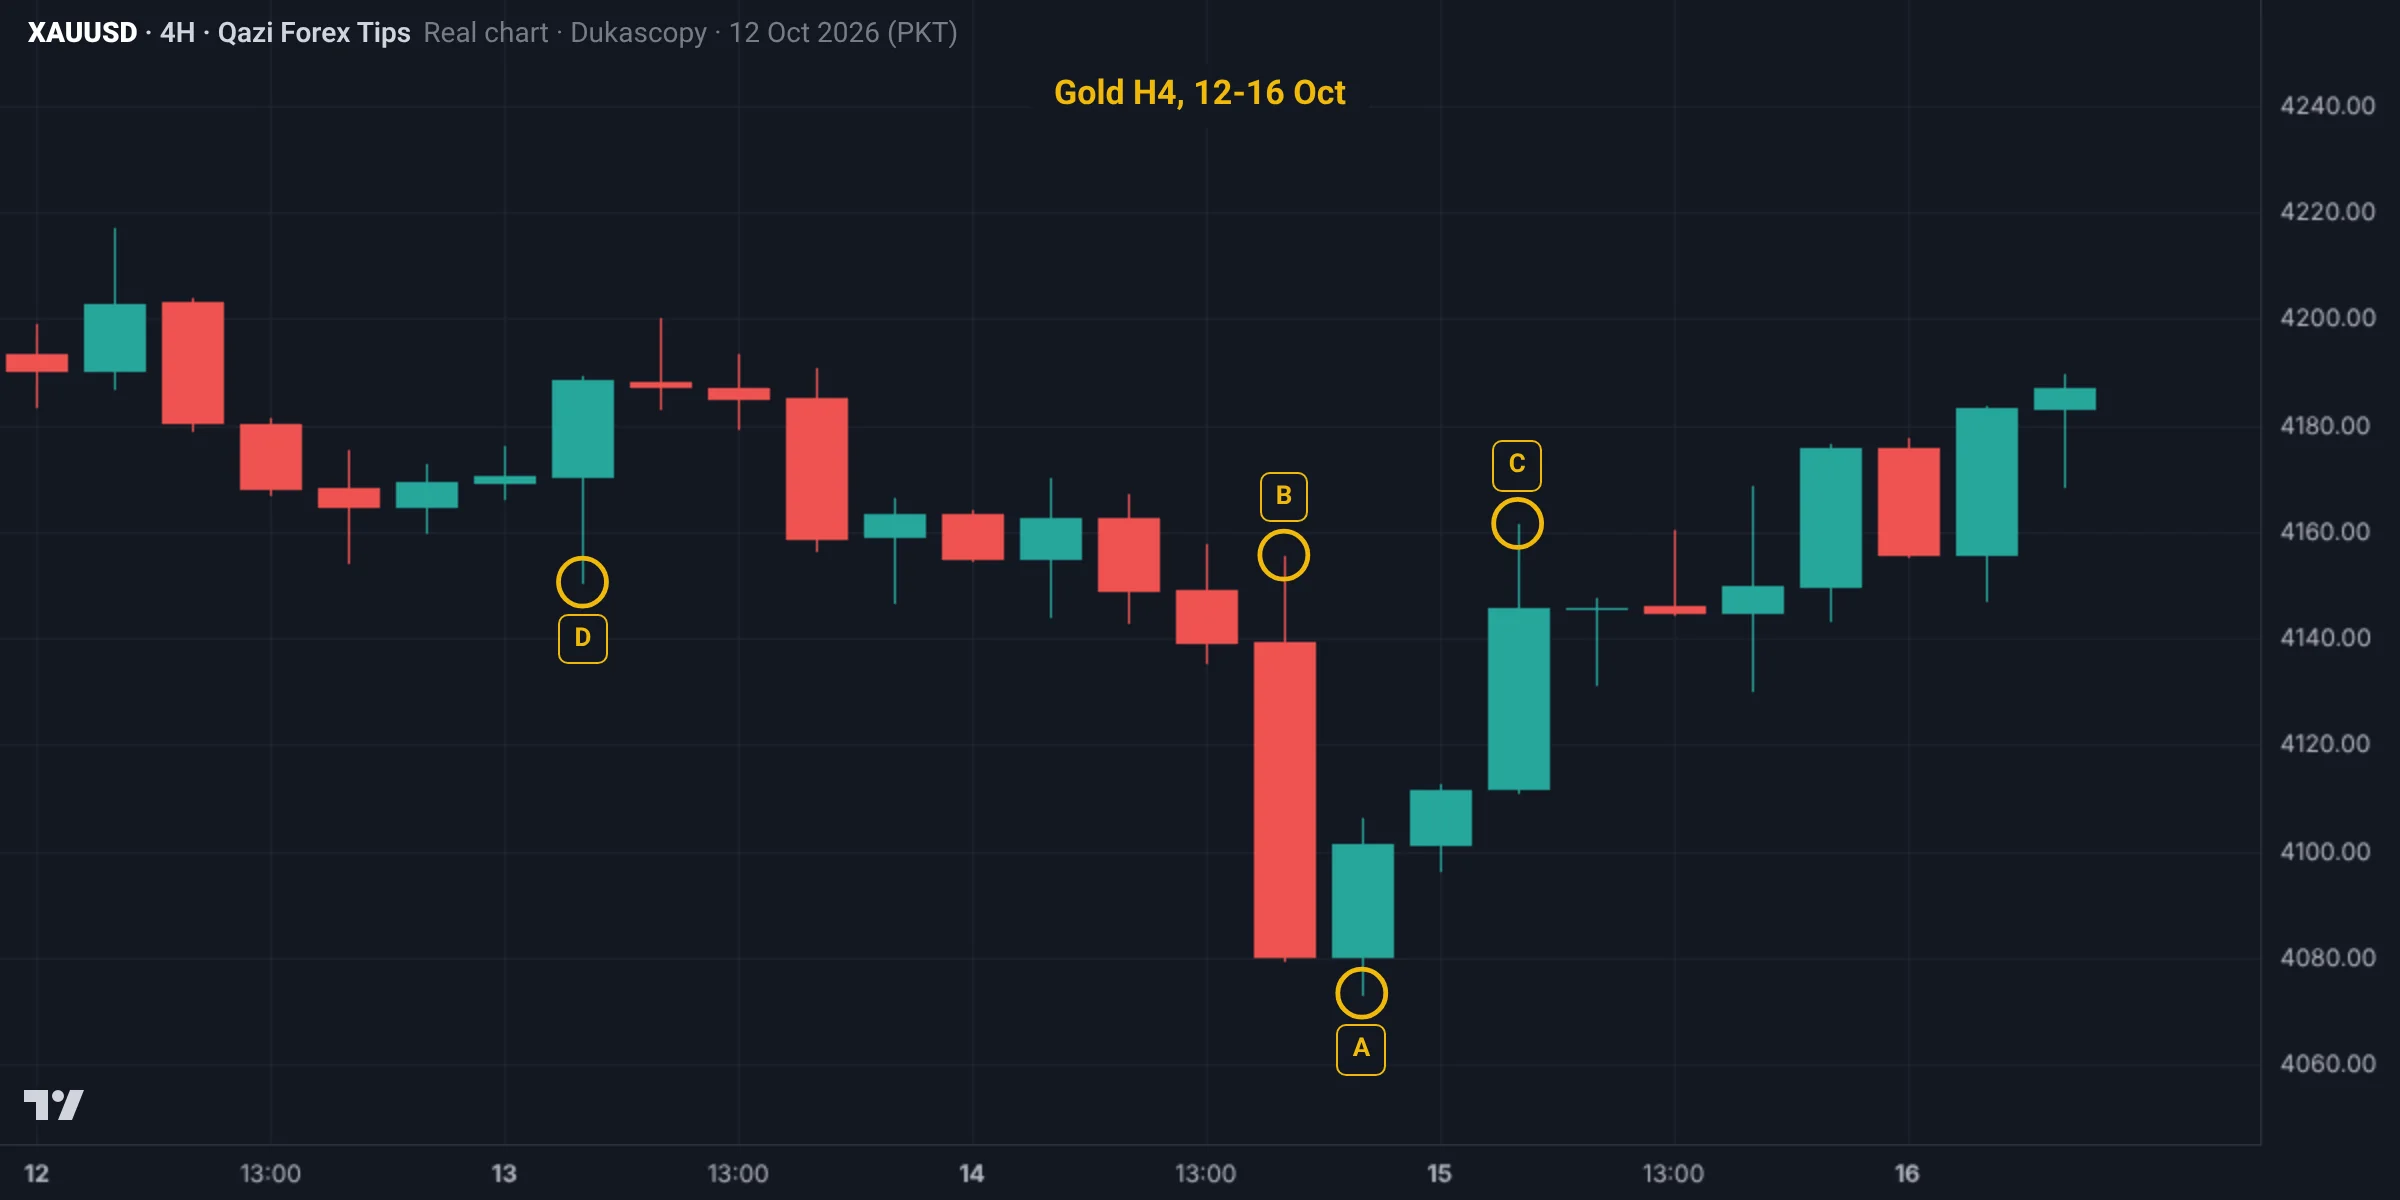
The 17:00 H4 candle on 14 Oct has a high of 4,155.6 and a low of 4,079.4. Which candle is candle 2 of this bullish CRT?
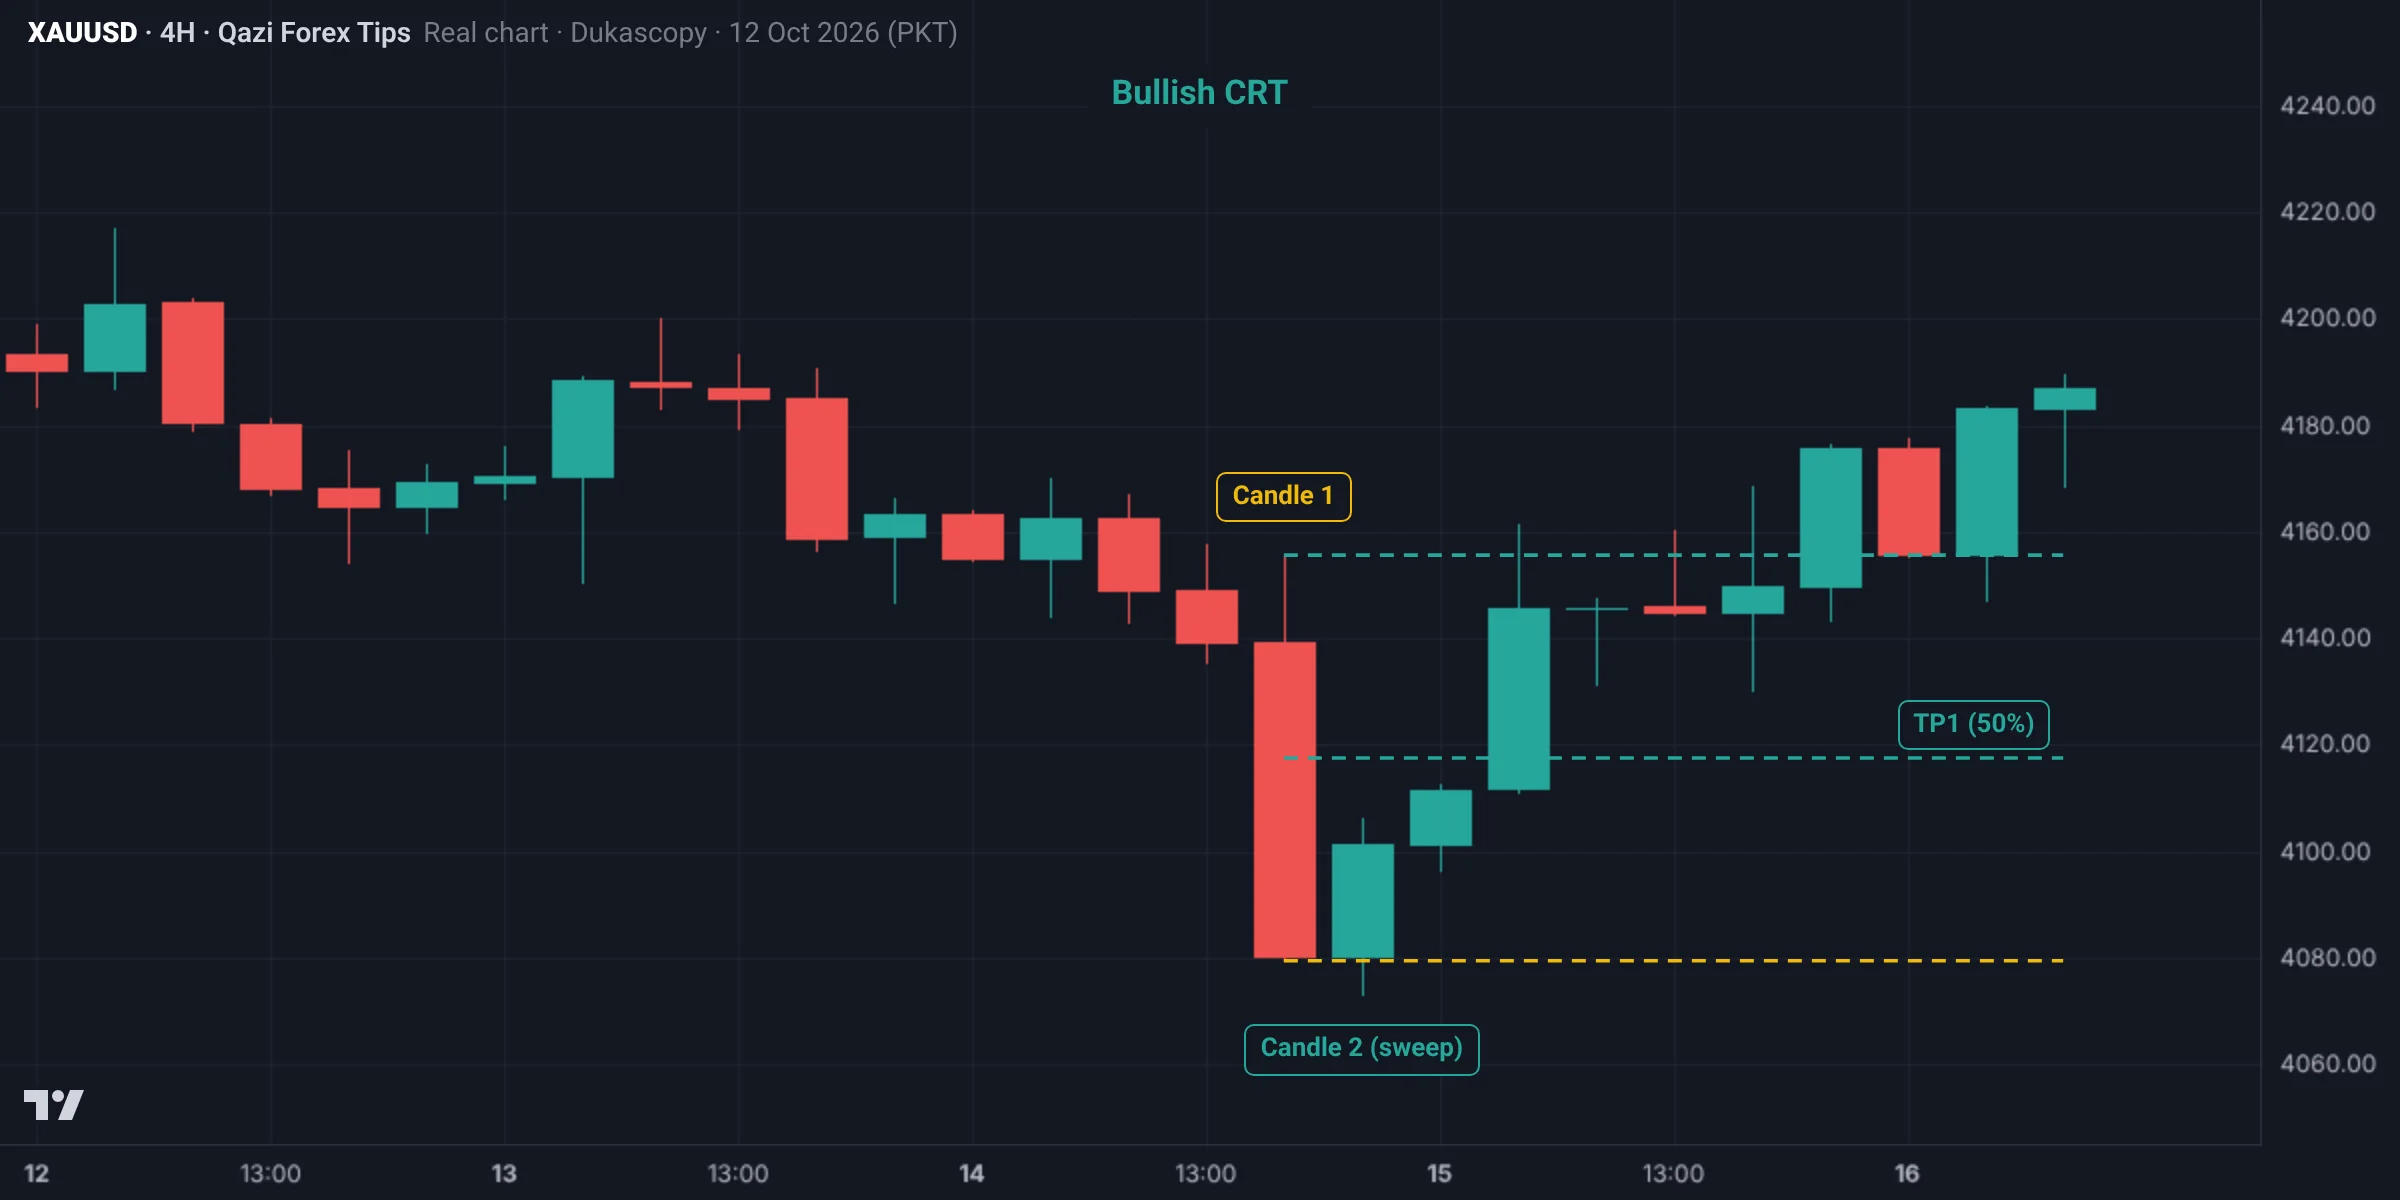
A (21:00 on 14 Oct): its low of 4,073.3 swept candle 1's low, its high (4,106.4) stayed below candle 1's high, and it closed back inside candle 1's range at 4,101.5. TP1 at 50% (4,117.5) and TP2 at candle 1's high (4,155.6) were both hit on 15 Oct. B is candle 1 itself, C a later move, D an older candle.
The marked chart
Test yourself: Lesson 5.4 quiz
9 questions. Pick one answer for each and you will see at once whether it is right and why. Your score and grade appear at the end. You need 70% to pass.
0 correct · 0 / 9
Question 1What idea do all SMC models share?
The difference is only the situation: A, B, C, D, E.
Question 2Which situation is model C for?
Don't take model C when the trend is extended and price is in higher timeframe premium.
Question 3When models A and D form in the same place, what is the difference?
Model D: low, high, lower low (sweep), break of the high, then the breaker retest.
Question 4In a bullish CRT, what must candle 2 do?
If candle 2 closes below the low the CRT is cancelled; if it takes both sides it is not a CRT.
Question 5What are the targets of a bullish CRT?
The SL goes below candle 2's swept low.
Question 6How does CRT connect to the Power of 3?
H4 candles work well on Gold; ICT-style H4 candles count from New York midnight.
Question 7Why is CRT alone weak?
Filters: a sweep of significant liquidity, bias agreement, an LTF CHoCH and FVG, a killzone.
Question 8What is the advice for learning the models?
One model, one instrument, one session.
Question 9Gold CRT: candle 1 high 4,146, low 4,110; candle 2 drops to 4,103 and closes 4,114. Where is TP1?
Entry 4,113, SL 4,101; close half at TP1 and move to break-even, TP2 at 4,146 (about 1:2.75).
Lesson checklist
Tick each point once you understand it. Your ticks are saved in this browser.
Assignment
- Find every bullish and bearish CRT on Gold H4 last month.
- Check how many reached the 50% and how many reached the other edge.
- Find 10 model C and 10 model D examples on M15.
- Record the win rate and average R of all three models.
- Decide which model you will adopt first and explain why in the group.
Post your assignment screenshots with your reasons in our free Facebook group, where your charts will be checked.
Join the free group
Who wrote this lesson
Dr. Qazi Abdul Basit, Ph.D
Ph.D in Business Administration and a forex and Gold trader since 2013. Founder of Qazi Forex Tips, which teaches traders in Pakistan and India price action, risk management and trading psychology in their own language: 65 student batches so far, free courses on YouTube, and MT5 tools for traders (QFT Replay Simulator, QFT Trade Assistant).
- 2013 trading since
- 75K+ Facebook group members
- 65 student batches
- 15K+ YouTube subscribers
How this lesson was made: the content follows Dr. Qazi's teaching method and years of trading. Real charts are built from Dukascopy Gold (XAUUSD) data, and backtest results are shown as they came out, even when negative. We do not sell signals, manage accounts or take money from any broker. Last updated: 19 November 2026.
Questions
What is Candle Range Theory?
Each candle is a range; when the next candle sweeps one extreme and closes back inside, price often targets the opposite extreme.
When is a CRT cancelled?
When candle 2 closes beyond the swept edge, or takes both edges.
Which model should a new trader learn first?
Model A or B; add another after 50 backtest trades on the first.
What does CRT mean in trading?
CRT stands for Candle Range Theory: when price sweeps one edge of the previous candle and closes back inside its range, the target is that candle's other edge.
Is CRT enough on its own?
In our two-month backtest (lesson 7.1) CRT on its own was negative. Use it with a filter such as bias, a killzone or a POI.
Read more
Education only, not financial advice. Trading forex, Gold and CFDs carries a high risk of loss. SMC concepts describe tendencies, not guarantees. Lesson 31 of 38.