 Qazi Forex Tips

The problem: zones everywhere
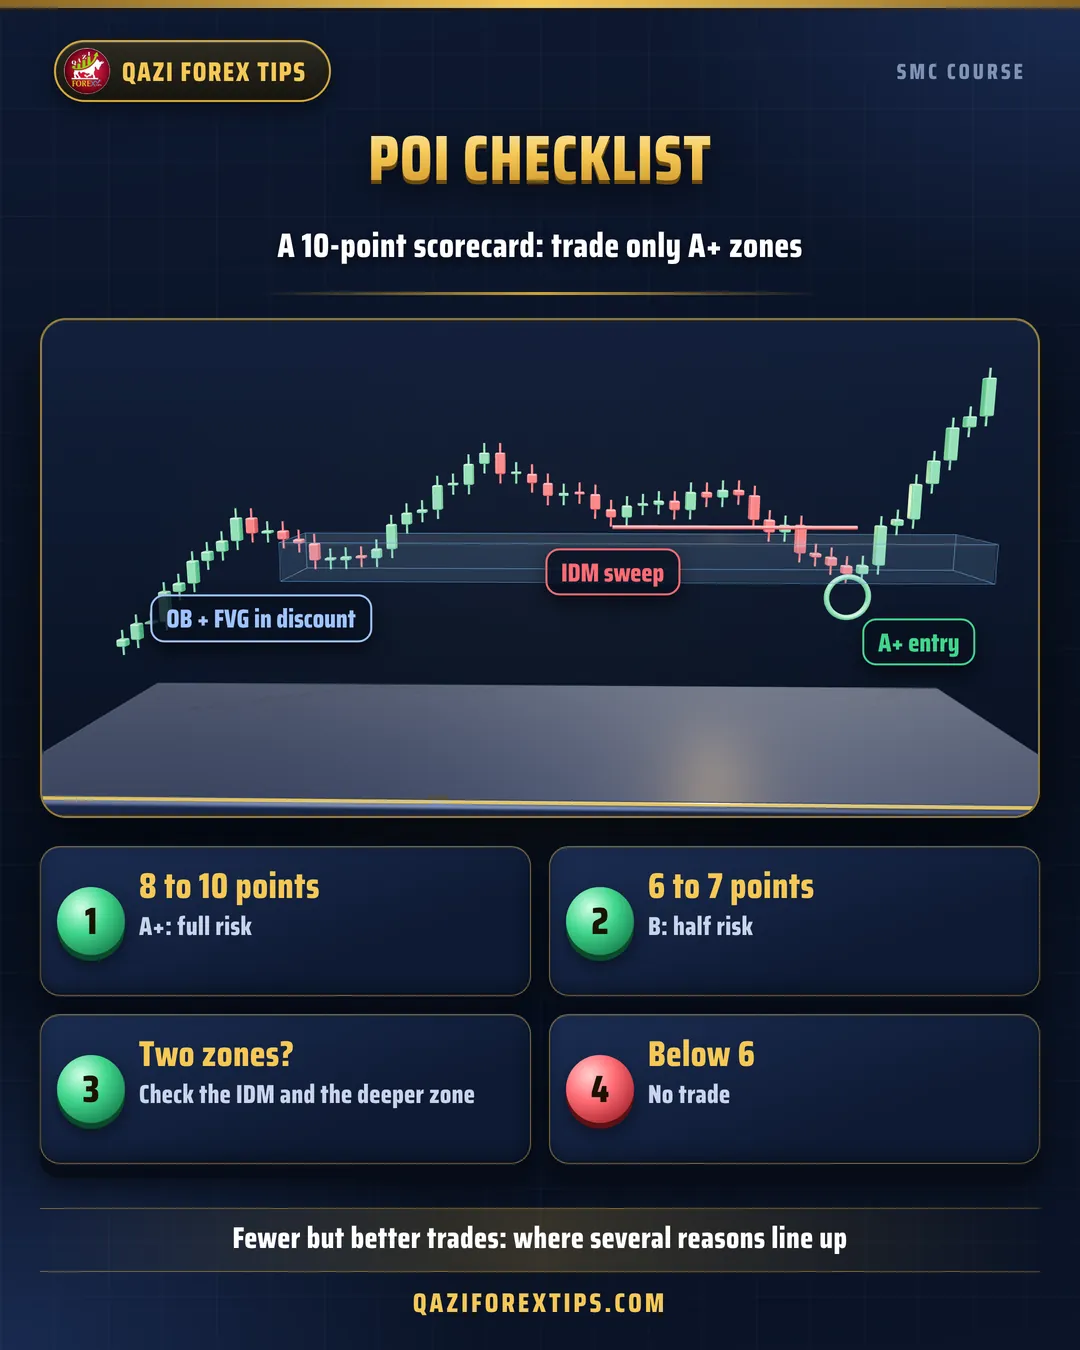
Once a new SMC trader learns the concepts, order blocks and FVGs appear everywhere on the chart. The result is too many trades, most of them losers. The professional difference is taking fewer trades, only where several reasons line up. This is called confluence.
The POI scorecard (10 points)
Score every POI with this table:
| Points | Question | Where you learned it |
|---|---|---|
| 2 | Is the POI in the direction of the higher timeframe (H4, H1) bias? | Phase 1 |
| 1 | Is a bullish POI in discount (or a bearish one in premium)? | Lesson 3.6 |
| 1 | Is the POI, or part of it, in the OTE (62% to 79%)? | Lesson 3.6 |
| 2 | Was liquidity (IDM or a swing) swept before the POI? | Lesson 1.6 and Phase 2 |
| 1 | Did the move from the POI make a BOS or MSS? | Phase 1 |
| 1 | Did the displacement leave an FVG, or are an OB and FVG together? | Lessons 3.1 and 3.2 |
| 1 | Is the zone unmitigated (first touch)? | Lesson 3.1 |
| 1 | Is there a clear draw on liquidity ahead with at least 1:2 RR? | Lesson 2.5 |
Decision: 8 to 10 points is an A+ POI: trade with full risk. 6 to 7 is a B: half risk or only with strong confirmation. Below 6: skip it.
Which POI when?
| Situation | Best POI |
|---|---|
| Trend running, waiting for a pullback | OB + FVG in the OTE; or a propulsion block |
| Possible trend change, liquidity swept | Breaker block, IFVG |
| Trend weakening, higher low or lower high | Mitigation block |
| Long wicks at a key high or low | Rejection block |
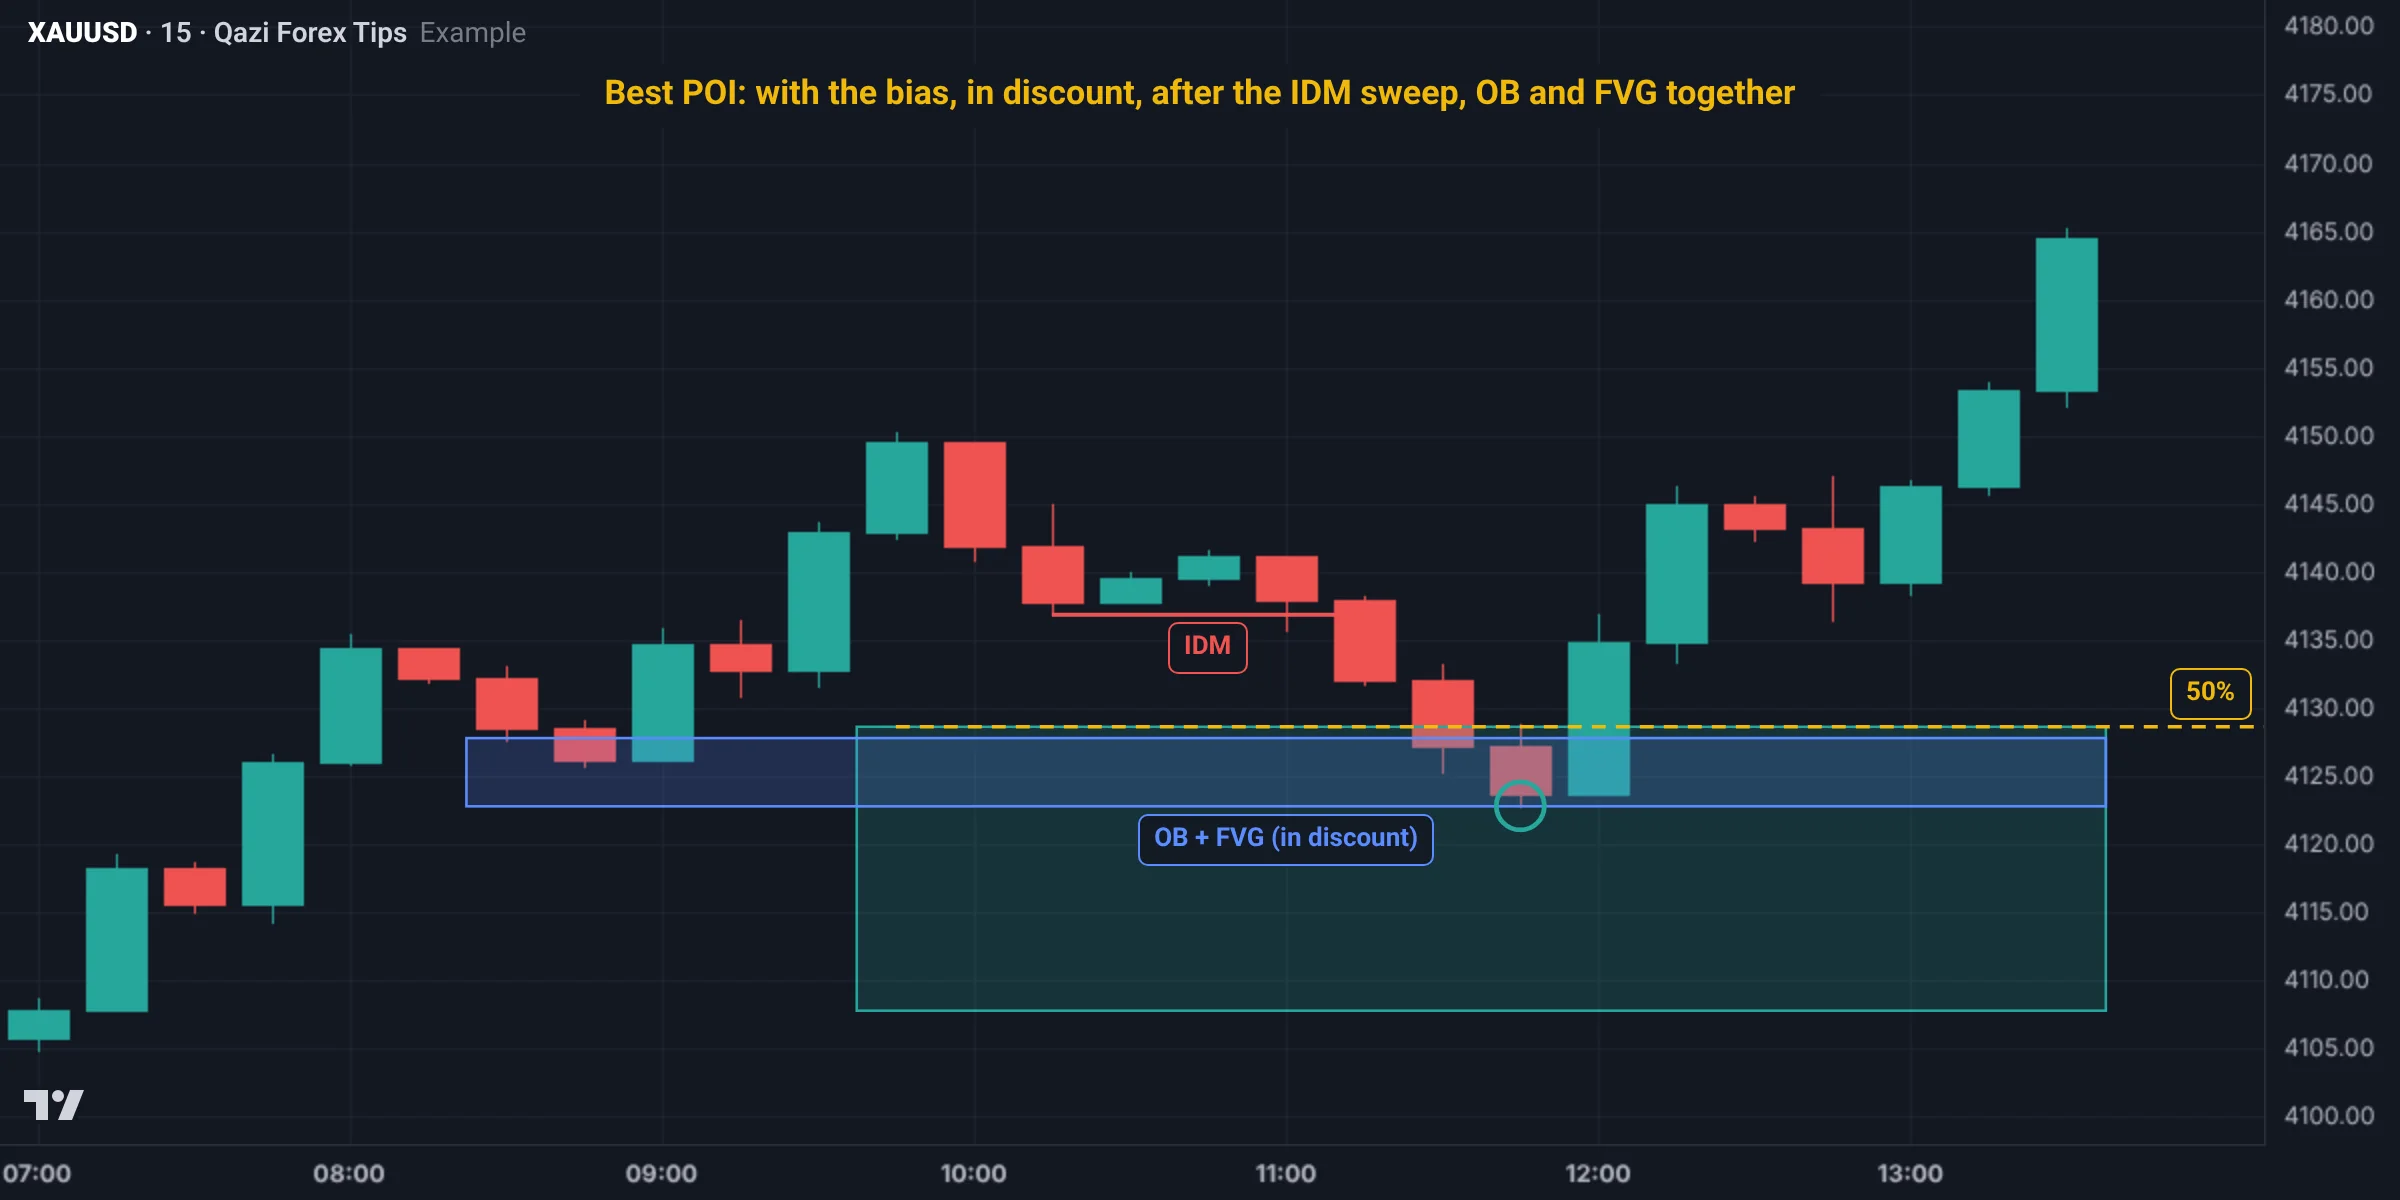
| Several zones in one place | The one after the IDM sweep and deepest in discount |
Two POIs: which one?
Often there are two bullish zones: a near one (higher) and a deep one (lower). The rule:
- Check the IDM: if there is a clear small low (IDM) near the upper zone that has not been swept yet, the near zone is often a trap. Price will break it, take the IDM and reach the deeper zone.
- Check discount: the zone that is deeper and in the OTE is better.
- Extreme POI: the zone at the very start of the move (where the BOS move began) is the safest, because breaking it changes the structure itself.
- If you are unsure, use small risk on the near zone and full risk on the deep zone, or wait only for the deep one.
The full process: from bias to entry
- H4: bias and dealing range. Premium or discount?
- H1: draw on liquidity: where is the next target?
- M15: list the POIs and score them. Keep only A+ and B.
- Wait: set alerts and let price come to the POI.
- M1 or M5: a liquidity sweep and CHoCH inside the POI, then enter from the small order block or FVG.
- Risk: stop beyond the POI, lot size from 1% to 2% account risk, rounded down.
- Management: partial profit at the first liquidity and stop to break-even; the rest to the main target.
- Journal: score, screenshot, result.
A full Gold example
- H4: bullish bias. Range 4,100 to 4,170, equilibrium 4,135.
- H1: equal highs at 4,170: buy-side liquidity, the draw on liquidity.
- Two POIs on M15:
- Zone A: bullish order block 4,138 to 4,143. It is in premium, and an IDM at 4,131 below is still unswept. Score: 2 for bias, low on the rest because of premium: 4/10, skip.
- Zone B: bullish order block + FVG 4,118 to 4,124, in the OTE (62% = 4,126.6, 79% = 4,114.7), after the IDM sweep, at the start of the BOS move, unmitigated. Score: 10/10, A+.
- Price takes the 4,131 IDM, breaks zone A, and reaches 4,121. CHoCH on M1.
- Entry 4,122, stop 4,114, risk $8. Target 4,170, $48: 1:6.
- 1% risk on a $1,000 account = $10. 10 ÷ 8 = 1.25, so 0.01 lot (round down).
Real Gold chart examples
Gold M15 on 9 Nov 2026 (data: Dukascopy, bid price; Pakistan time). Score that day's POI with the scorecard:
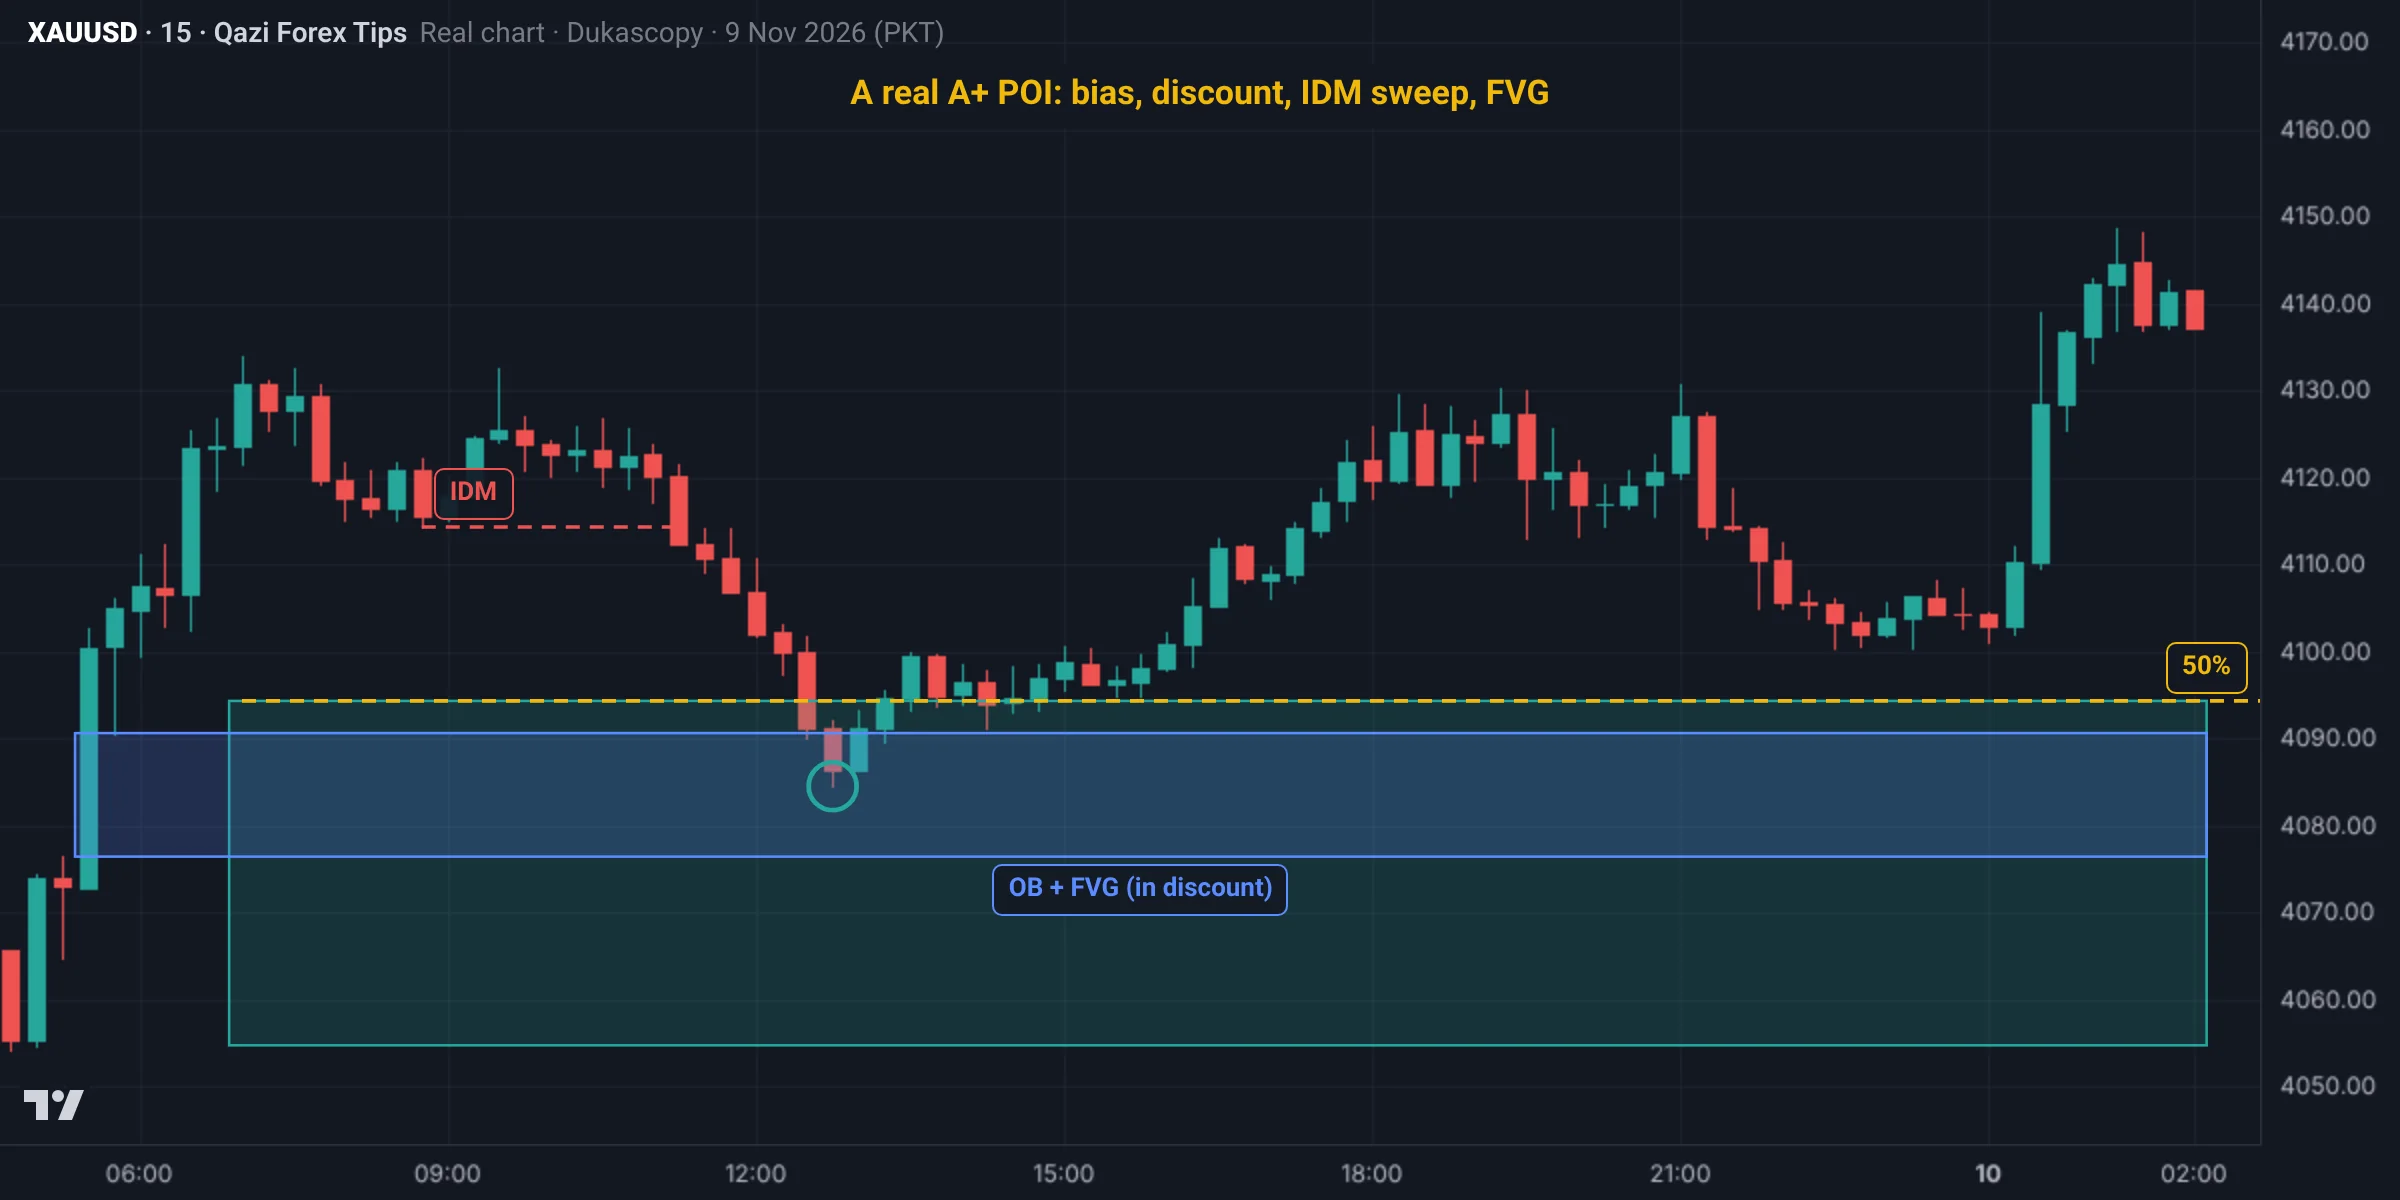
| Question | That day | Points |
|---|---|---|
| With HTF bias? | H4 bullish (the 5 Nov HH) | 2 |
| In discount? | Yes, below the 50% of the leg (4,054.7 to 4,133.9) at 4,094.3 | 1 |
| In the OTE? | 4,084.5 at about 62% | 1 |
| Liquidity swept first? | Yes, the 4,114.3 IDM broke at 11:15 | 2 |
| BOS? | Yes, the 6 Nov high at 4,081.0 broke | 1 |
| FVG? | Yes, 4,076.4 to 4,090.6 | 1 |
| Unmitigated? | Yes, first touch | 1 |
| DOL and RR? | BSL above 4,146.8 | 1 |
Total: 10/10. Price reached 4,084.5 at 12:45 and went on to 4,148.6 the next night. (The chart runs to 02:00 the next night; price was around 4,140 then.)
Second example: scoring a bearish POI (11 Nov)
Gold H1 on 10 and 11 Nov 2026 (data: Dukascopy, bid price; Pakistan time). This time we test a bearish POI on the scorecard:
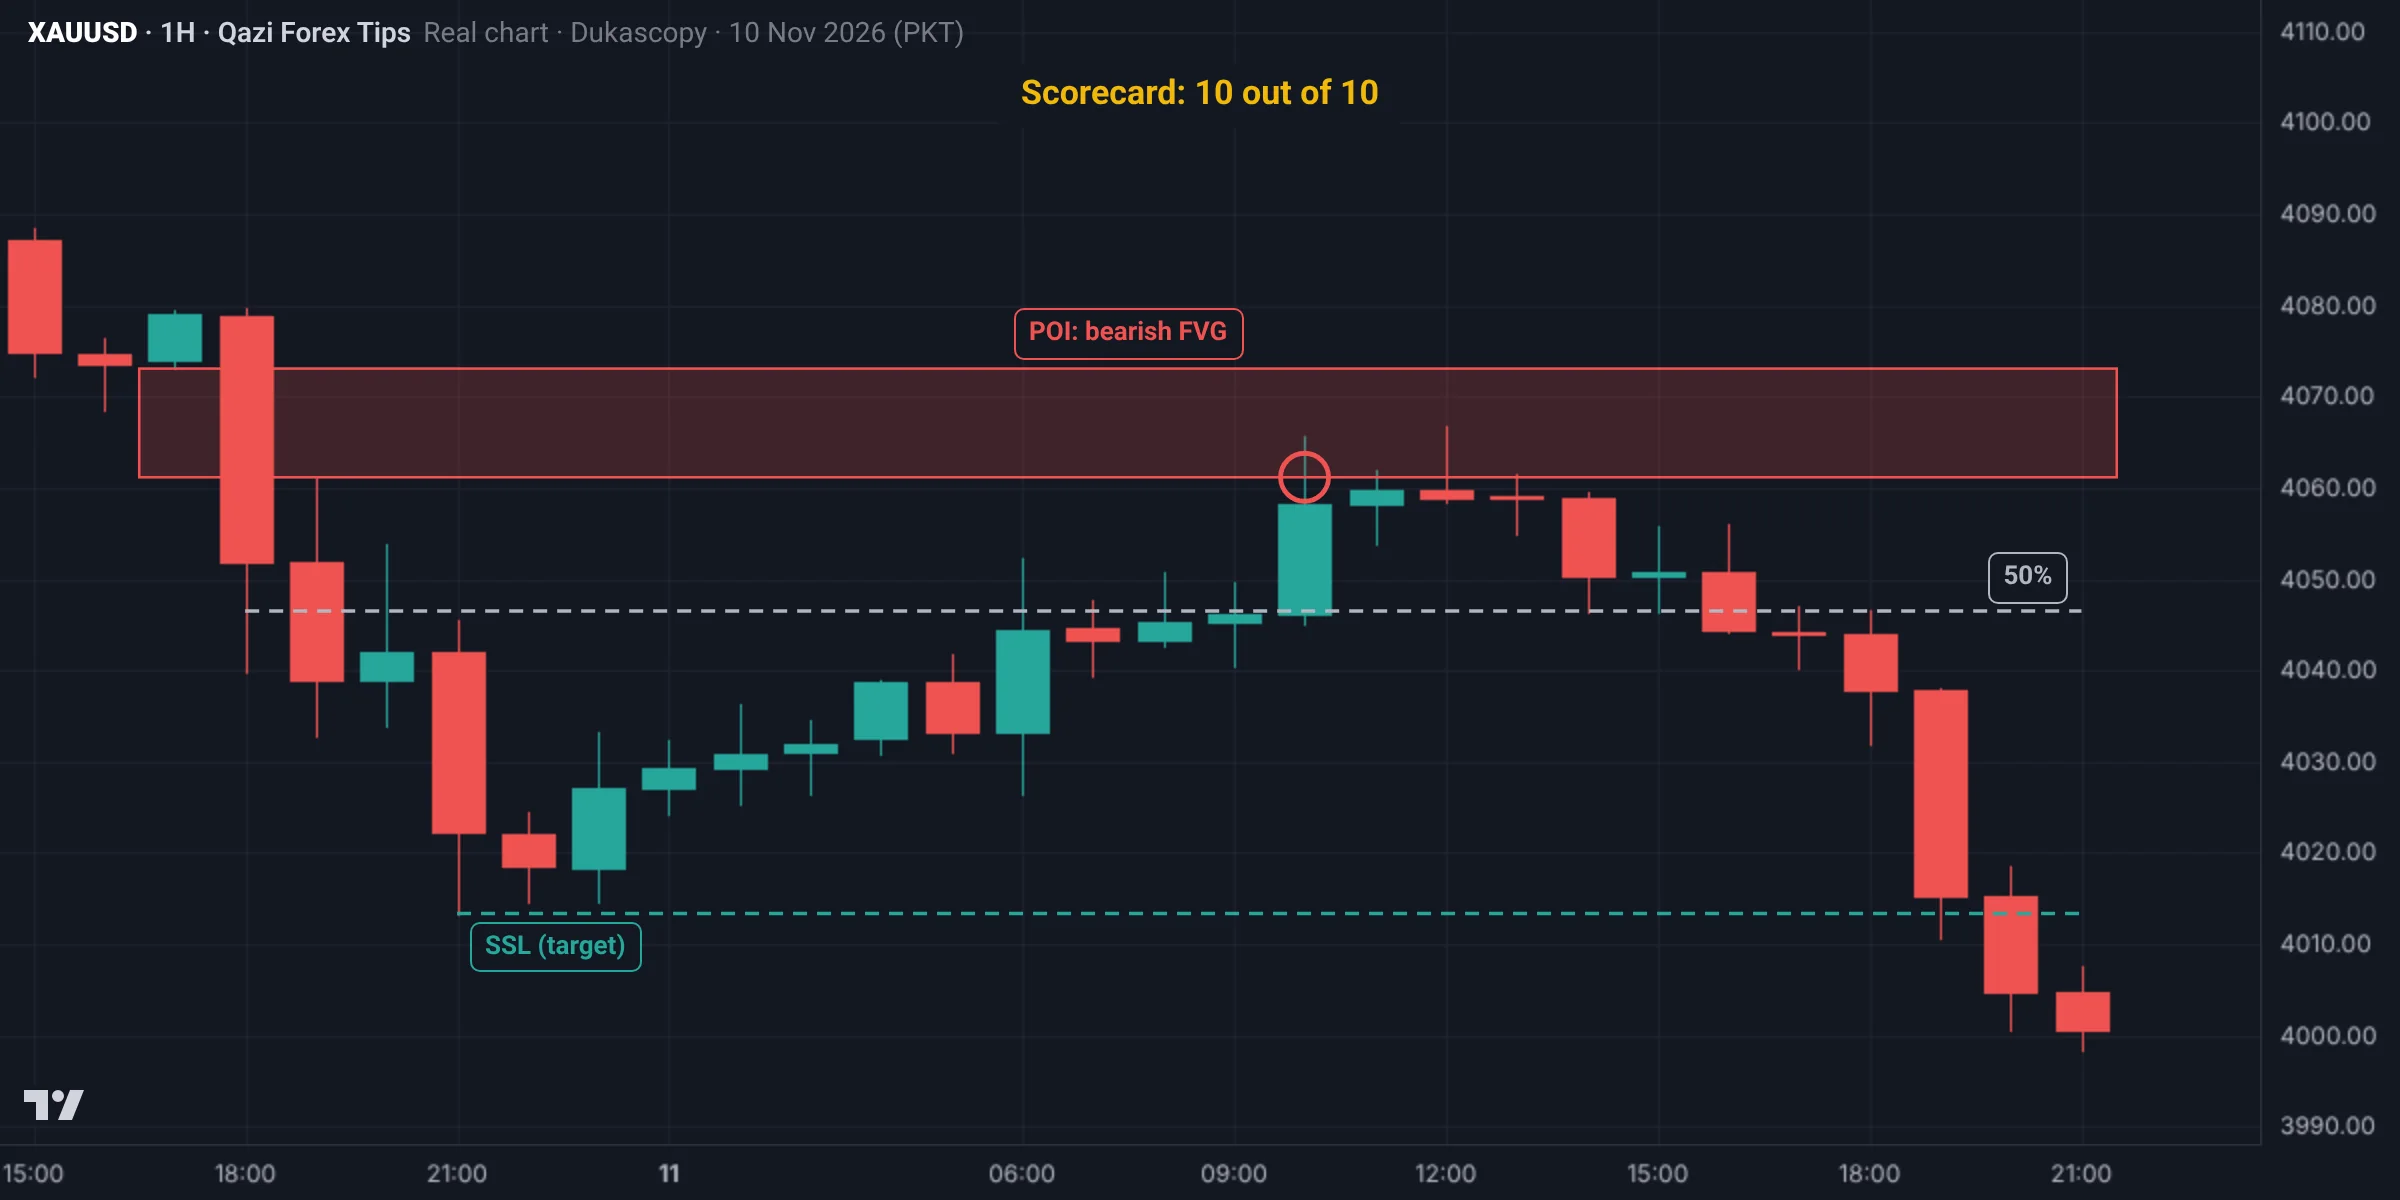
The drop on the evening of 10 Nov left a bearish FVG from 4,061.2 to 4,073.1. Range: high 4,079.6 to low 4,013.4.
| Condition | Points |
|---|---|
| In the H1 bias direction (bearish, the 10 Nov CHoCH) | 2 |
| In premium (50% = 4,046.5) | 1 |
| Overlaps the OTE (4,054.5 to 4,065.7) | 1 |
| Liquidity swept first: the Asian high at 4,052.4 | 2 |
| The move from the zone made a BOS | 1 |
| Displacement left an FVG | 1 |
| First touch (10:30) | 1 |
| SSL ahead at 4,013.4, RR about 1:3.7 | 1 |
| Total | 10/10 (A+) |
Result: at 10:30 on 11 Nov price entered the zone (highest 4,066.8, the zone high did not break). Selling at the zone bottom 4,061.2 with a stop above the zone at 4,074.1 (risk $12.9), the SSL at 4,013.4 was reached at 19:30: about +3.7R. A+ is not a guarantee, but this is the kind of zone worth waiting for.
Common mistakes
Phase 3 gate: before moving on
Before moving to Phase 4 (Time: sessions, killzones, Silver Bullet) you should be able to:
- Identify order blocks, FVGs, breakers and mitigation blocks separately on any Gold chart within 5 minutes.
- Tell a breaker from a mitigation block with one question: was there a sweep?
- Calculate equilibrium and OTE prices for any move yourself.
- Backtest 20 POIs with the scorecard and record the A+ and B results in your journal.
- Calculate the lot size of every trade from your risk.
When this is complete, the next phase is time, because the right POI works even better at the right time.
Summary
- Fewer but better trades: only POIs where several reasons line up.
- The 10-point scorecard: trade at 8+, be careful at 6 to 7, skip below 6.
- With two zones, check the IDM and discount; the deeper zone after the sweep is better.
- Every POI entry needs confirmation, a stop loss and a proper lot size.
Free downloads
Print them or keep them on your phone. No sign-up, no email.
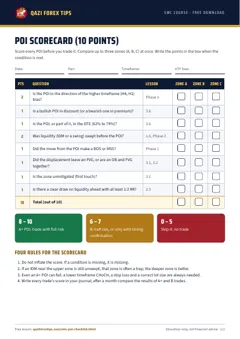
POI Scorecard (printable)
The 10-point scorecard: compare three zones at once and decide A+, B or skip. PDF, 1 page.
Free downloadاردو میںSpot it on the chart: practice
This is a real Gold chart (Dukascopy data, Pakistan time). Study it and pick an answer. After you answer, the fully marked chart and the explanation appear.
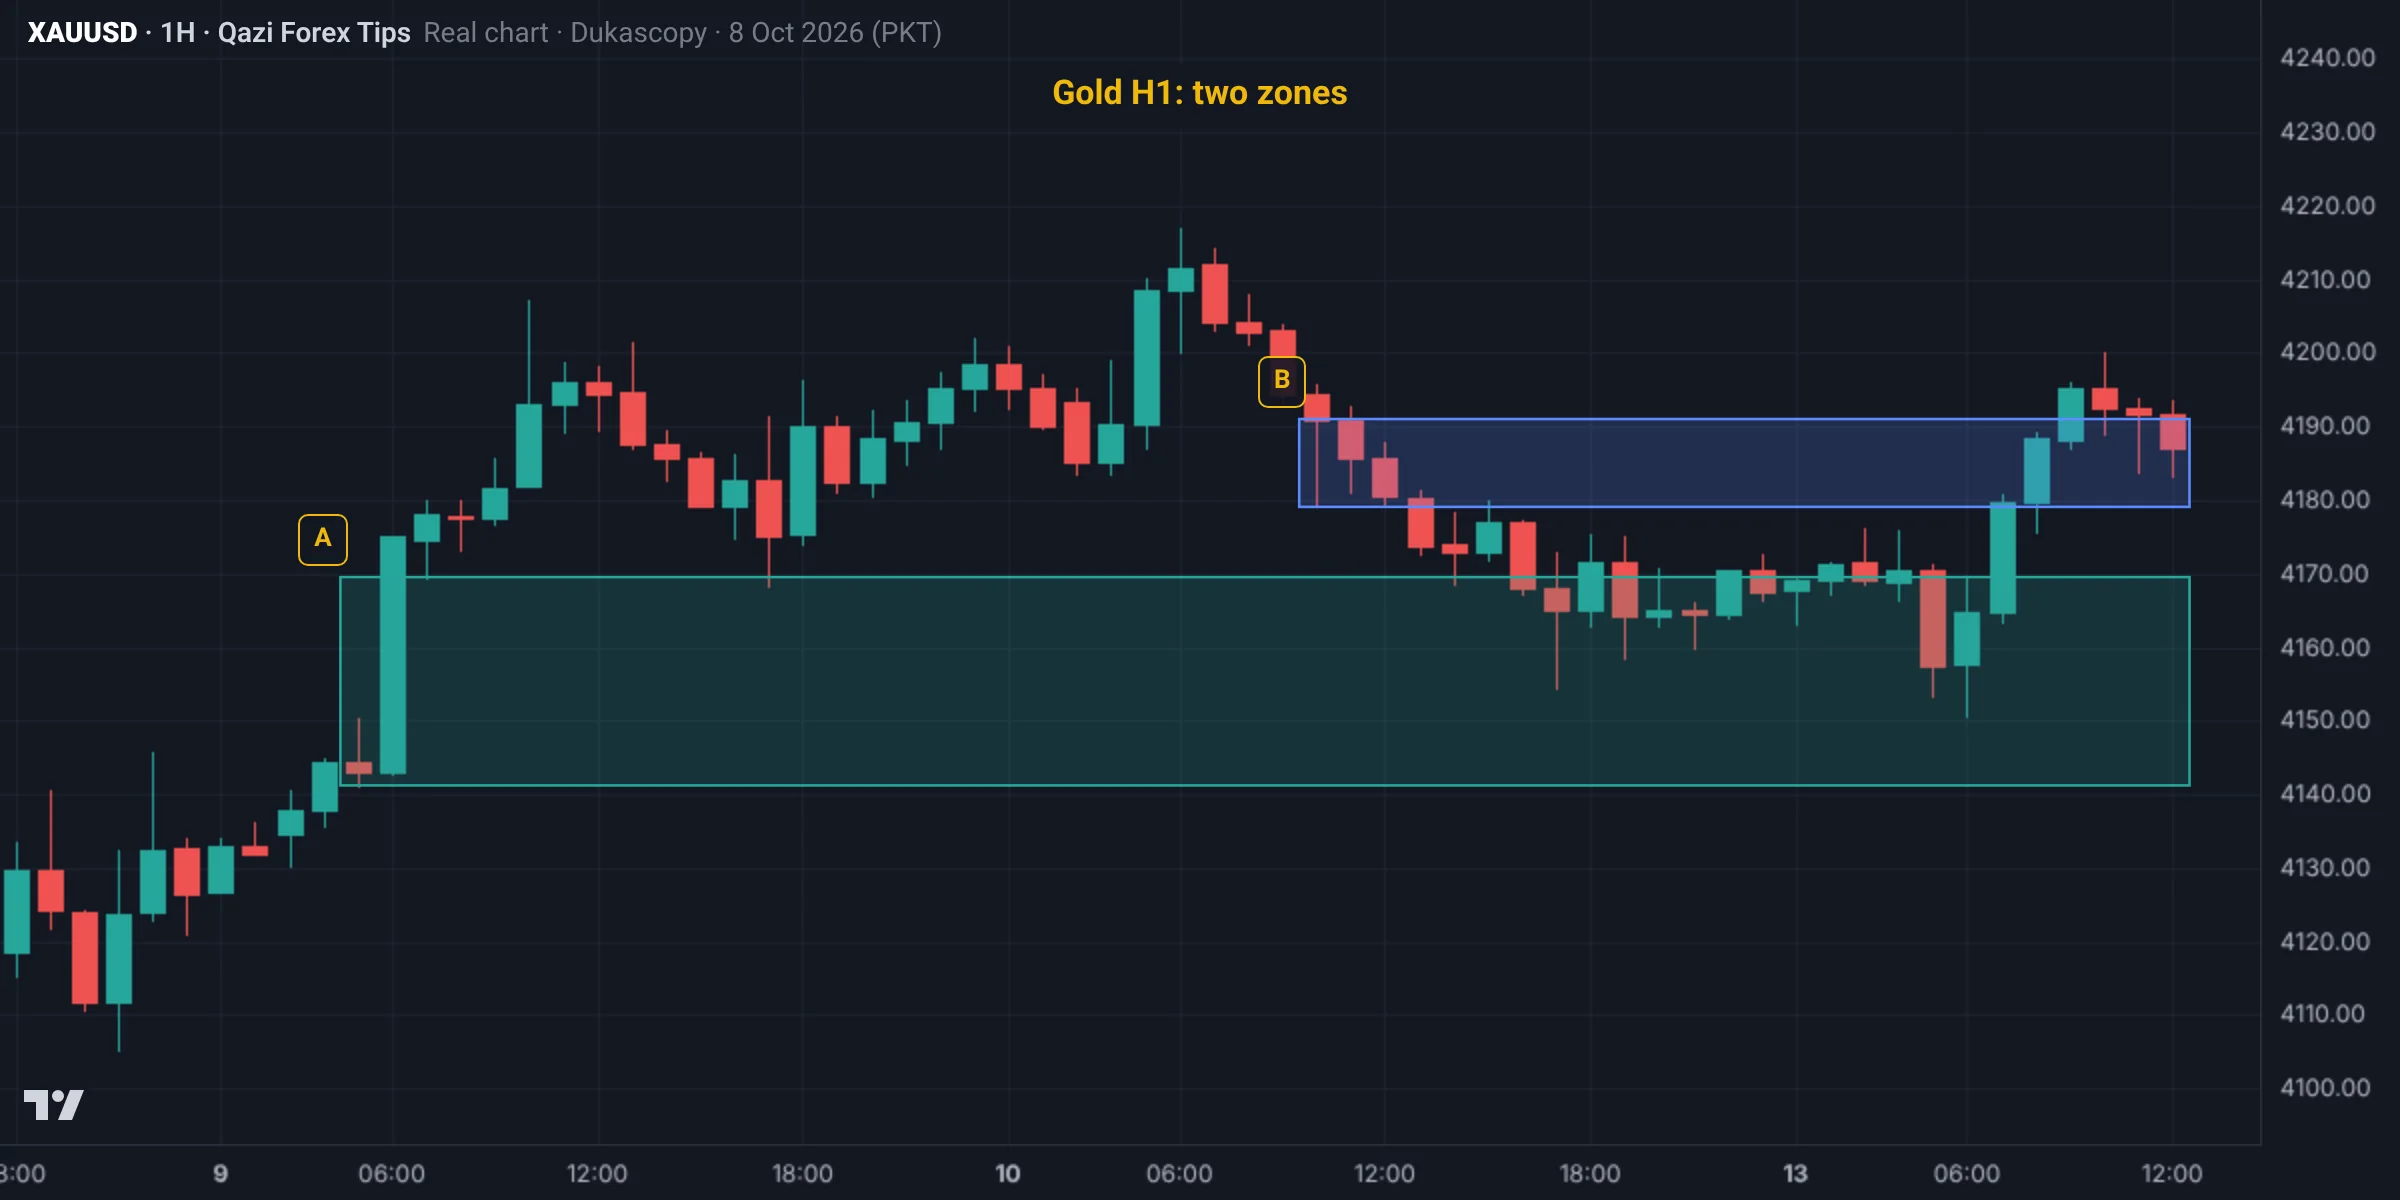
On 12 Oct there are two bullish zones. Which zone is better by the POI scorecard?
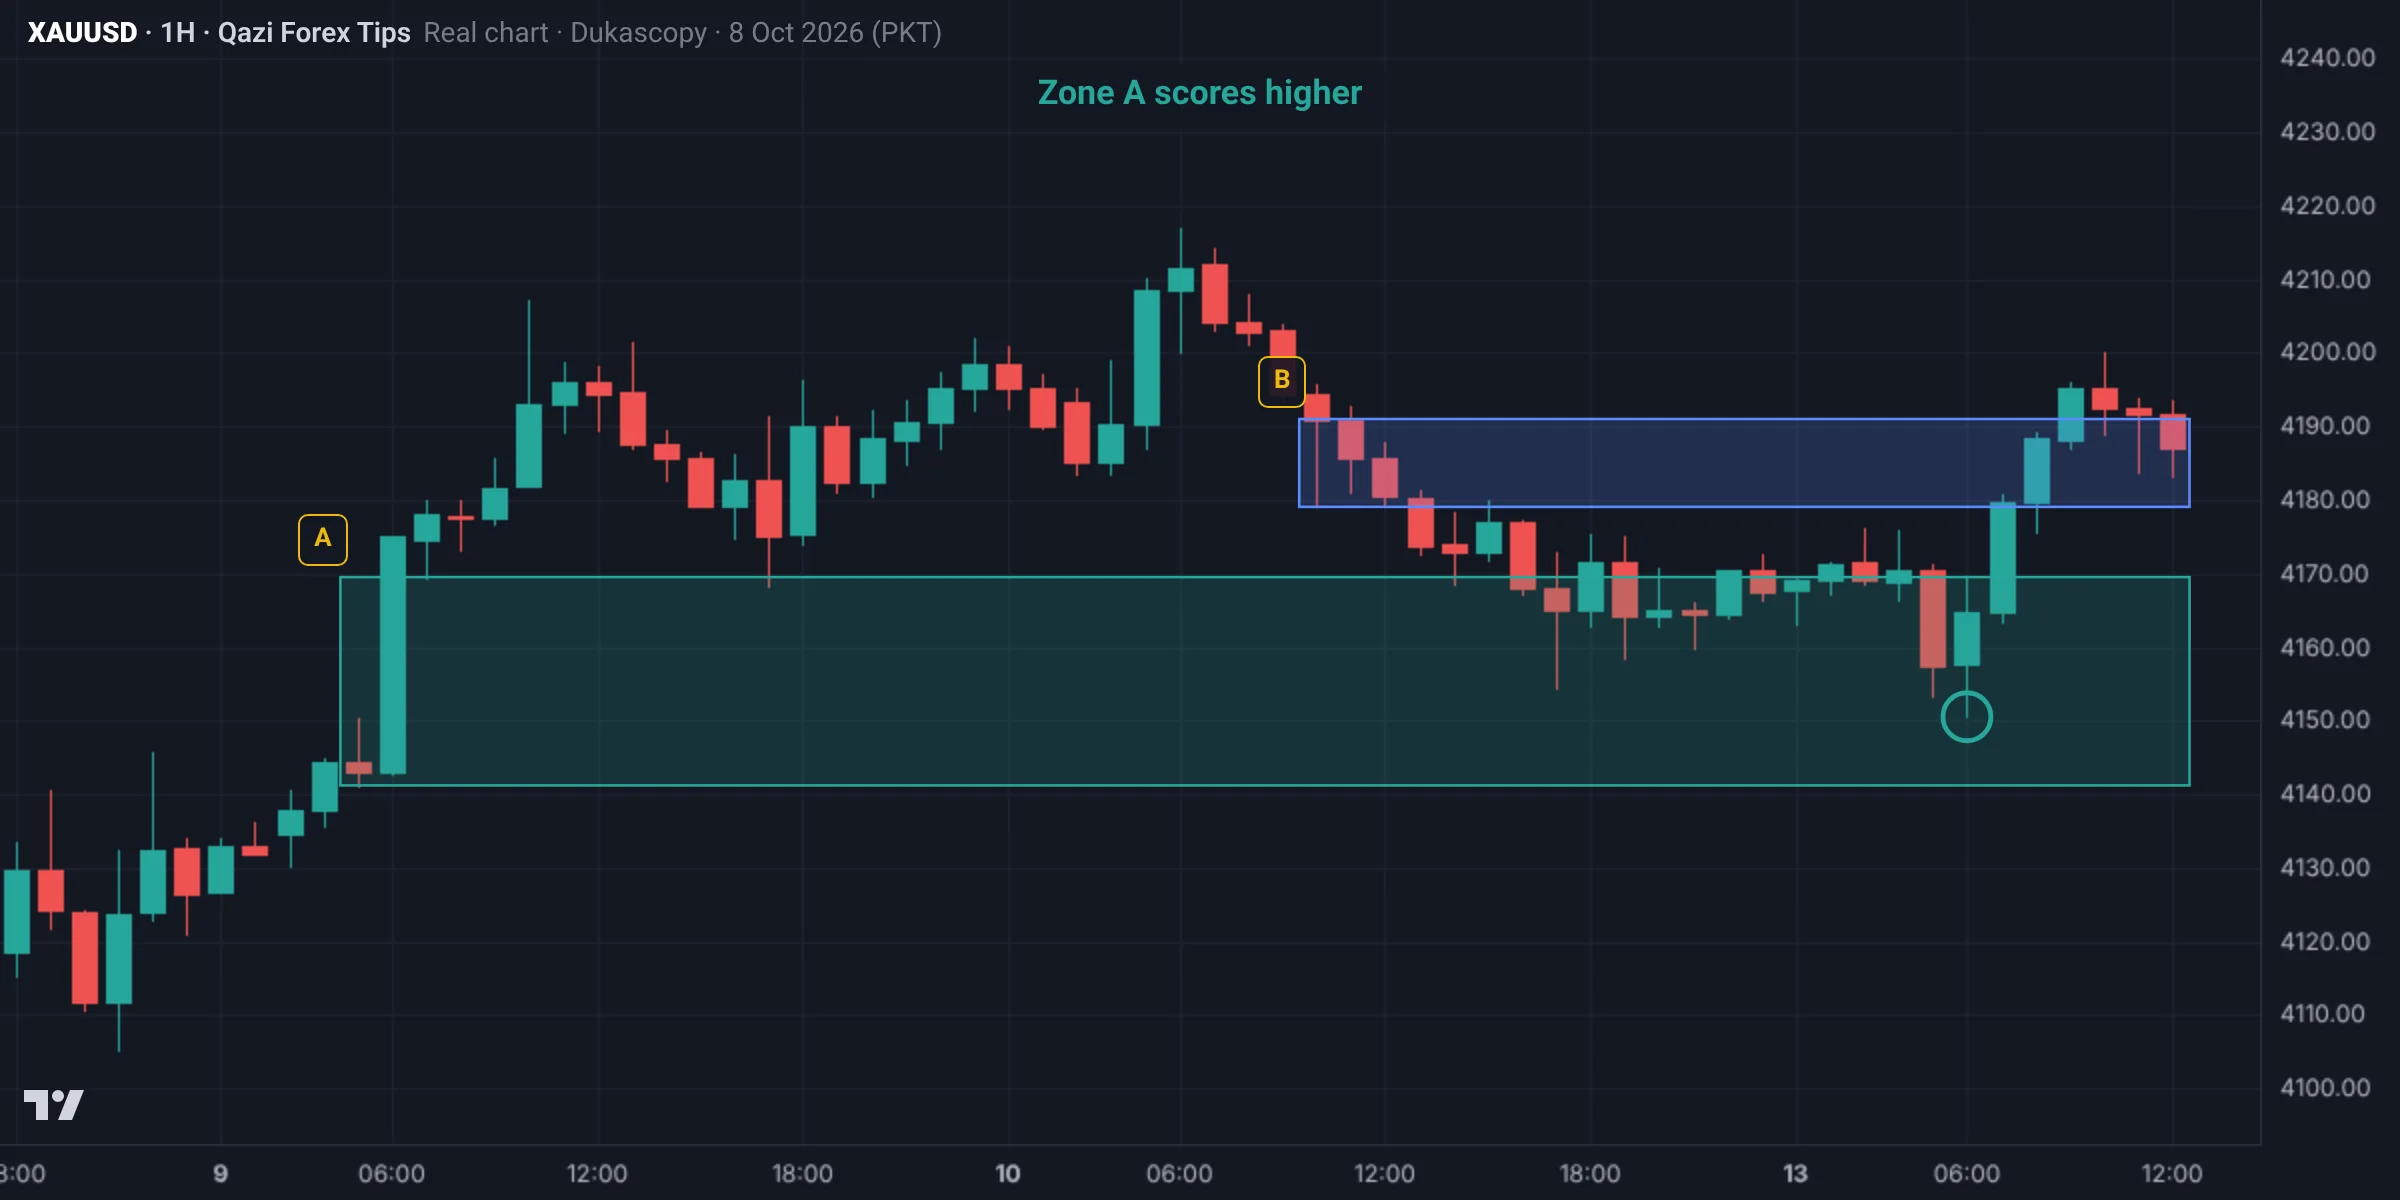
Zone A (4,141.2 to 4,169.5) is the origin of the BOS move, has an FVG, sits in discount and is untouched. Zone B (4,179.1 to 4,191.0) is a small premium zone with no BOS behind it. Price cut through B and turned up from the top of A (4,150.5).
The marked chart
Test yourself: Lesson 3.7 quiz
9 questions. Pick one answer for each and you will see at once whether it is right and why. Your score and grade appear at the end. You need 70% to pass.
0 correct · 0 / 9
Question 1What does confluence mean?
The professional difference: fewer trades, only where several reasons line up.
Question 2Which two scorecard questions are worth 2 points?
The other questions are worth one point each; 10 in total.
Question 3What if a POI scores 8 to 10?
6 to 7 = B (half risk or strong confirmation); under 6 = skip.
Question 4A POI scores 5. What is the decision?
No trades on POIs that score below 6.
Question 5When a trend change is possible and liquidity has been swept, which POI is best?
Running trend: OB + FVG in the OTE or a propulsion block; weakening trend: mitigation; long wicks: rejection.
Question 6Two bullish zones: a near one (with an unswept IDM nearby) and a deep one. What usually happens?
If unsure, small risk on the near zone and full risk on the deep one, or wait for the deep one only.
Question 7Why is the extreme POI the safest?
The deeper zone inside the OTE is better.
Question 8Gold example: zone A (4,138 to 4,143) in premium with an unswept IDM at 4,131 below; zone B (4,118 to 4,124) in the OTE after the IDM. Which was traded?
Zone A scored 4/10 (skip), zone B 10/10 (A+).
Question 9How do you get better with the scorecard?
Print the scorecard and keep it next to your screen.
Lesson checklist
Tick each point once you understand it. Your ticks are saved in this browser.
Assignment
- Copy or print the scorecard.
- Find 20 POIs on the last two weeks of Gold M15 and score each.
- Compare the results of A+ (8+), B (6 to 7) and weak (below 6) POIs.
- Find 3 cases where the near zone broke because of the IDM and the deep zone worked.
- Write a full plan for one A+ example: bias, DOL, POI, entry, stop, target, lot.
- Post your results in the group: what was your A+ win rate?
Post your assignment screenshots with your reasons in our free Facebook group, where your charts will be checked.
Join the free group
Who wrote this lesson
Dr. Qazi Abdul Basit, Ph.D
Ph.D in Business Administration and a forex and Gold trader since 2013. Founder of Qazi Forex Tips, which teaches traders in Pakistan and India price action, risk management and trading psychology in their own language: 65 student batches so far, free courses on YouTube, and MT5 tools for traders (QFT Replay Simulator, QFT Trade Assistant).
- 2013 trading since
- 75K+ Facebook group members
- 65 student batches
- 15K+ YouTube subscribers
How this lesson was made: the content follows Dr. Qazi's teaching method and years of trading. Real charts are built from Dukascopy Gold (XAUUSD) data, and backtest results are shown as they came out, even when negative. We do not sell signals, manage accounts or take money from any broker. Last updated: 19 November 2026.
Questions
What is a POI in SMC?
A point of interest: a zone such as an order block, fair value gap, breaker or mitigation block where a reaction is expected.
How do you choose the best POI?
Score it: higher timeframe bias, discount or premium, OTE, prior liquidity sweep, break of structure, fair value gap, untouched zone and a clear draw on liquidity with at least 1:2 reward.
With two zones, which one should I take?
The one after the IDM sweep that sits deeper (in the OTE); the near zone is often a trap.
How many trades a day?
Only A+ setups; one or two are usually enough.
What does POI mean in trading?
POI stands for point of interest: a zone (order block, FVG, breaker and so on) where a price reaction is expected.
Is the scorecard available as a PDF?
Yes, a free POI scorecard PDF is in the downloads section of this page, in Urdu and English, built to compare three zones at once.
Read more
Education only, not financial advice. Trading forex, Gold and CFDs carries a high risk of loss. SMC concepts describe tendencies, not guarantees. Lesson 23 of 38.