 Qazi Forex Tips

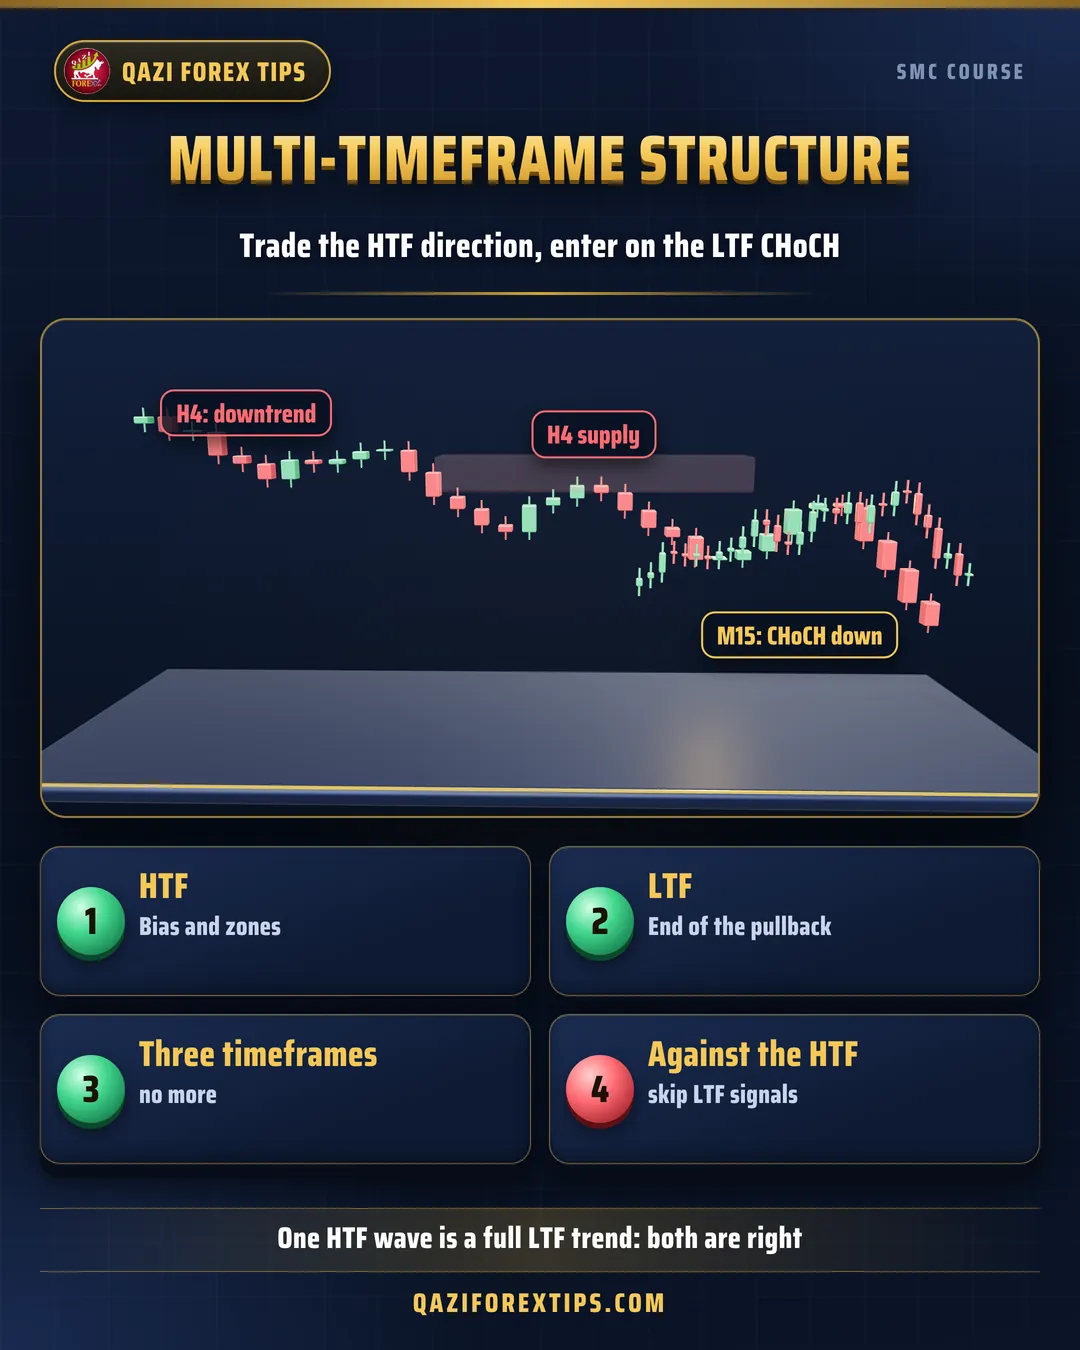
How can both be right?
Every wave on a higher timeframe is a complete trend on a lower timeframe. A pullback (an up-wave) in an H4 downtrend looks like an uptrend with HHs and HLs on M15.
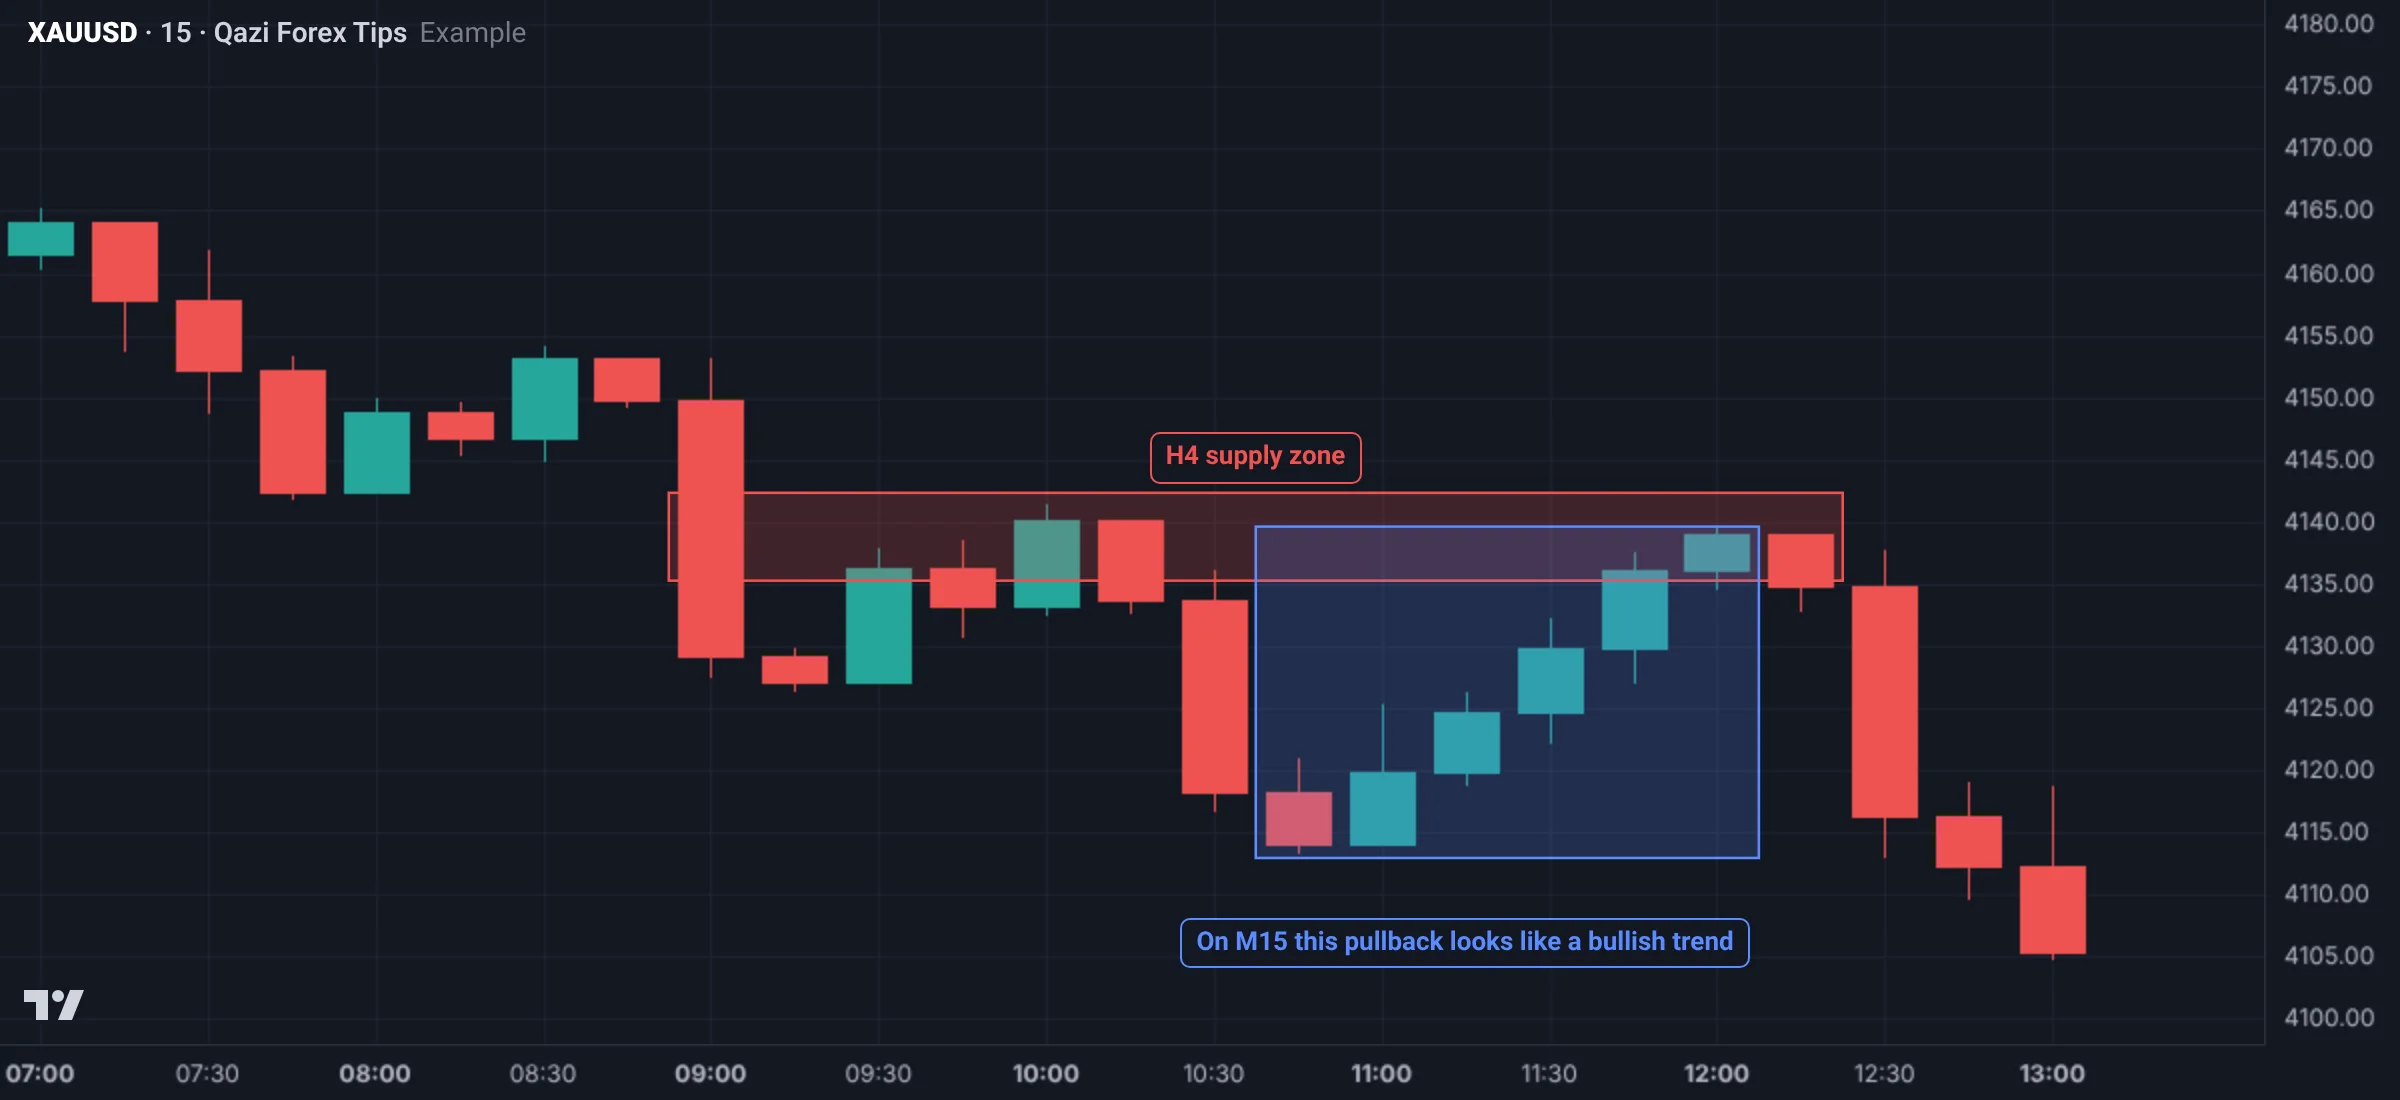
The core rule
Trade in the higher timeframe (HTF) direction; enter on the lower timeframe (LTF) CHoCH.
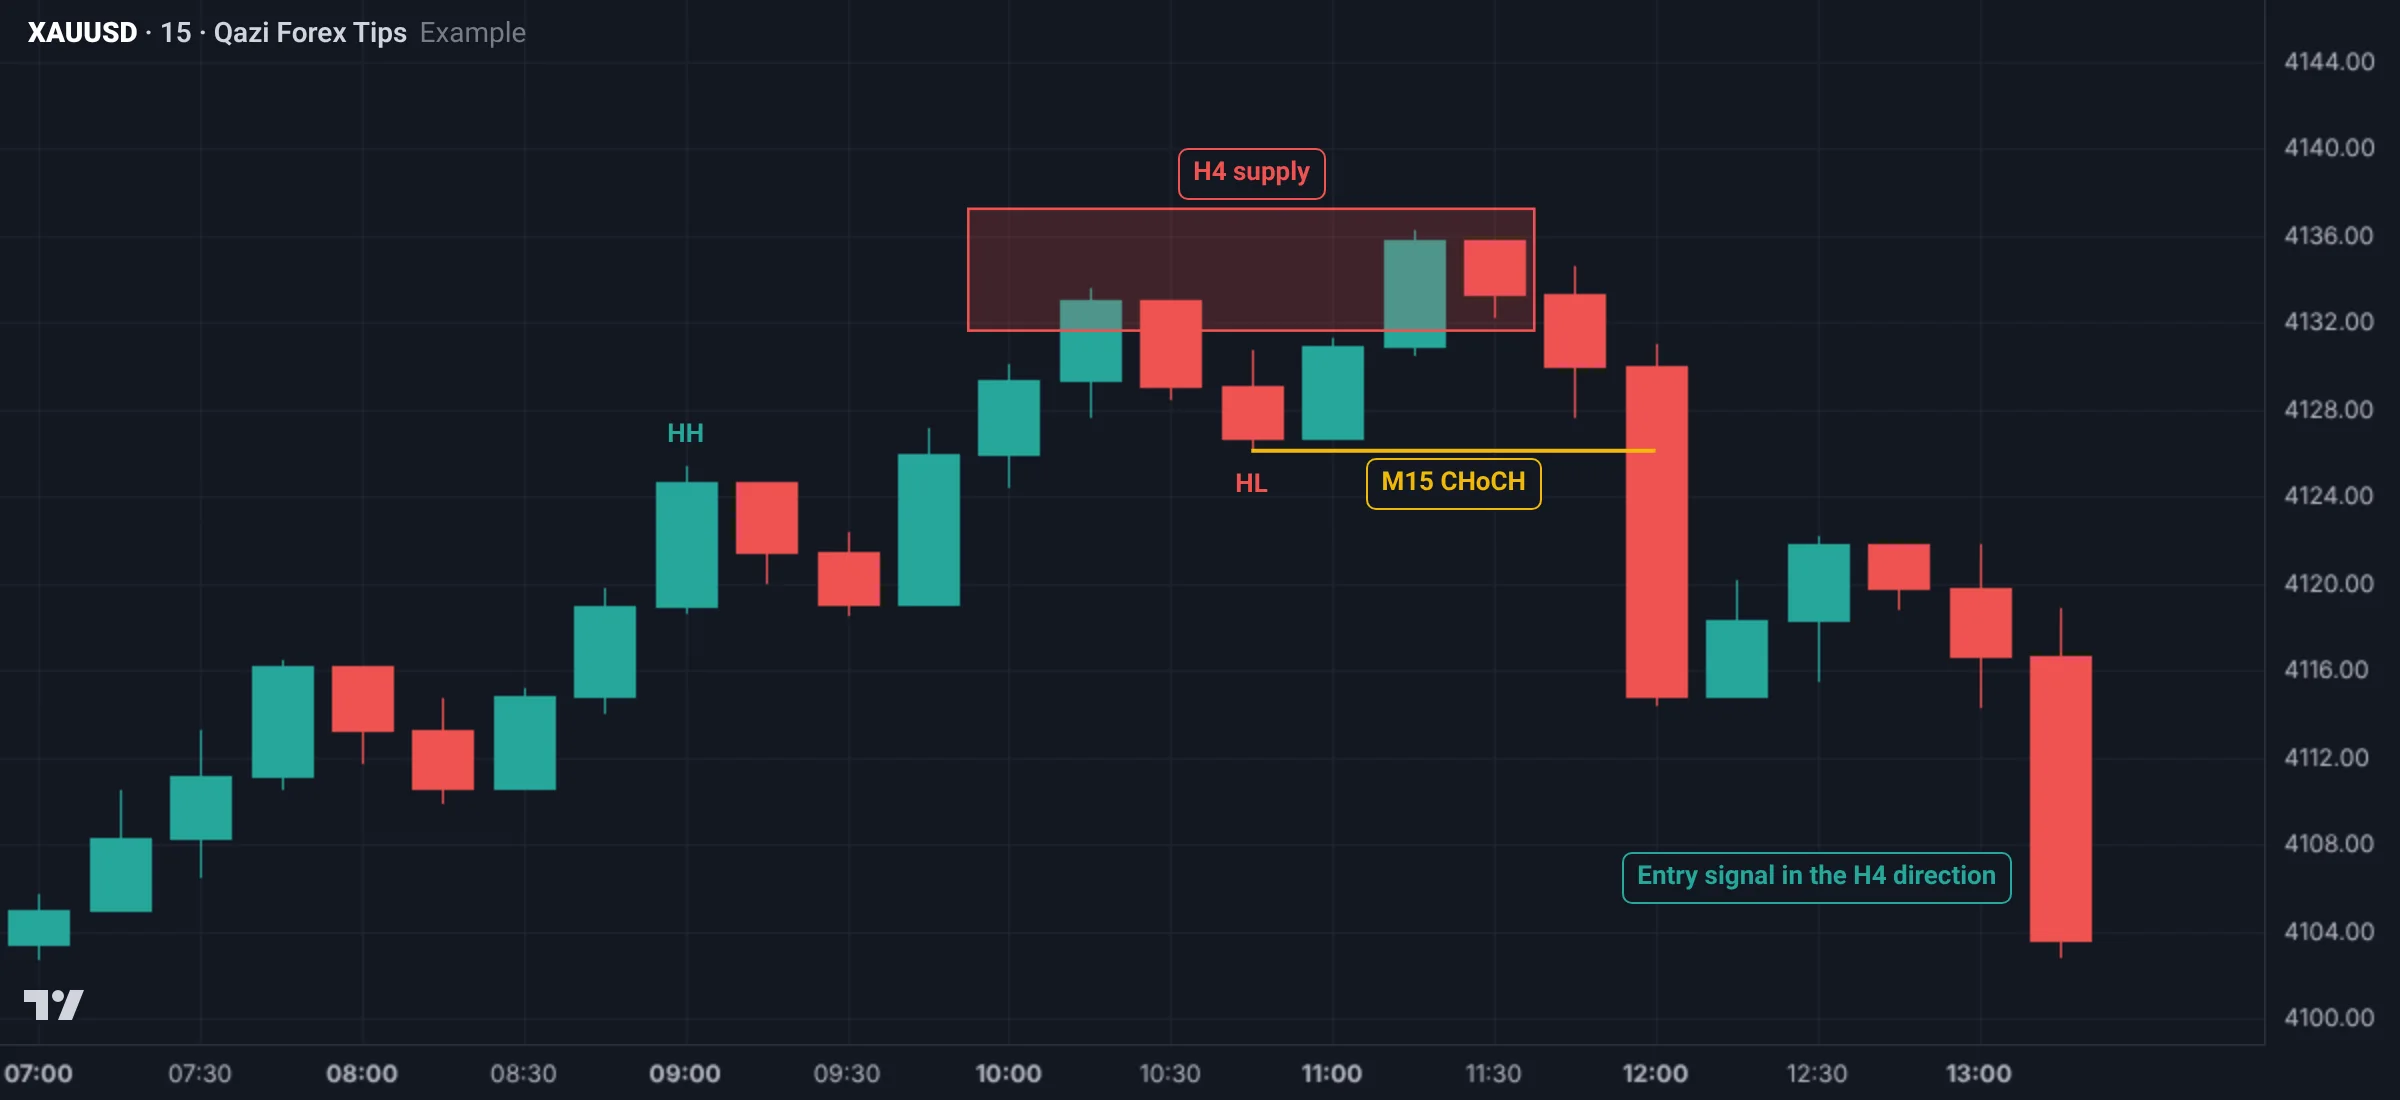
Why this rule works
- The HTF shows which way the big money is going.
- The LTF shows when the HTF pullback is ending.
- This gives a small SL (beyond the LTF swing) and a large target (HTF liquidity).
Timeframe pairs
| Bias (HTF) | Zone | Entry (LTF) | Trader type |
|---|---|---|---|
| Daily | H4 | H1 or M15 | Swing trader |
| H4 | H1 | M15 or M5 | Intraday |
| H1 | M15 | M1 | Scalper |
Step by step
- Read HTF structure: bullish or bearish? Where is the protected high or low?
- Which zone is the HTF pullback heading into? (supply or demand, Phase 3)
- When price reaches that zone, open the LTF.
- Read the pullback structure on the LTF (for example, M15 bullish).
- Wait until the LTF makes a CHoCH in the HTF direction.
- That is the entry signal; the SL goes beyond the last LTF swing.
When timeframes disagree
| HTF | LTF | Decision |
|---|---|---|
| Bullish | Bullish | Wait for a pullback into the HTF zone, then buy |
| Bullish | Bearish (pullback) | At the zone, wait for a bullish LTF CHoCH |
| Bearish | Bullish (pullback) | At the zone, wait for a bearish LTF CHoCH |
| Range | Anything | No trade, or only at the range edges |
Higher timeframe zone, lower timeframe entry: in one picture
The whole benefit of multi-timeframe analysis is in this one picture: a zone on the higher timeframe, and a CHoCH on the lower timeframe inside that zone.
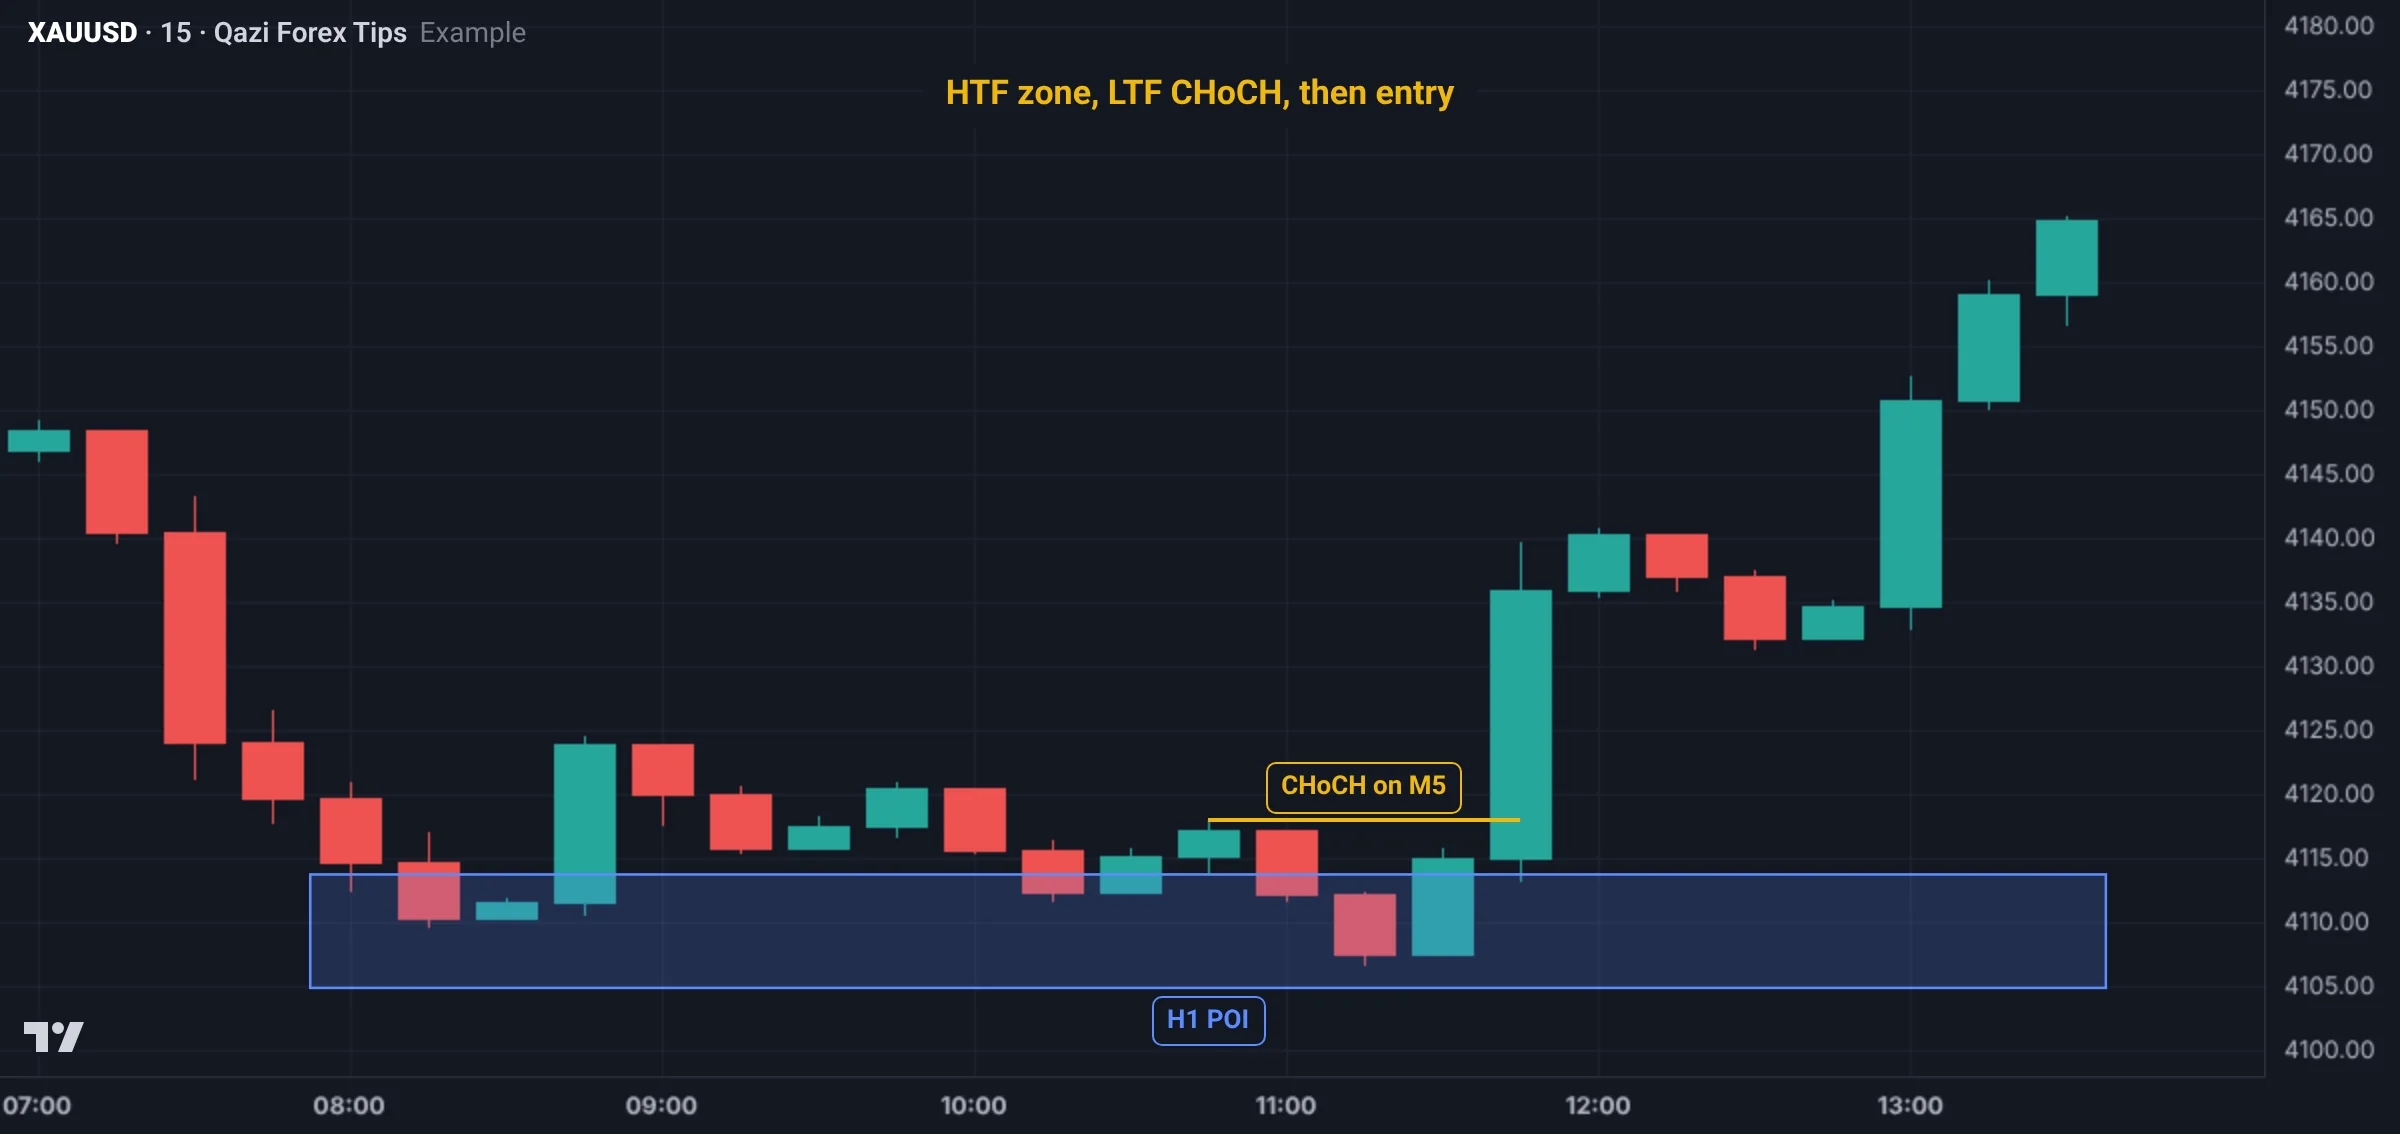
The H1 zone tells you where to trade. The M5 CHoCH tells you when. The zone alone is not enough (price can break it), and an M5 CHoCH alone is not enough either (it can be in mid-air). Together they make a good setup.
A 15-minute daily top-down routine
- D1 (2 minutes): the big trend and the nearest big liquidity.
- H4 (4 minutes): structure, the protected low or high, and the bias in one line.
- H1 (5 minutes): the POI in the direction of the bias (detailed in Phase 3) and the IDM or liquidity before it.
- Set alerts: a price alert at the POI; you don't need to sit in front of the chart.
- M15 or M5 (when the alert fires): wait for a CHoCH inside the POI, then entry, stop and target.
A Gold example
- H4: uptrend, protected low 4,104, bias bullish.
- H1: a pullback is under way; the buy POI is the 4,112 to 4,118 zone (origin of the BOS move).
- M5: price enters the zone at 4,113, a small downtrend forms on M5, then the last LH at 4,117 breaks with a body: a CHoCH.
- Buy near 4,115, stop 4,110 (below the zone), target just before the previous H1 high of 4,138, at 4,136. 5 dollars of risk for 21 dollars of target.
Real Gold chart examples
Gold H1 from 5 to 9 Nov 2026 (data: Dukascopy, bid price; Pakistan time):
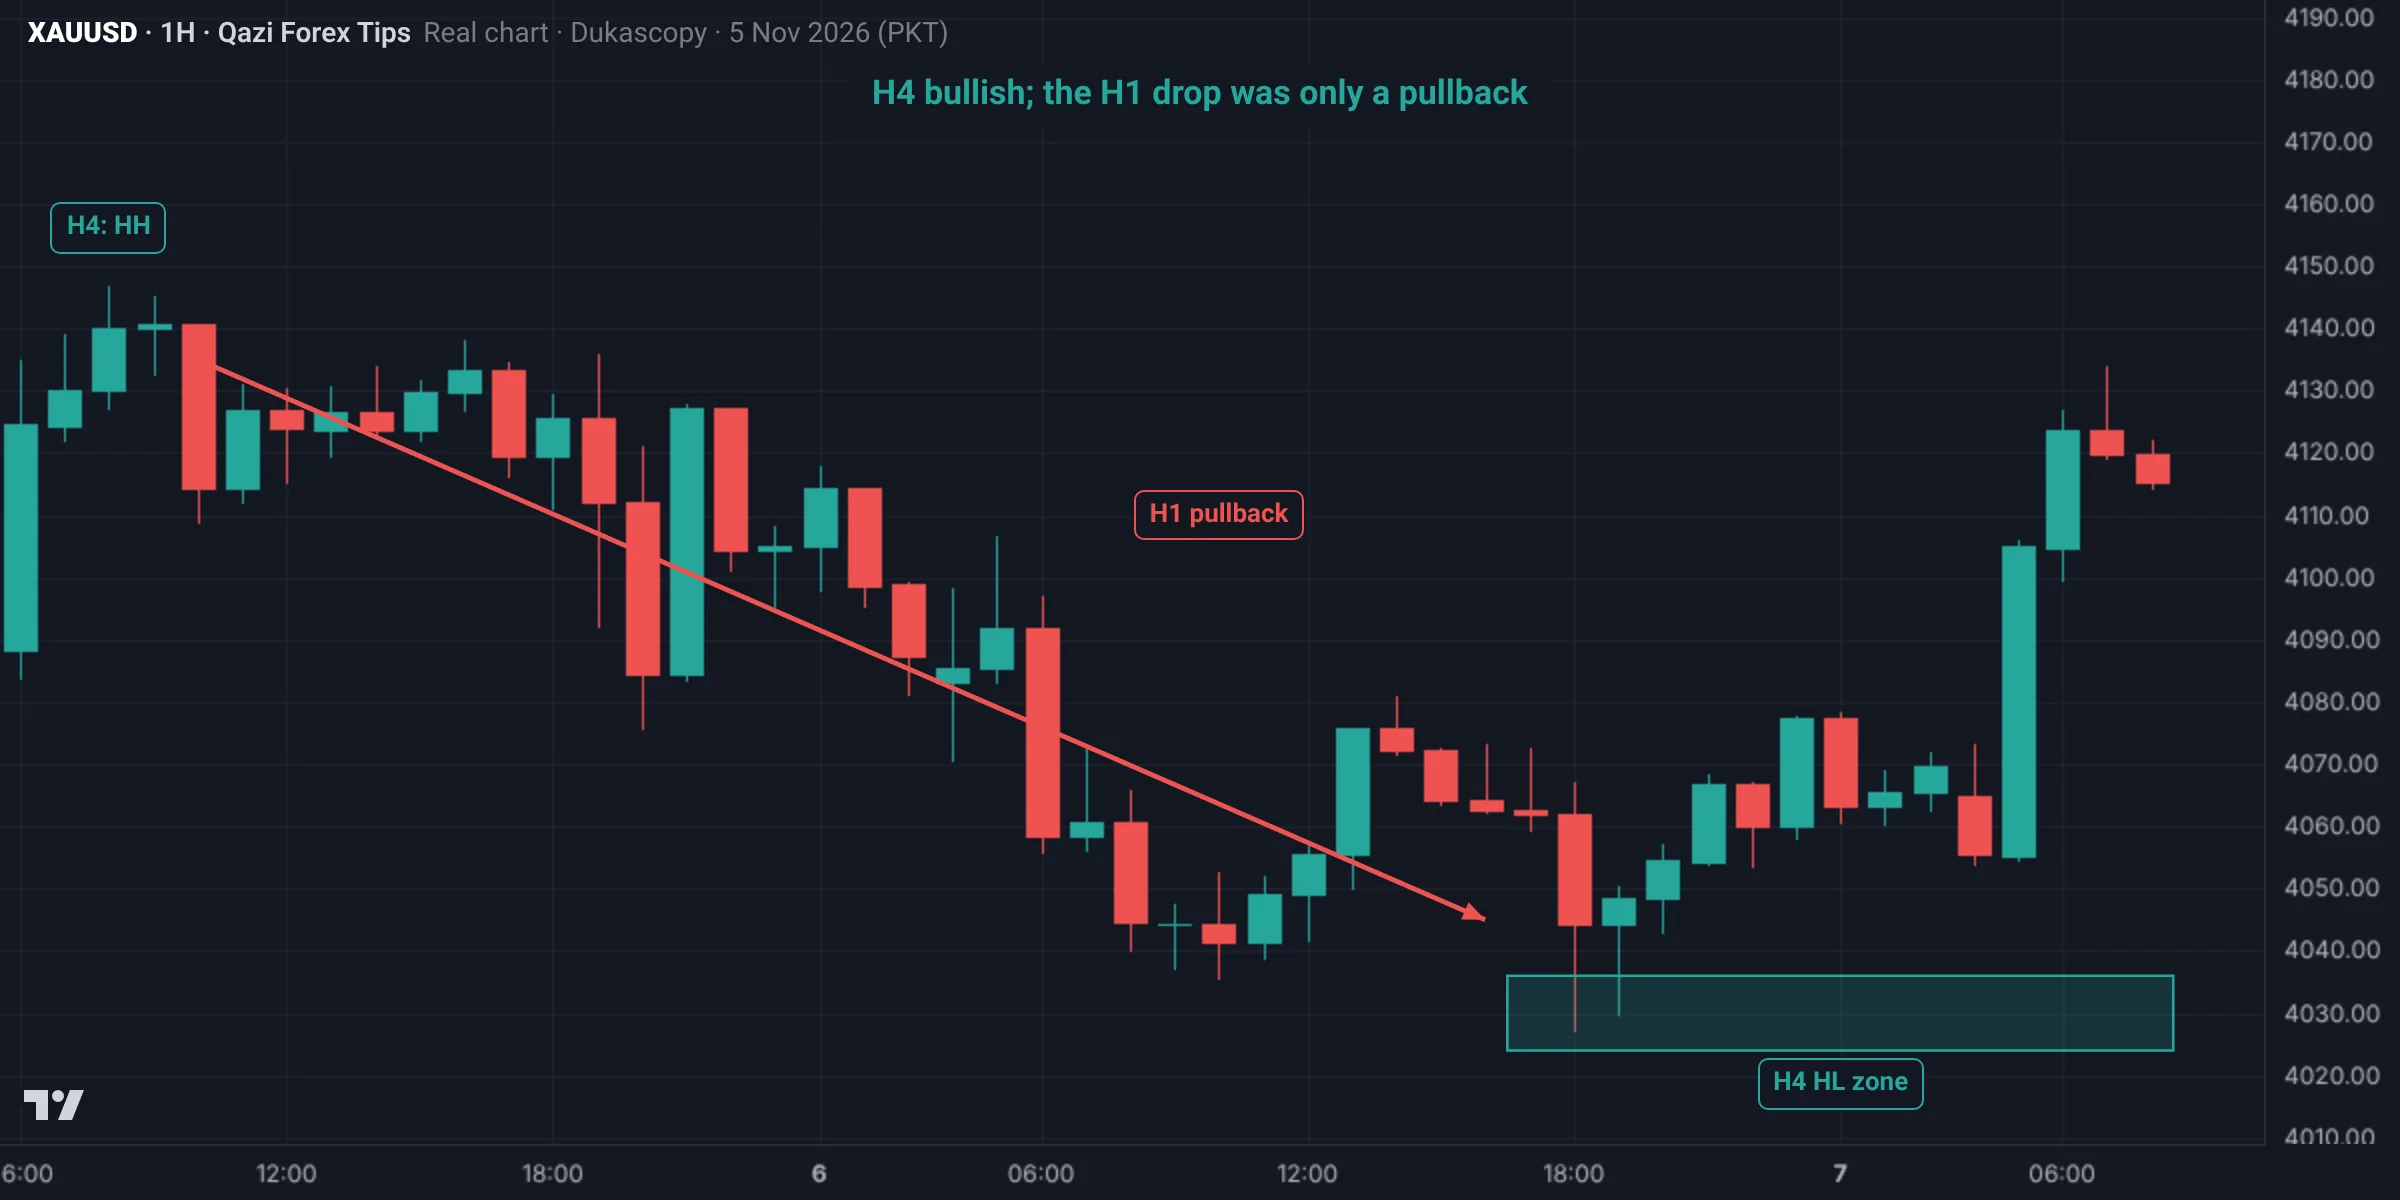
- On 5 Nov H4 made an HH at 4,146.8: H4 bias bullish.
- After that, H1 fell and printed LHs and LLs. Someone watching only H1 would have sold it as a downtrend.
- But it was an H4 pullback. On the evening of 6 Nov price stopped at 4,027.2 (which became the new H4 HL) and was back at 4,133.9 by 9 Nov.
Lesson: a lower timeframe against the higher one is a pullback; enter when the lower timeframe turns back in the higher timeframe's direction.
Second example: a bullish H1 inside a bearish H4 (26-30 Oct)
Gold H1 from 26 to 29 Oct 2026 (data: Dukascopy, bid price; Pakistan time). In the first example H4 was bullish and H1 fell; here it is the reverse:
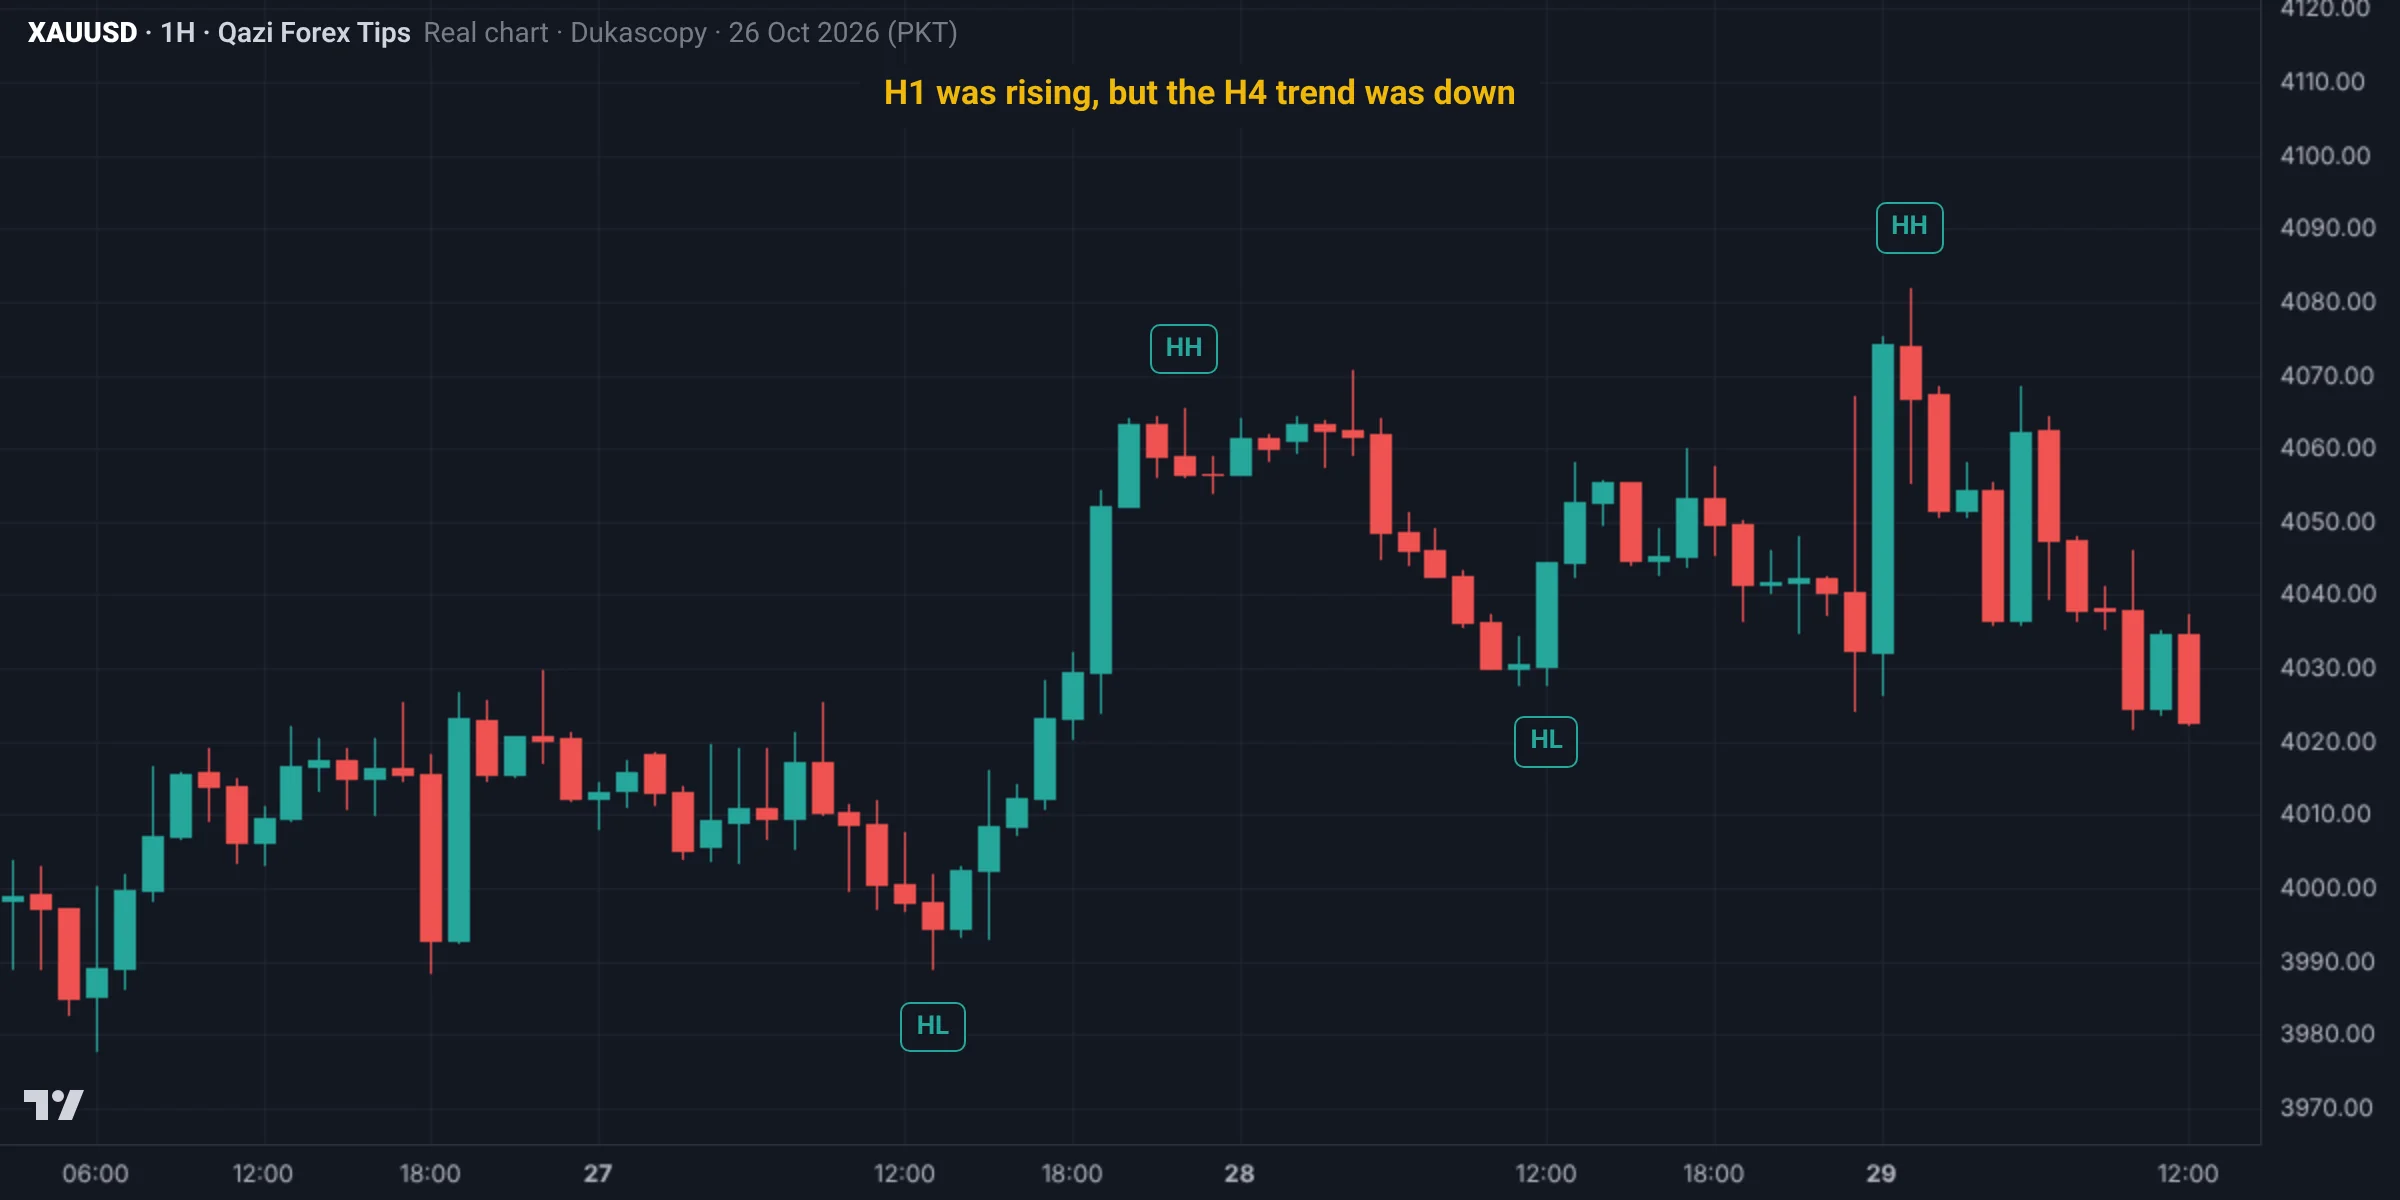
- The H4 picture: the top on 21-22 Oct was 4,145.6 and on 23 Oct price fell to 3,975.3: H4 bias bearish.
- The H1 picture: from 27 to 29 Oct H1 printed an HL at 3,989.0, an HH at 4,065.5, an HL at 4,027.8 and an HH at 4,082.0. Someone watching only H1 would have bought it as an uptrend.
- But 4,082.0 was still far below the H4 top at 4,145.6: an H4 pullback. On 30 Oct price reached 3,876.1, below even the 23 Oct low.
Same lesson: a lower timeframe against the higher one is a pullback; enter when the lower timeframe turns back in the higher timeframe's direction.
Common mistakes
Summary
- The higher timeframe tells you where, the lower timeframe tells you when.
- A 15-minute top-down routine every day, and alerts at the POI.
- Take only lower timeframe CHoCHs that form inside the higher timeframe zone and in the direction of its bias.
Phase 1 complete: the gate
You have now learned swings, HH and HL, BOS, CHoCH, internal structure, the protected low, IDM and multi-timeframe structure. Before starting Phase 2 (liquidity), pass this gate:
- You confirm every BOS and CHoCH with a body close, not a wick.
- You can tell internal and swing structure apart.
- You can state any chart's HTF bias and protected low or high in one line.
Spot it on the chart: practice
This is a real Gold chart (Dukascopy data, Pakistan time). Study it and pick an answer. After you answer, the fully marked chart and the explanation appear.
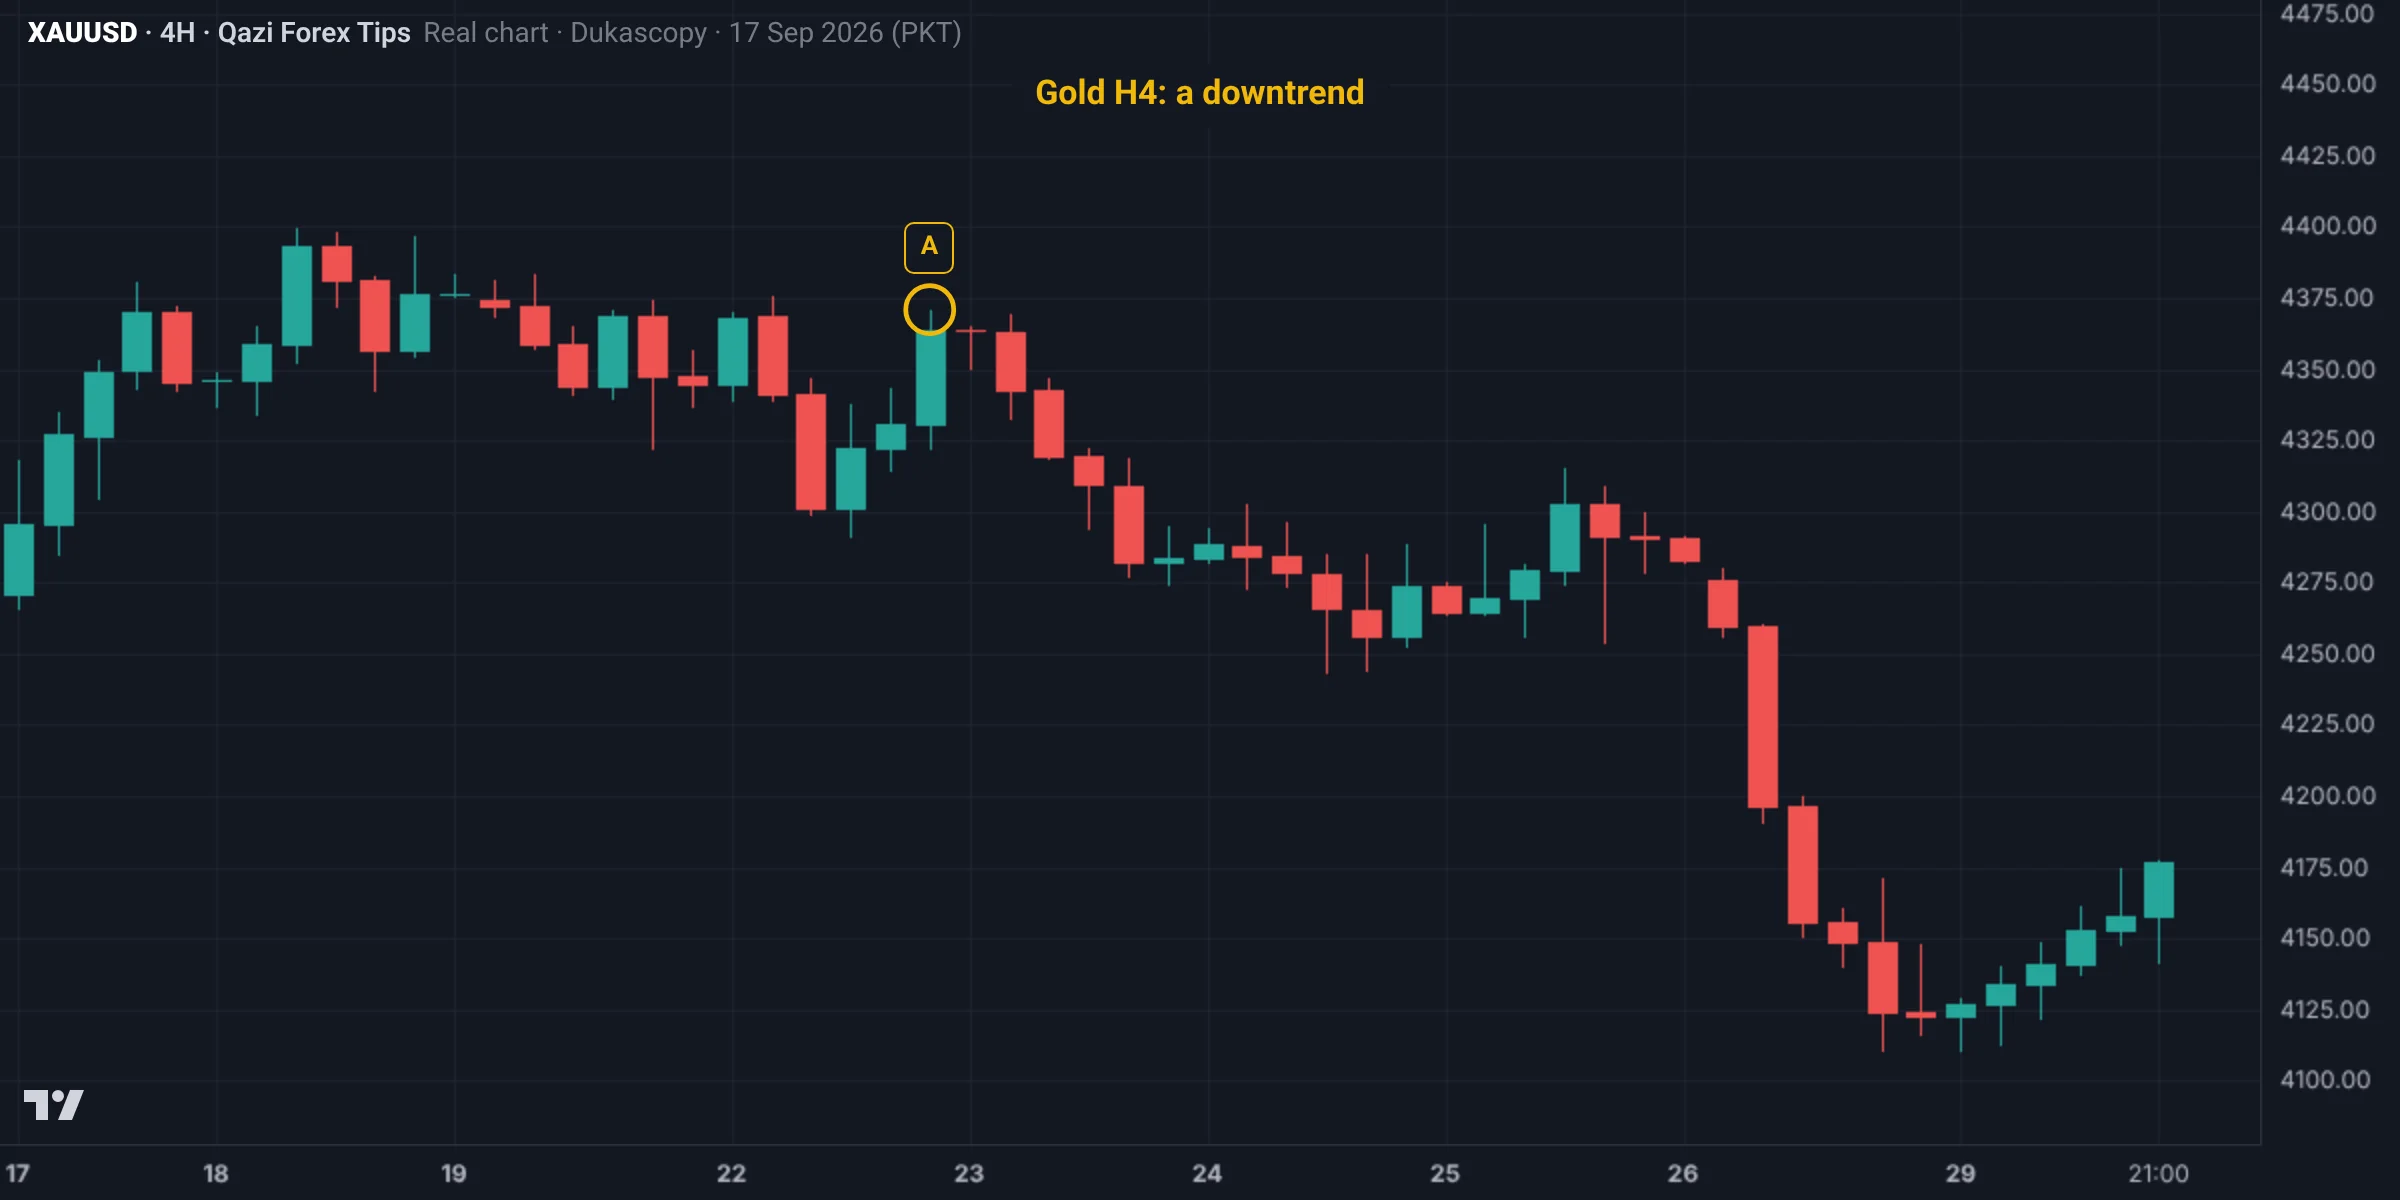
H4 is in a downtrend and around A price is rising on H1. What is the best plan?
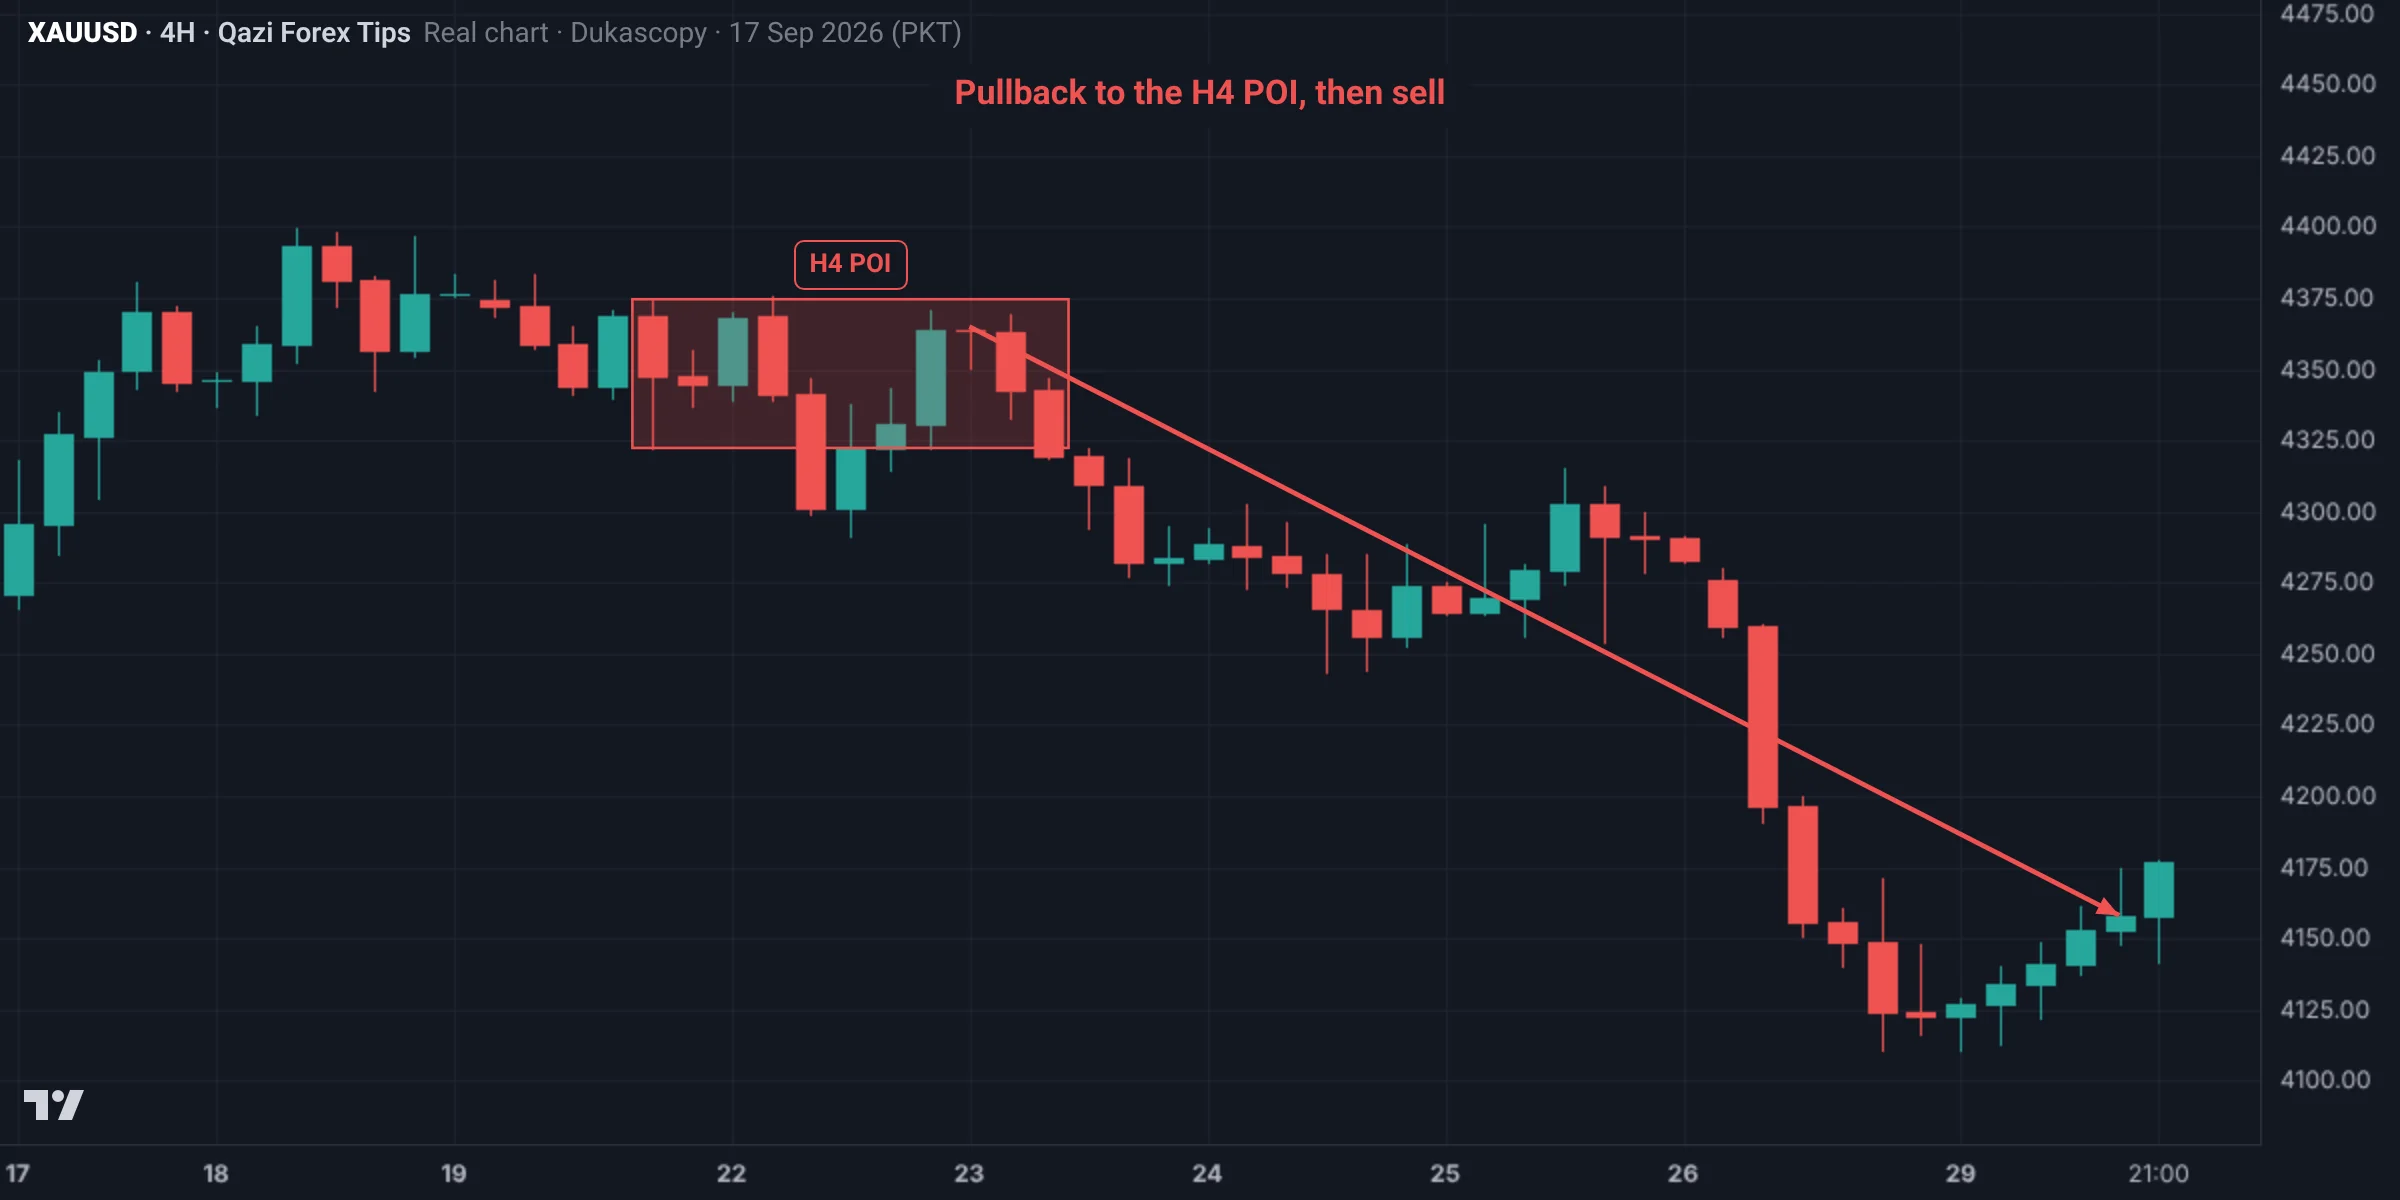
The H1 rise is an H4 pullback, not a new trend. It reached the H4 POI, bearish confirmation followed, and Gold fell to 4,110.6.
The marked chart
Test yourself: Lesson 1.7 quiz
10 questions. Pick one answer for each and you will see at once whether it is right and why. Your score and grade appear at the end. You need 70% to pass.
0 correct · 0 / 10
Question 1How does an up-wave pullback in an H4 downtrend look on M15?
Every higher timeframe wave is a complete trend on a lower timeframe.
Question 2What is the core multi-timeframe rule?
This gives a small SL (beyond the LTF swing) and a large target (HTF liquidity).
Question 3Which timeframe set is for an intraday trader?
Daily/H4/H1 is for swing traders; H1/M15/M1 for scalpers.
Question 4Why not open more than three timeframes?
Three are enough: bias, zone, entry.
Question 5The HTF is bullish and the LTF bearish (a pullback). What do you do?
Enter when the LTF pullback ends in the HTF direction.
Question 6The HTF is in a range. What is the decision?
There are no trades in the middle of a range.
Question 7What do the H1 zone and the M5 CHoCH each tell you?
A zone alone (it can break) or a CHoCH alone (mid-air) is not enough; together they make a setup.
Question 8In the 15-minute daily routine, when is the alert set?
Order: D1, H4, H1 (POI), alert, then a CHoCH on M15/M5 when the alert fires.
Question 9What about switching timeframes to manage a trade?
Switching timeframes makes every small wiggle look scary.
Question 10Gold: H4 bullish, H1 POI 4,112 to 4,118, the M5 LH at 4,117 breaks. What is the trade?
Both the zone (where) and the M5 CHoCH (when) are present; the target sits just before the previous H1 high at 4,138.
Lesson checklist
Tick each point once you understand it. Your ticks are saved in this browser.
Assignment
- Choose your timeframe pair (for example H4, H1, M15).
- Find 10 situations on Gold where an HTF pullback reached a zone, and screenshot both the HTF and LTF for each.
- Mark the LTF CHoCH in the HTF direction and note how far price went afterwards.
- Also find one example where an LTF CHoCH against the HTF failed.
- Post your full work (HTF + LTF pairs) in the group.
- For the next 5 days, write a daily top-down routine: D1, H4 bias, H1 POI, and if a lower timeframe CHoCH comes, the entry, stop and target.
Post your assignment screenshots with your reasons in our free Facebook group, where your charts will be checked.
Join the free group
Who wrote this lesson
Dr. Qazi Abdul Basit, Ph.D
Ph.D in Business Administration and a forex and Gold trader since 2013. Founder of Qazi Forex Tips, which teaches traders in Pakistan and India price action, risk management and trading psychology in their own language: 65 student batches so far, free courses on YouTube, and MT5 tools for traders (QFT Replay Simulator, QFT Trade Assistant).
- 2013 trading since
- 75K+ Facebook group members
- 65 student batches
- 15K+ YouTube subscribers
How this lesson was made: the content follows Dr. Qazi's teaching method and years of trading. Real charts are built from Dukascopy Gold (XAUUSD) data, and backtest results are shown as they came out, even when negative. We do not sell signals, manage accounts or take money from any broker. Last updated: 19 November 2026.
Questions
What should I do if H4 is bearish and M15 is bullish?
The M15 uptrend is usually an H4 pullback. At the H4 zone, wait for a bearish M15 CHoCH, then sell.
How many timeframes should I use in SMC?
At most three: one for bias, one for zones and one for entries.
What is the core multi-timeframe rule?
Trade in the higher timeframe's direction and enter on the lower timeframe's CHoCH.
What is multi-timeframe structure in SMC?
Reading bias on a higher timeframe and timing entries with a lower-timeframe CHoCH in the same direction.
Which timeframe combinations work?
Daily-H4-H1 for swing trading, H4-H1-M15 for intraday, H1-M15-M1 for scalping.
What if timeframes disagree?
Follow the higher timeframe; treat the lower timeframe move as a pullback until it gives a CHoCH in the higher-timeframe direction.
What is multi-timeframe analysis in forex?
Looking at one pair on several timeframes: direction from the higher, the zone from the middle and the entry from the lower. For Gold a common set is H4, H1 and M15.
What is the best timeframe for Gold?
There is no single one: bias from H4 or D1, the POI from H1 and the entry from M15 or M5. Never trade M1 or M5 alone without the bigger picture.
Read more
Education only, not financial advice. Trading forex, Gold and CFDs carries a high risk of loss. SMC concepts describe tendencies, not guarantees. Lesson 11 of 38.