 Qazi Forex Tips

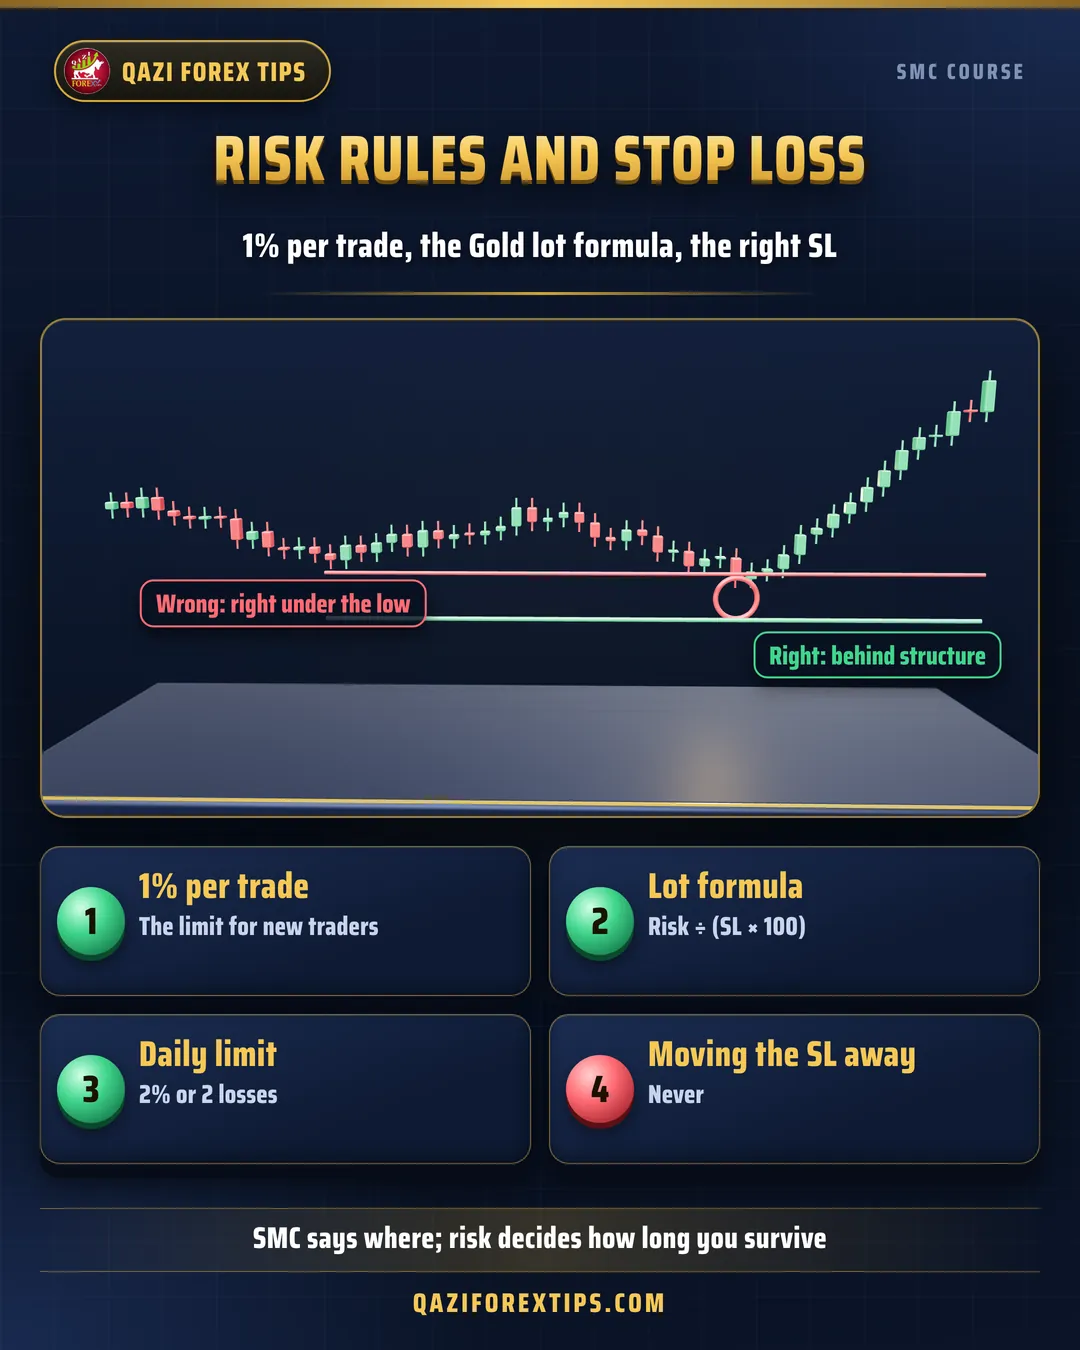
Why risk matters most
Suppose your win rate is 50%. Even then, 5 or 6 losses in a row within 100 trades is normal. At 10% risk per trade, 6 losses leave the account about 47% down. At 1% risk the same 6 losses cost only about 6%.
| Risk per trade | Account after 6 losses | Gain needed to recover |
|---|---|---|
| 1% | 94.1% | 6.2% |
| 2% | 88.6% | 12.9% |
| 5% | 73.5% | 36.0% |
| 10% | 53.1% | 88.2% |
So the first rule of risk: 0.5% to 1% per trade, and never more than 1% for a new trader.
The Gold lot size formula
One standard lot of Gold (XAUUSD) is 100 ounces. So a $1 move is $100 on 1 lot and $1 on 0.01 lot. Lot size = risk ($) ÷ (stop distance in $ × 100)
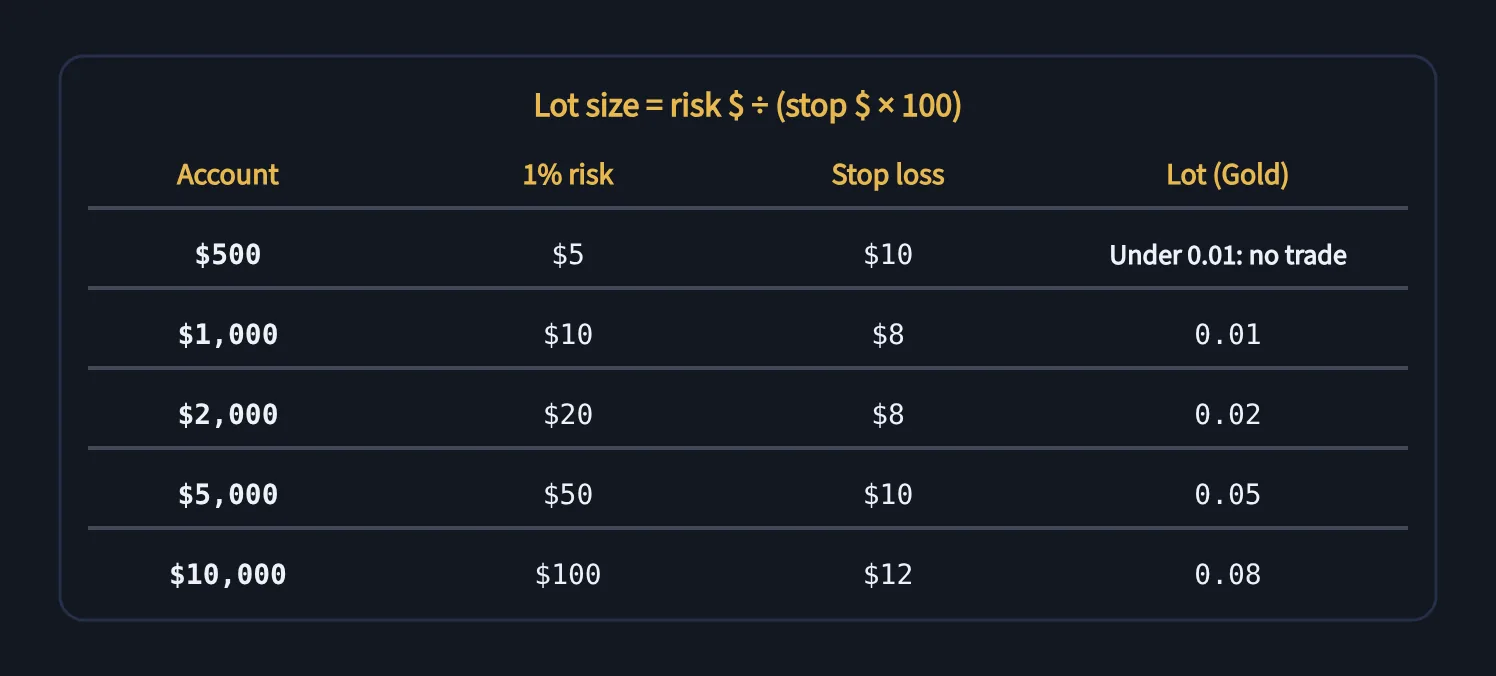
- Example: a $2,000 account, 1% risk = $20. Stop $8 away. Lot = 20 ÷ (8 × 100) = 0.025, rounded down = 0.02.
- Always round down. Rounding up pushes the risk past your limit.
- If the result is below 0.01, find a setup with a smaller (but logical) stop, skip the trade, or accept that this trade risks more than 1%.
- Check your broker's contract size once; some brokers use a different Gold lot.
Daily and weekly limits
One bad day can ruin a month. So:
| Limit | Suggestion | Why |
|---|---|---|
| Per trade | 0.5% to 1% | Survive losing streaks |
| Daily | At most 2% or 2 losses | Stop revenge trading |
| Weekly | At most 4% to 5% | A bad week should not eat the month |
| Open trades | At most 2% total risk at once | Limited damage if several lose together |
When a limit is hit, close the platform for that day or week. Write this rule on paper and keep it by your screen. Prop firm limits are often stricter (commonly 5% daily and 10% total); there 0.5% per trade is better (lesson 7.3).
Where to place the stop loss
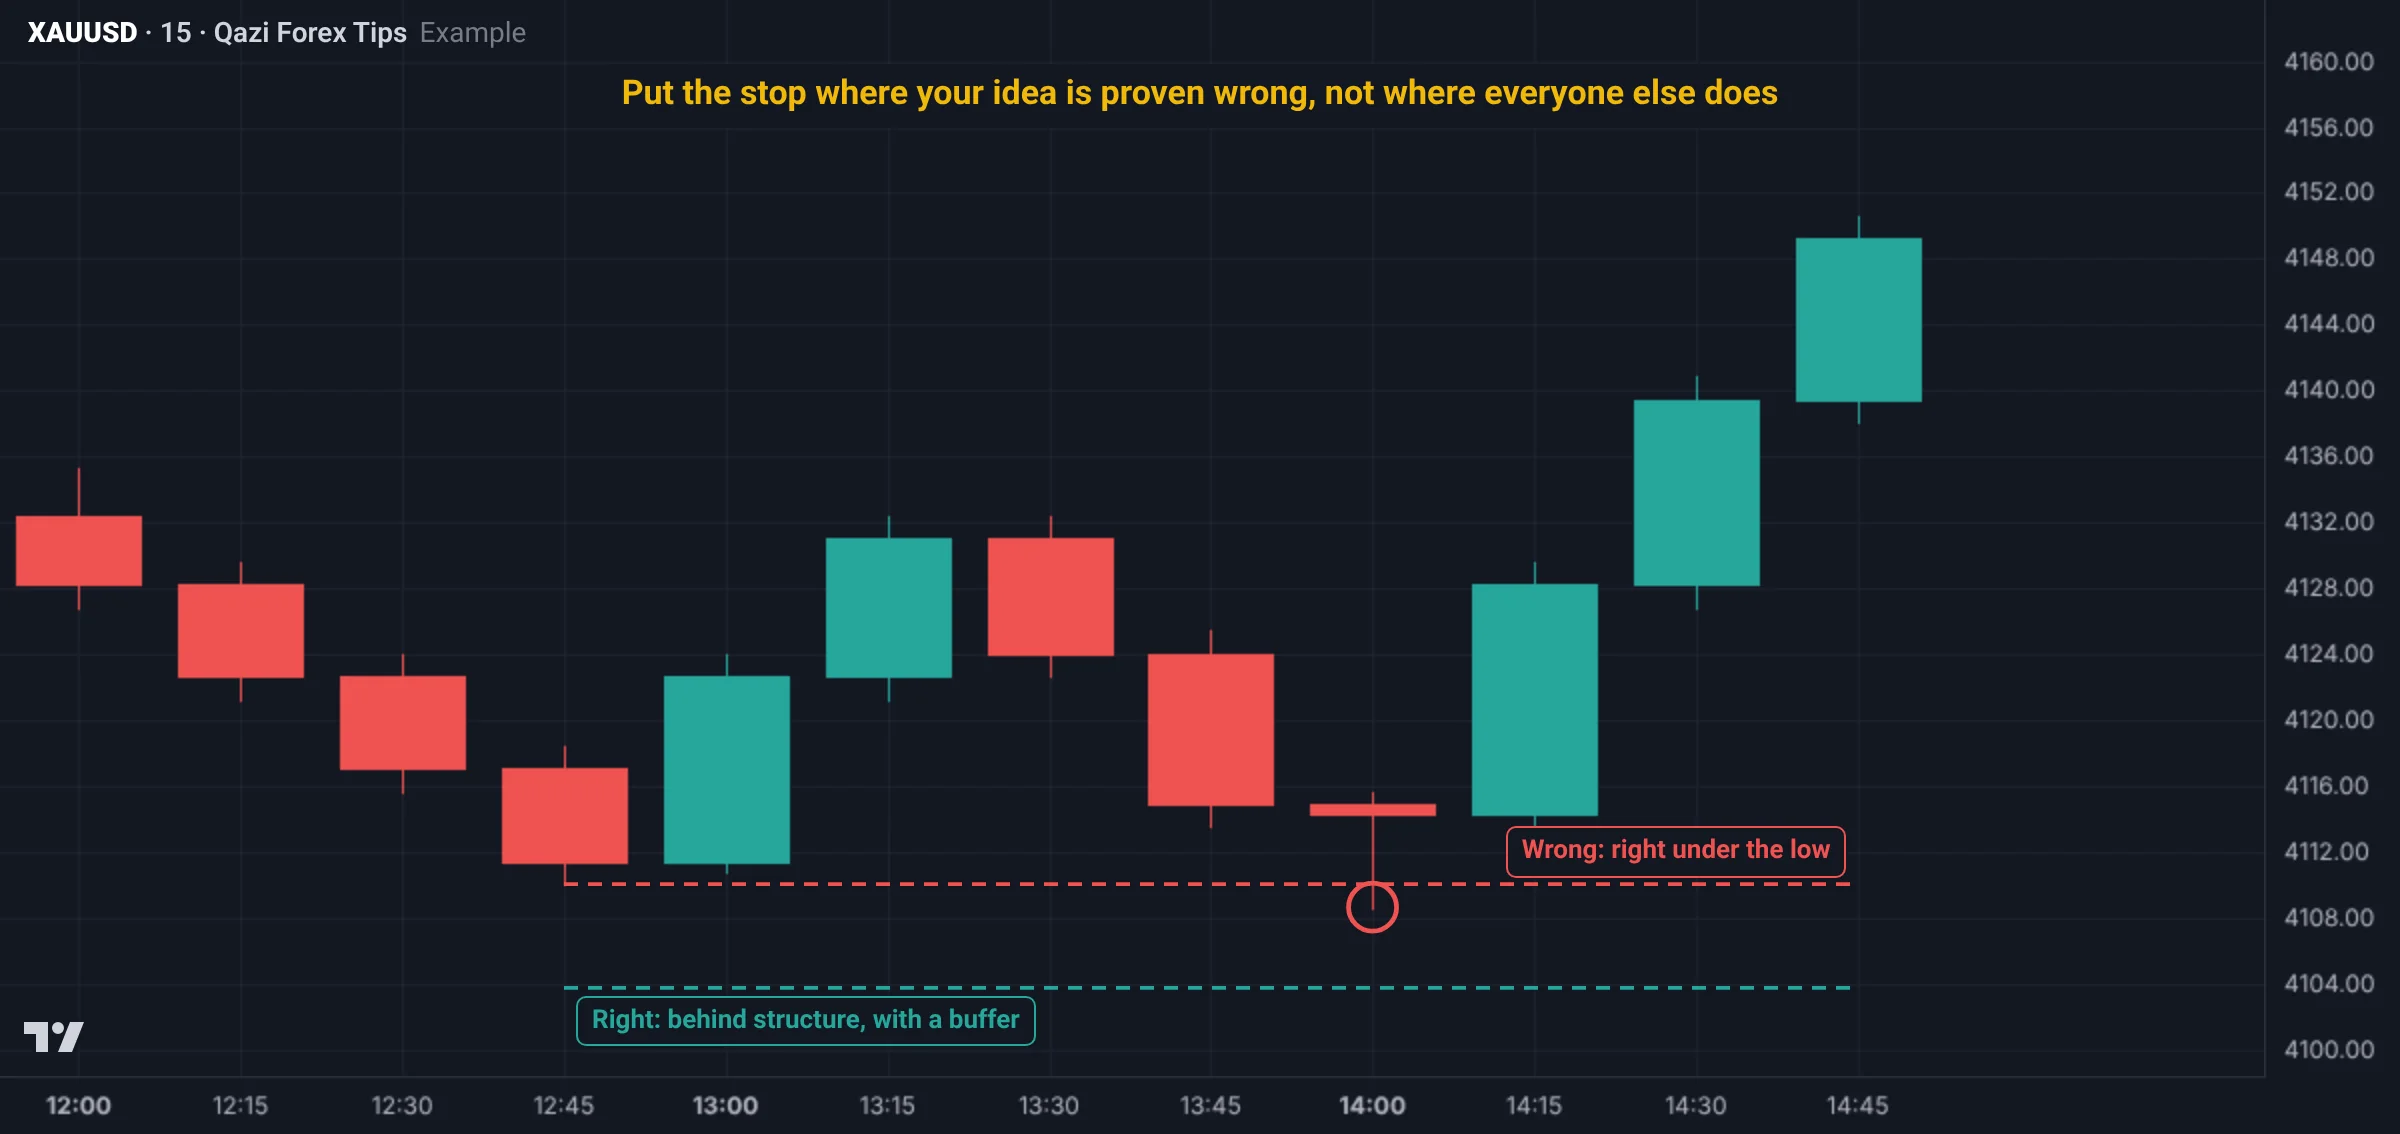
Rule: the stop goes where price would prove your idea wrong, not where everyone else puts theirs.
| Model | Stop placement |
|---|---|
| Model A | Below the swept low |
| Model B | Below the low before the LTF CHoCH, inside the HTF zone |
| OB or breaker | Below the zone |
| CRT | Below candle 2's swept low |
Buffer: not right under the low, but a little beyond: usually $1 to $2 on Gold M5, plus the spread. At night and around news spreads widen; use a bigger buffer or do not trade.
Minimum RR
With a 40% win rate you need more than 1:1.5 just to break even. The common SMC rule: RR of at least 1:2. Calculate it before the trade; if the target is too close for 1:2, skip it.
Gold example: the full calculation
Account $1,500, 1% risk = $15. A model A setup:
- Swept low 4,112, buffer $1.5: SL 4,110.5.
- Entry at the FVG CE 4,119. Stop distance $8.5.
- Lot = 15 ÷ (8.5 × 100) = 0.0176, rounded down = 0.01 lot. Actual risk $8.5 (0.57%).
- Target PDH 4,140: $21, 1:2.5. Profit at 0.01 lot: $21.
- This is today's first trade. If it loses there is one more chance today; if the second loses too, today is over.
Real Gold chart examples
Gold M15 on 27 Oct 2026 (data: Dukascopy, bid price; Pakistan time). Suppose you bought at 4,012 in the Asian range that morning:
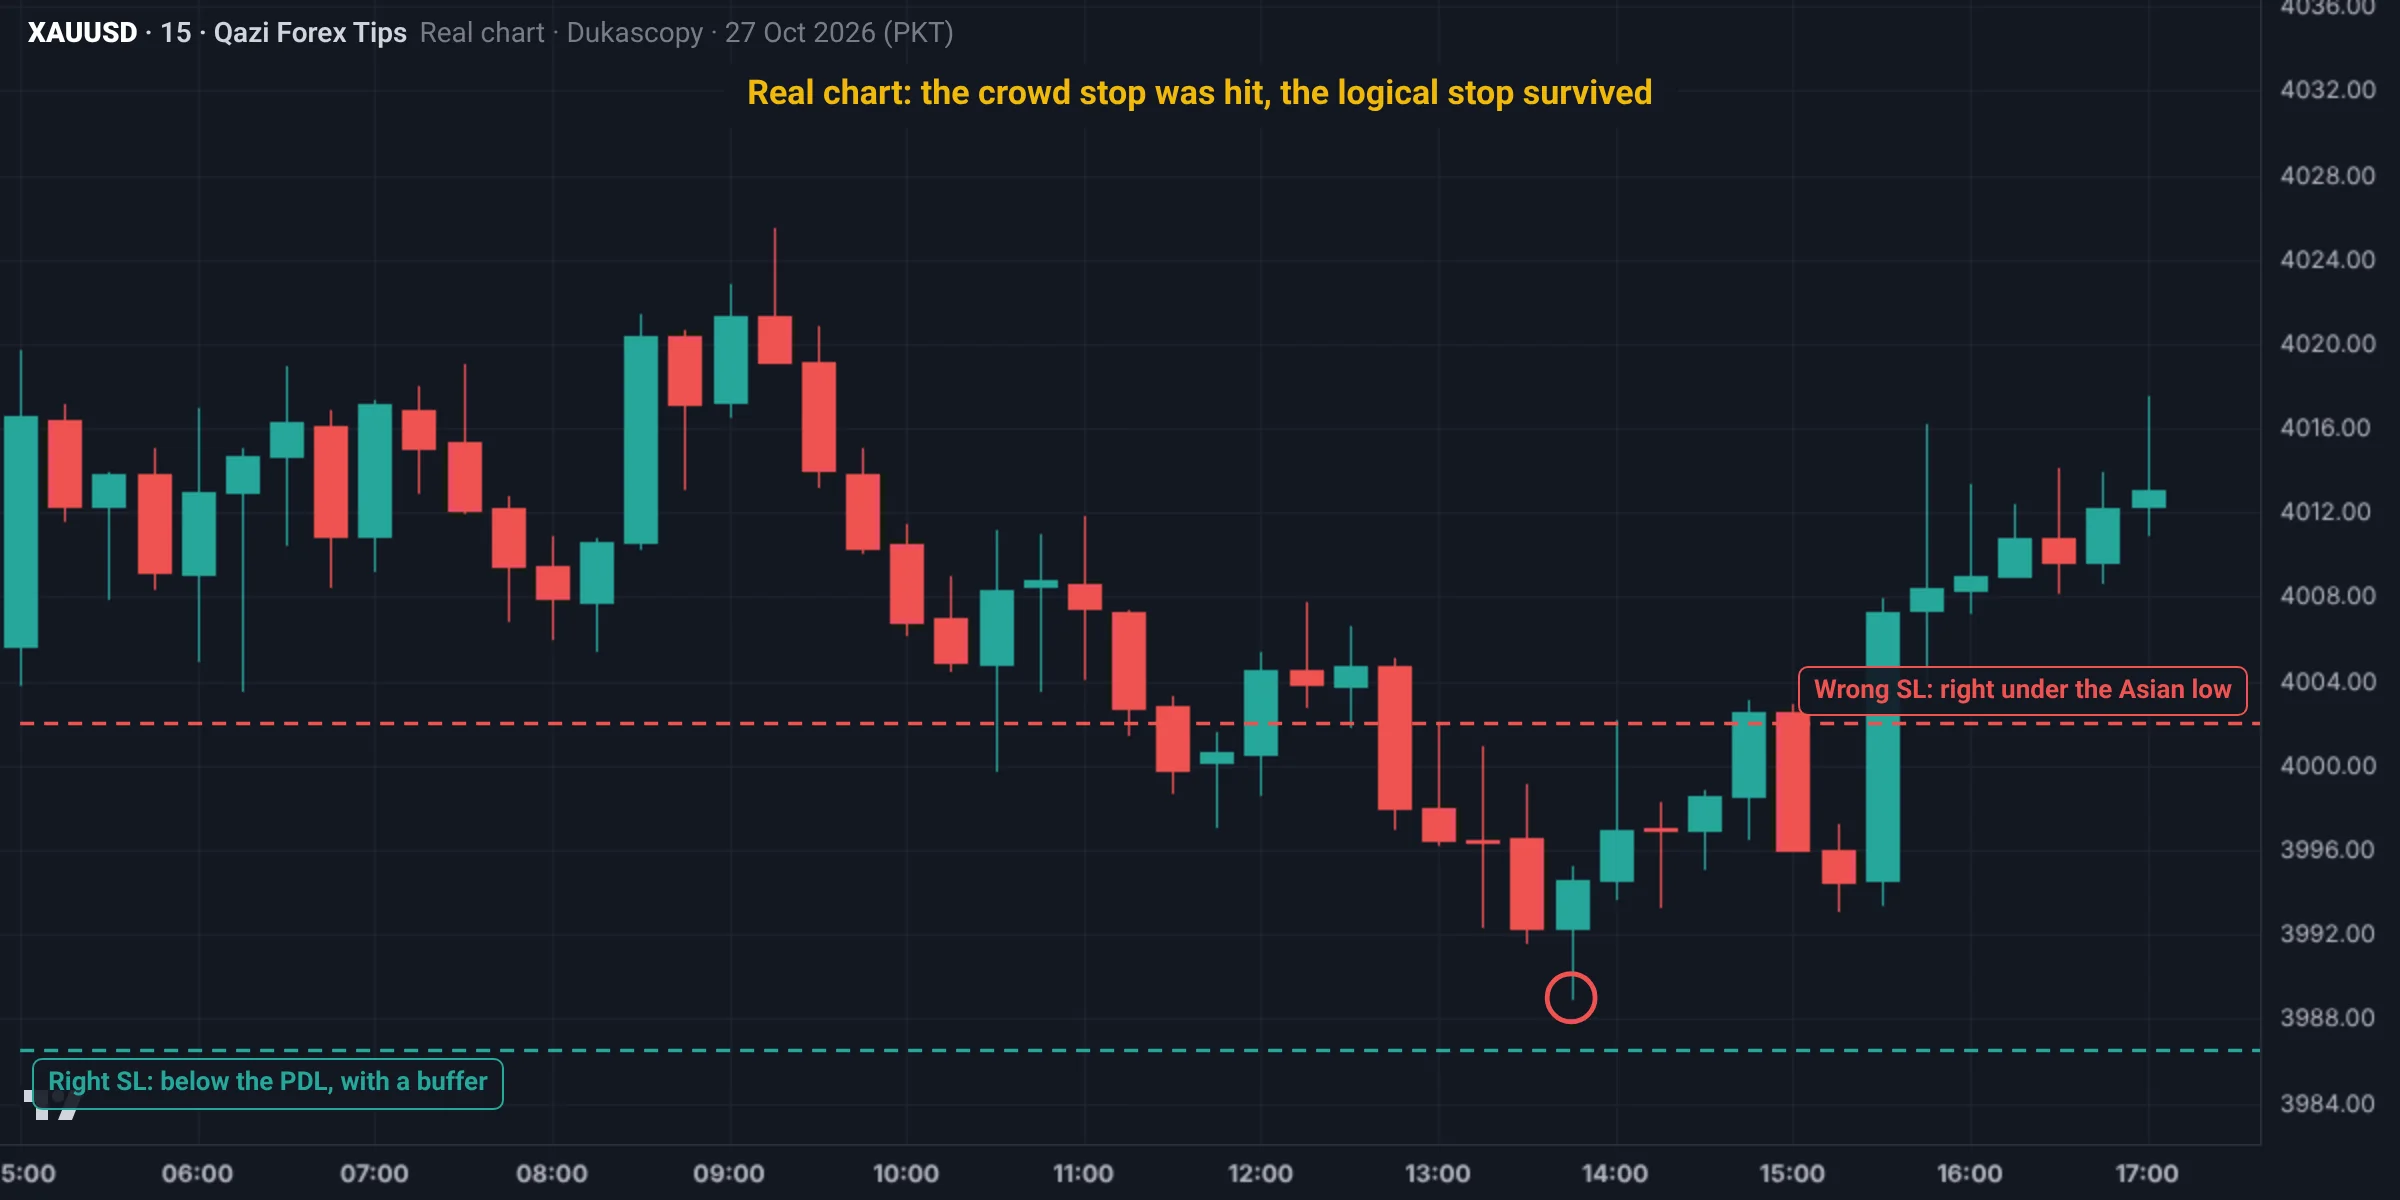
- Wrong stop: 4,002.0, just under the Asian low (4,003.6), where everyone puts theirs. Around 11:30 price went below it: stopped out, a $10 loss.
- Right stop: 3,986.5, $2 below the PDL (3,988.5), where price would genuinely disprove the bullish idea. The day's low was 3,989.0: not stopped out, and price was at 4,064.5 by night.
- Lot size: a $2,000 account, 1% risk = $20. Stop distance 4,012 − 3,986.5 = $25.5. Lot = 20 ÷ (25.5 × 100) = 0.0078, below 0.01. So either no trade, or an entry with LTF confirmation, which shrinks the stop (lesson 5.3).
Second example: a sell's stop loss (22 Oct)
The 22 Oct 2026 model A sell (the second example in lesson 5.2), Gold M15 (data: Dukascopy, bid price; Pakistan time). Entry 4,121.2:
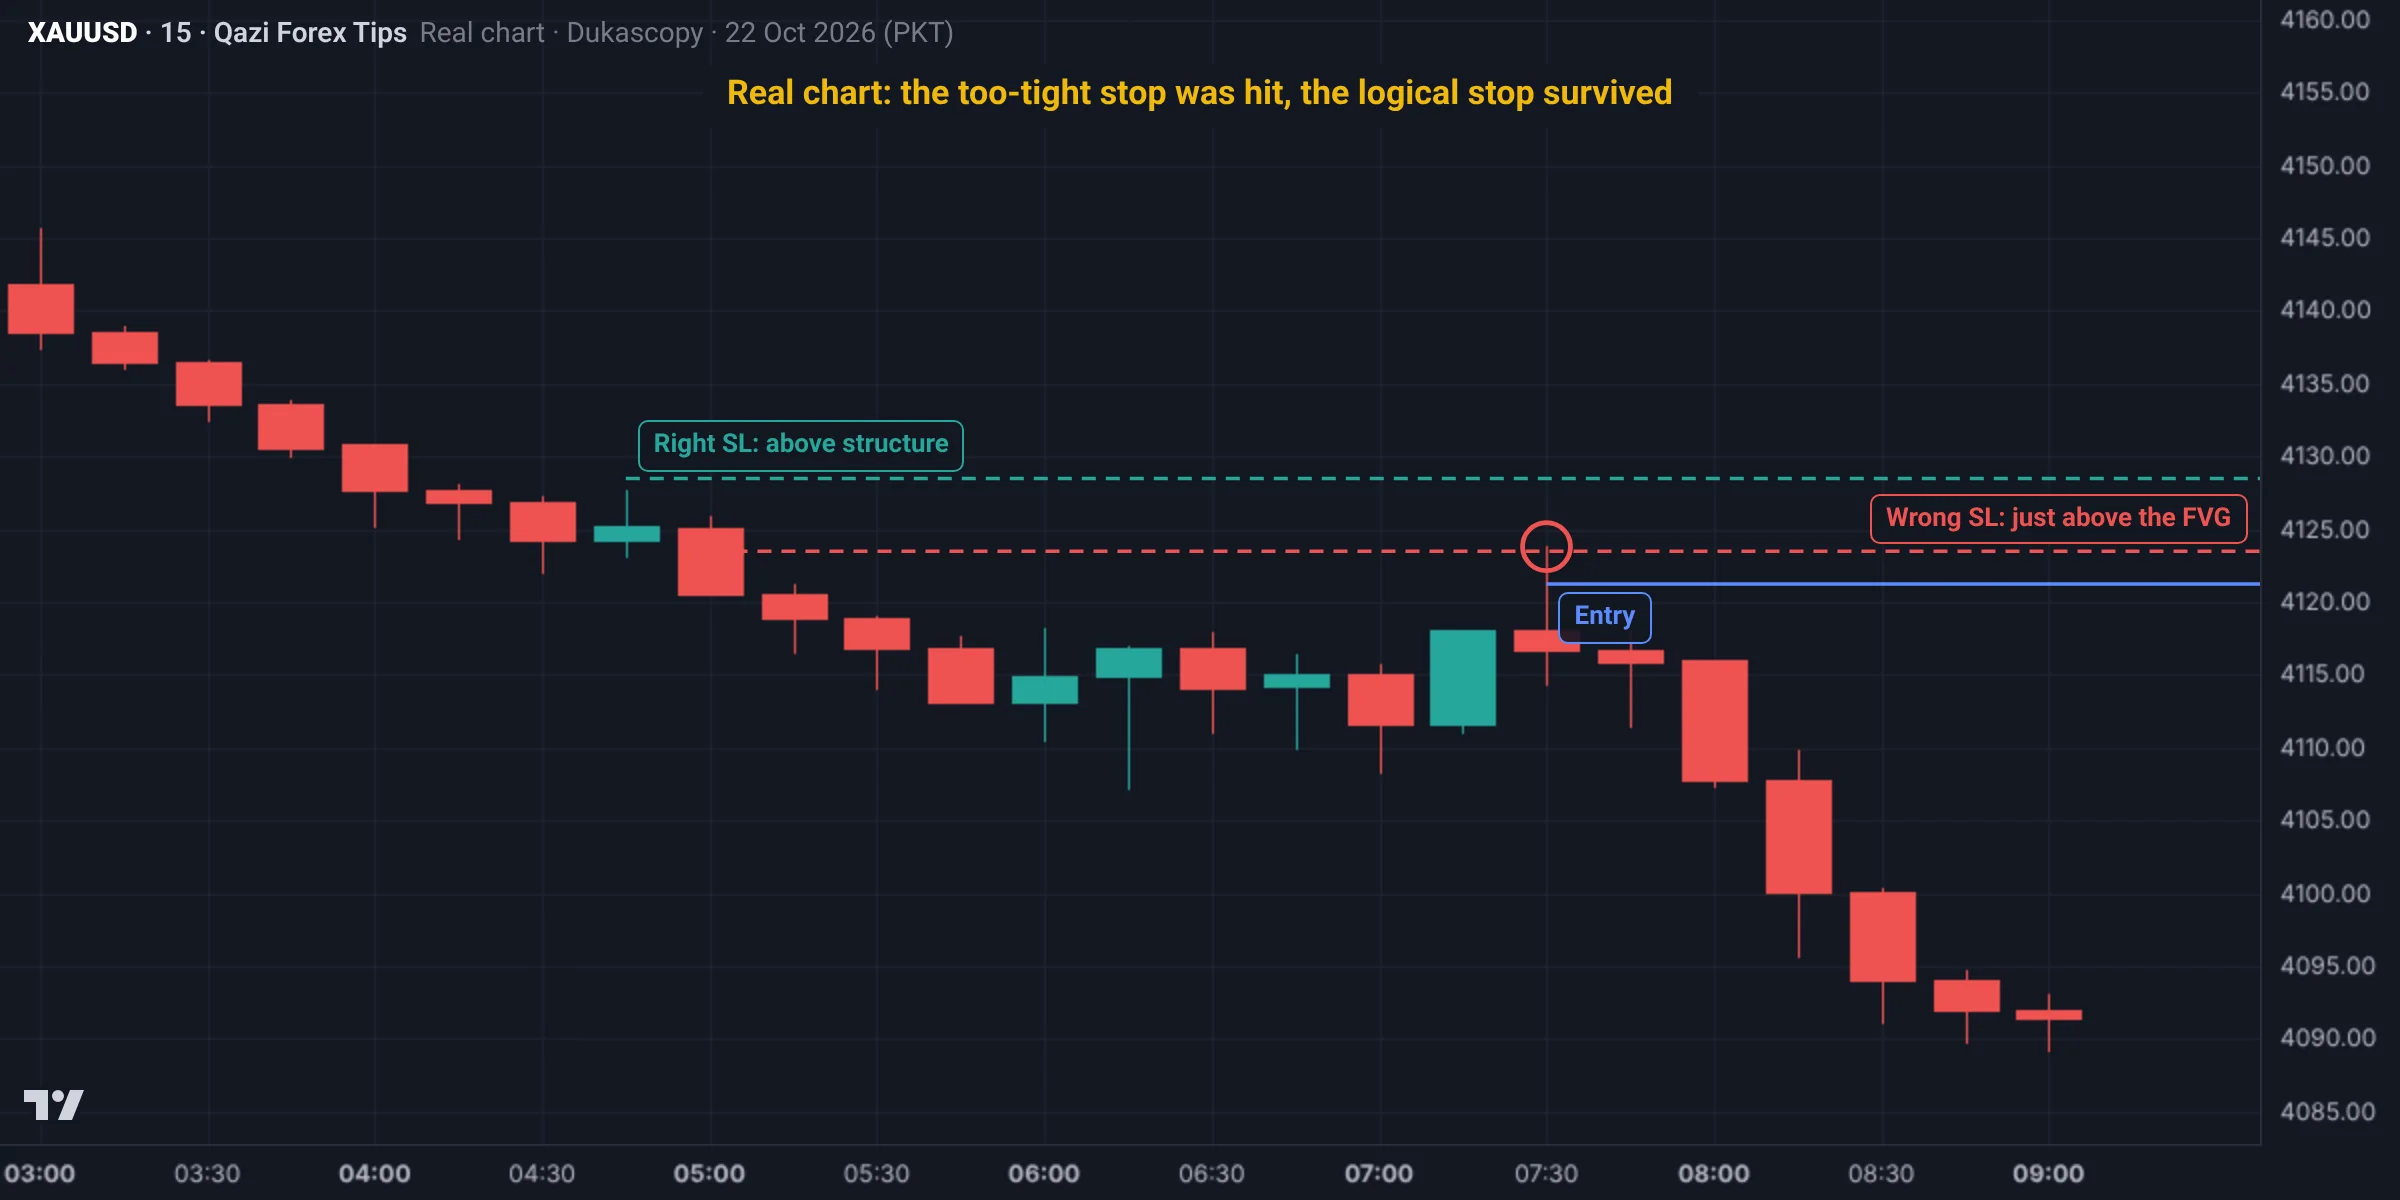
- Wrong stop: 4,123.5, just above the FVG's top edge (4,123.2), only $2.2 away. In that same 07:30 candle price reached 4,123.8: stopped out, and then price fell without you.
- Right stop: 4,128.5, above the high of the candle before the FVG, where price would genuinely disprove the sell. The highest price before TP1 was 4,123.8: not stopped out.
- Lot size: a $5,000 account, 1% risk = $50. Stop distance $7.3. Lot = 50 ÷ (7.3 × 100) = 0.069, rounded down to 0.06.
Structure decides where the stop goes, and the lot comes from the stop; never pick the lot first and squeeze the stop to fit.
Common mistakes
Summary
- 0.5% to 1% per trade, with 2% daily and 5% weekly limits.
- Gold lot = risk $ ÷ (stop $ × 100), always rounded down.
- Stop where the idea is proven wrong, with a buffer; never move it further.
- RR at least 1:2, calculated before the trade.
Try this lesson on your own chart
Qazi Forex Tips' own tools that make this lesson easier. A tool helps; your rules make the decision.
Lot size calculator
Free · in your browser, nothing to installEnter balance, risk % and stop loss to get the right lot, the money at risk and the risk:reward, for forex and Gold (XAUUSD).
Open the calculatorQFT Trade Assistant panel
Free demo · MT5 & MT4Calculates the lot from your risk, lets you drag SL and TP on the chart and place one-click orders, with partial close, break-even, trailing stop, a news lock and a Prop Firm Guard.
Details and downloadSpot it on the chart: practice
This is a real Gold chart (Dukascopy data, Pakistan time). Study it and pick an answer. After you answer, the fully marked chart and the explanation appear.
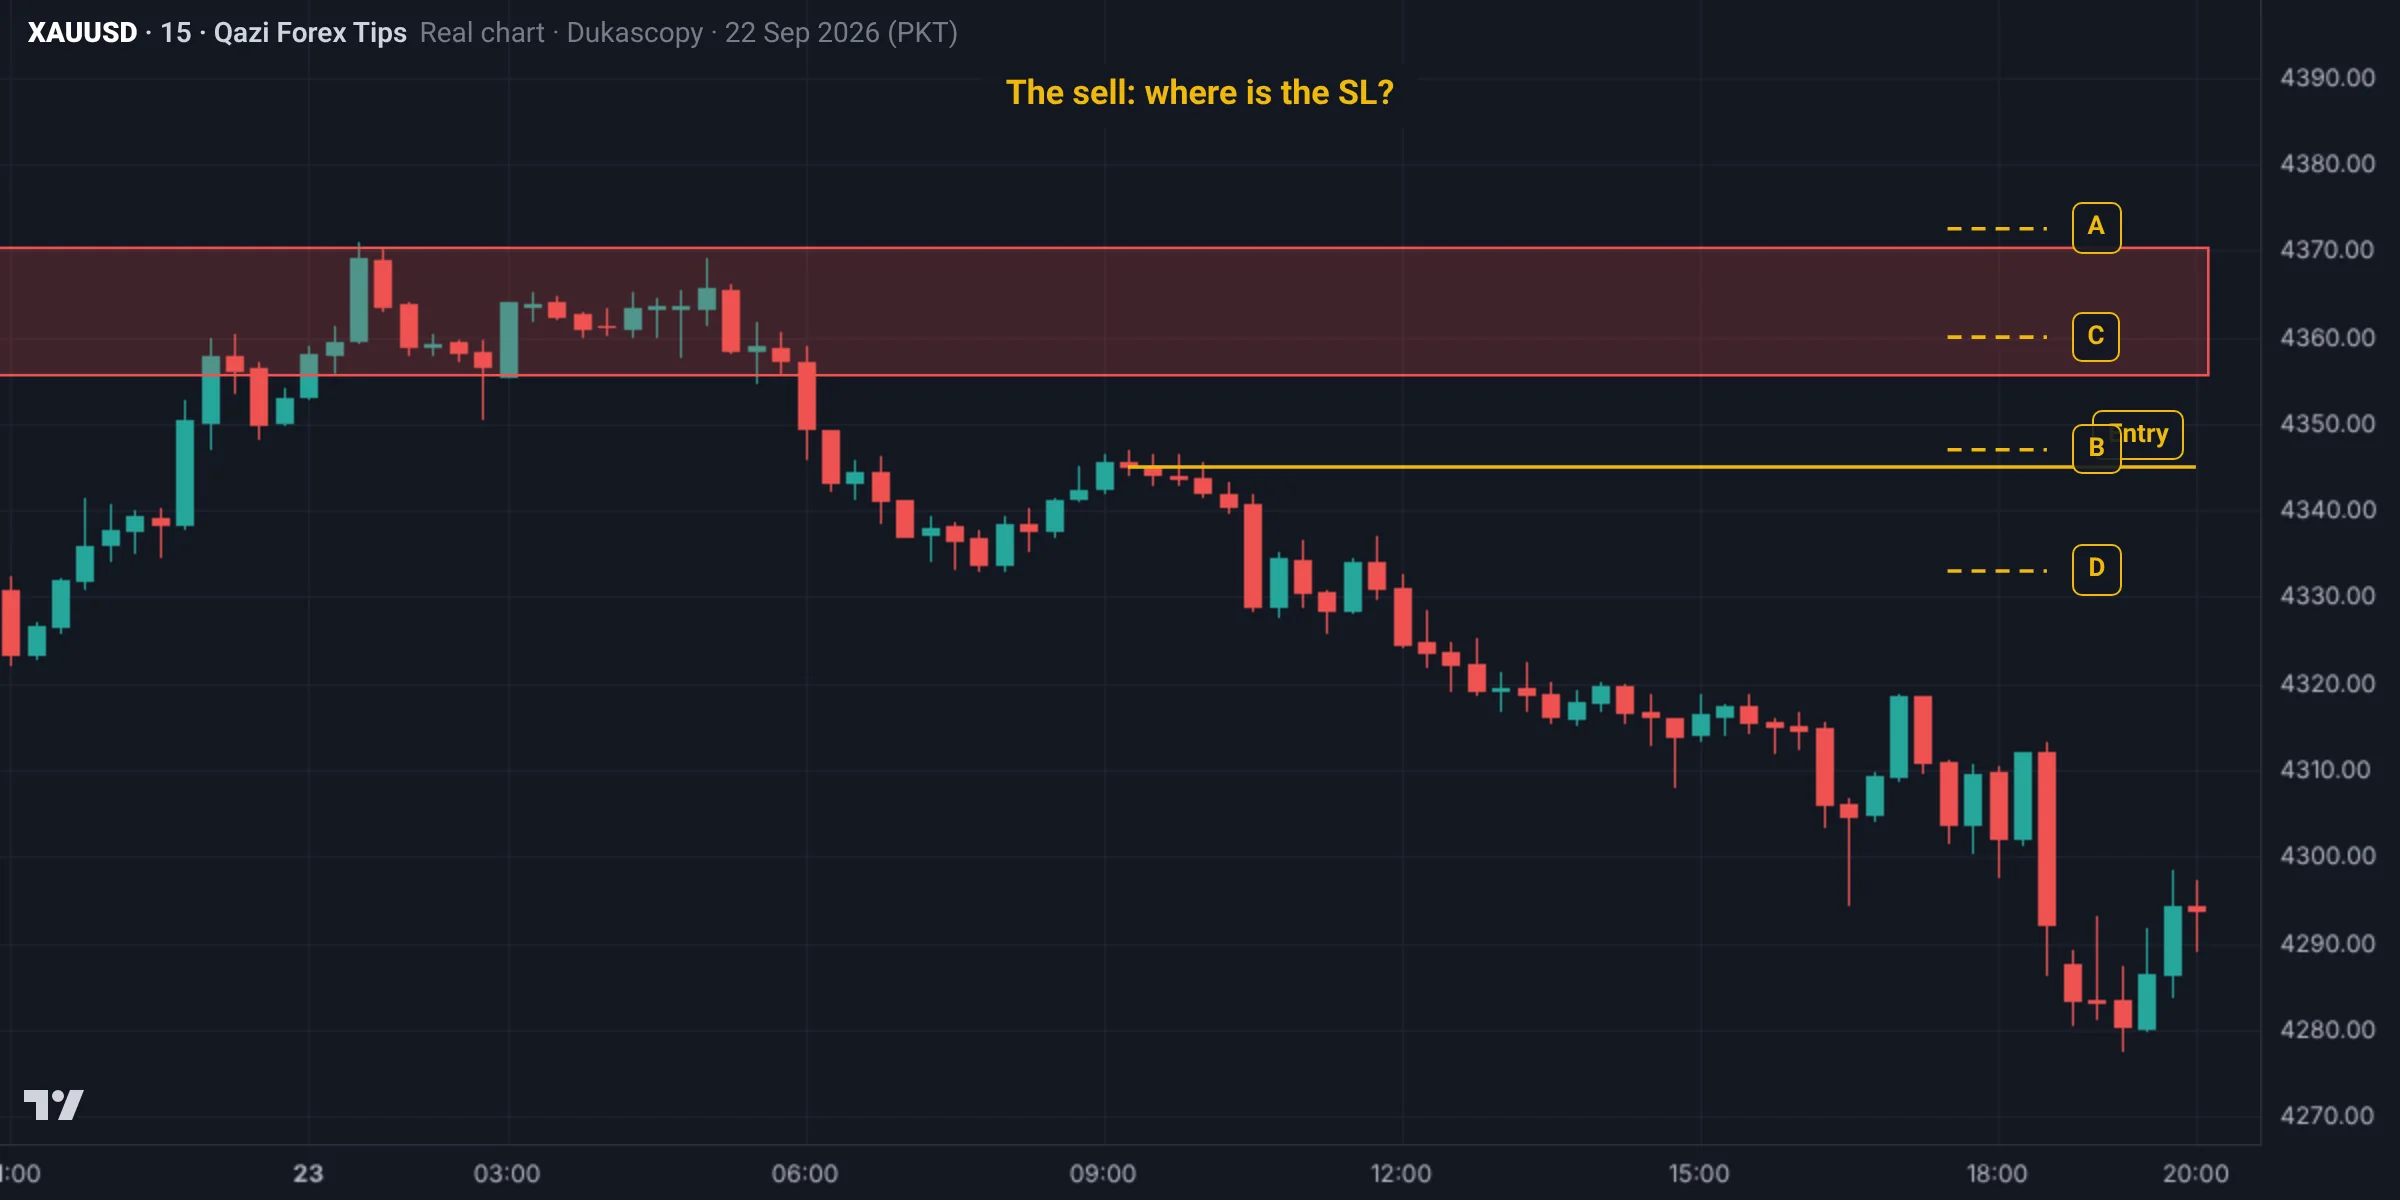
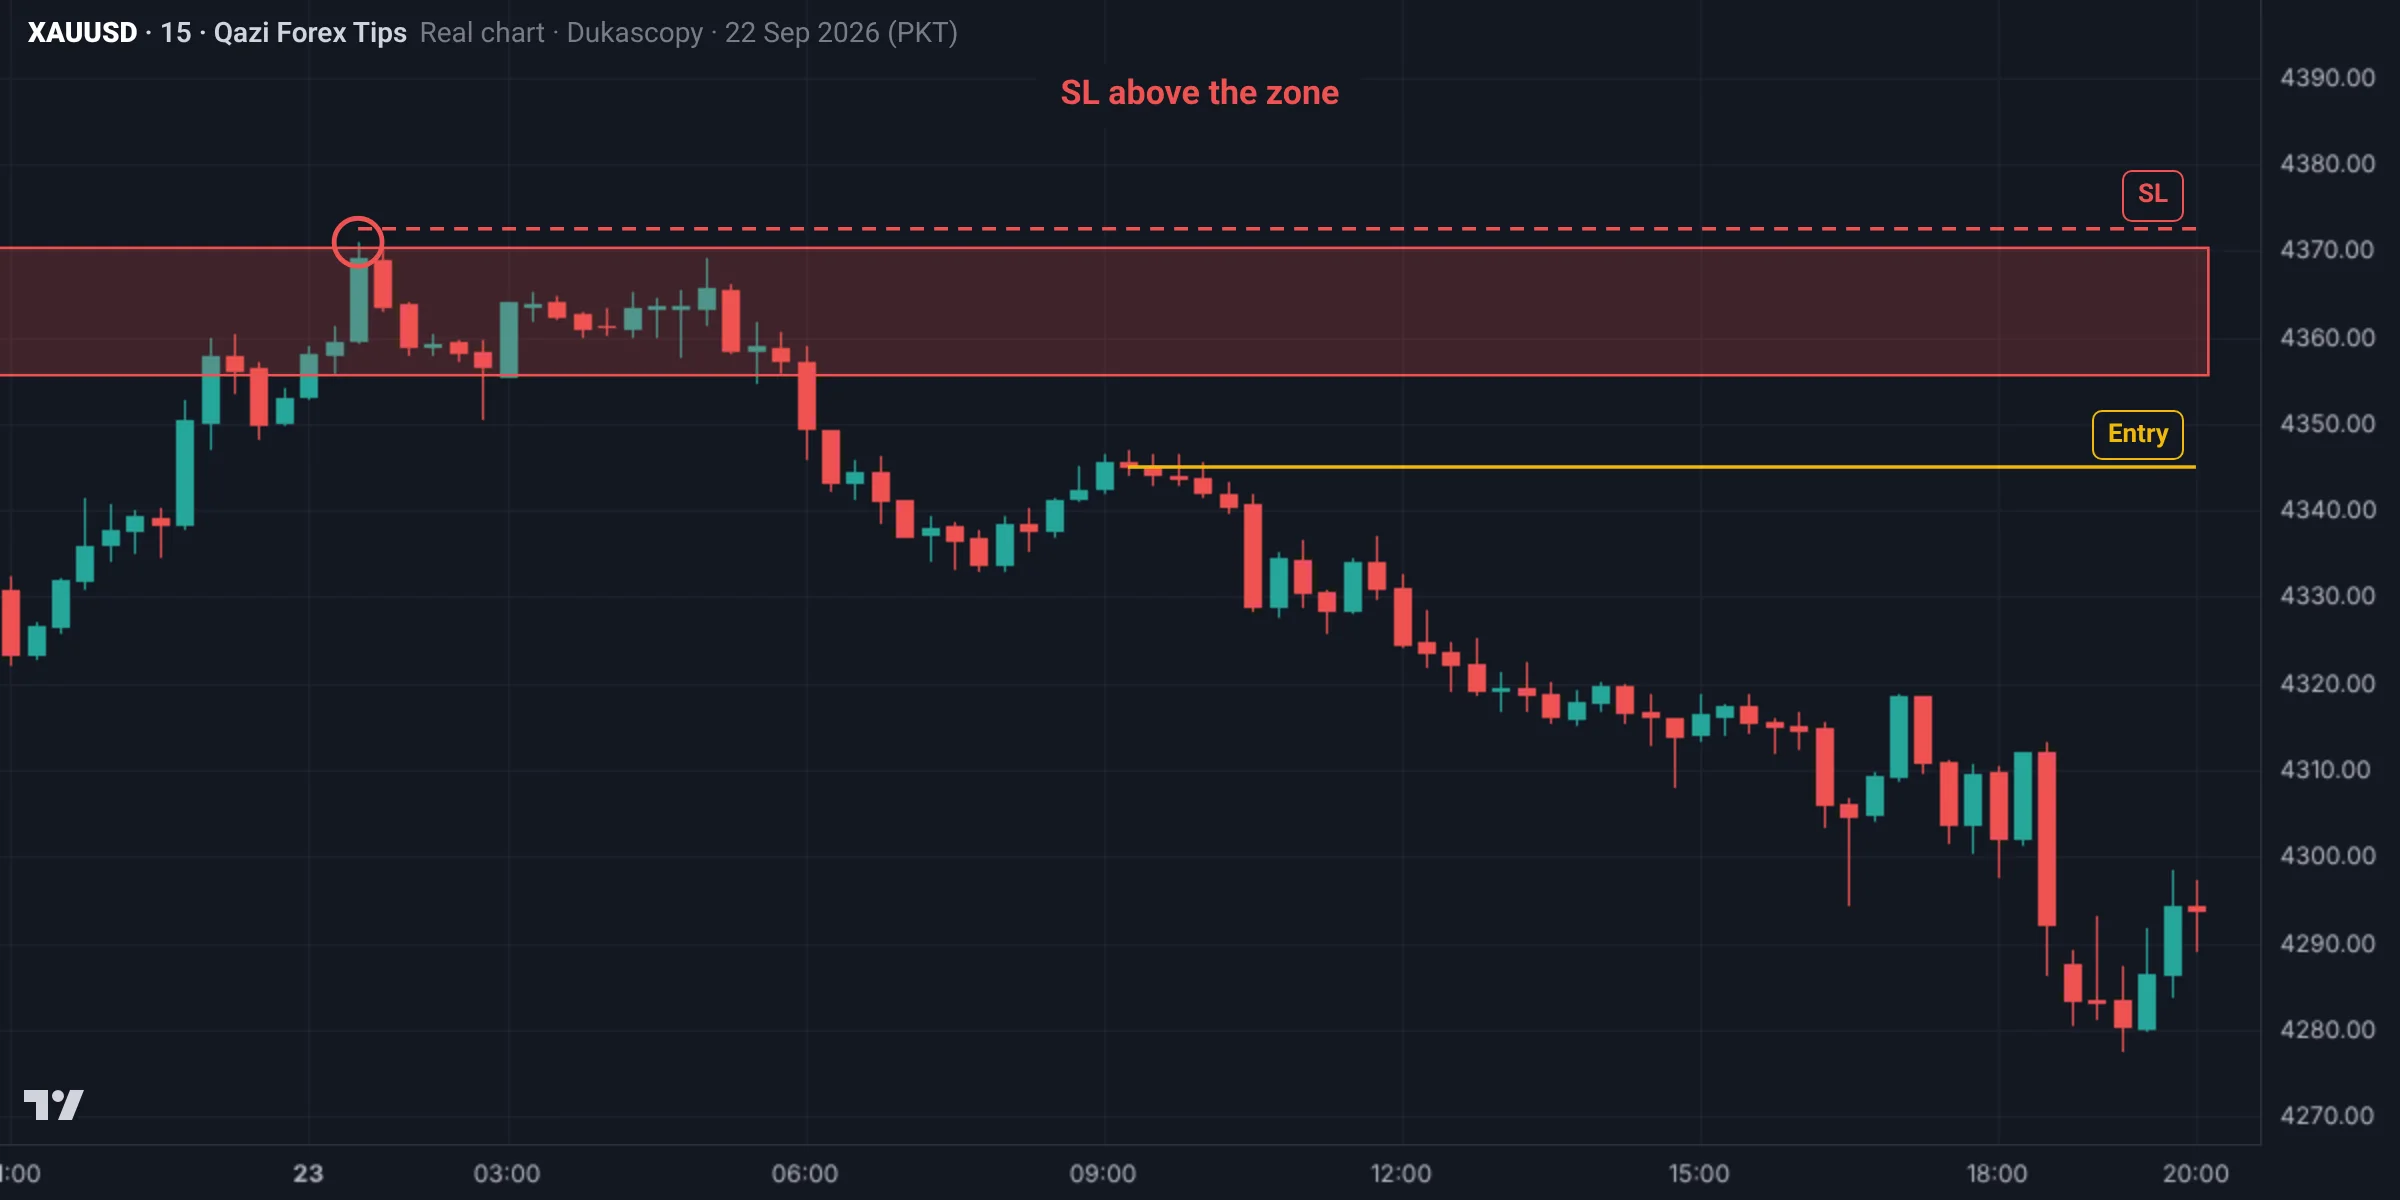
There is a confirmation sell near 4,345.0 at 09:15 on 23 Sep (the zone's top was 4,371.0). Where should the SL go?
A (4,372.5): above the zone's top at 4,371.0, with room for the spread. If price gets there the bearish idea is wrong. B sits right next to the entry (a normal pullback will hit it), C is in the middle of the zone, and D is below the entry, the wrong side for a sell. On a 5,000-dollar account at 1% risk the lot is 50 ÷ (27.5 × 100) ≈ 0.01.
The marked chart
Test yourself: Lesson 6.1 quiz
10 questions. Pick one answer for each and you will see at once whether it is right and why. Your score and grade appear at the end. You need 70% to pass.
0 correct · 0 / 10
Question 1After 6 straight losses at 10% risk, roughly how much of the account is left?
At 1% about 94.1% remains and only 6.2% is needed to recover; at 10% you need 88.2%.
Question 2What is the per-trade risk limit for a new trader?
The first rule of risk.
Question 3A 2,000-dollar account, 1% risk, an 8-dollar stop. What lot on Gold?
20 ÷ (8 × 100) = 0.025; rounding up pushes risk past the limit.
Question 4What are the daily and weekly limits?
Total risk on open trades at once is also at most 2%; when a limit is hit, close the platform.
Question 5How much buffer below the low should the stop have on Gold M5?
Spreads widen at night and around news; use a bigger buffer or don't trade.
Question 6In which direction may you move a stop?
You set the stop with a calm mind; now you are emotional.
Question 7Where is the stop in model B?
Model A: below the sweep low; OB/breaker: below the zone; CRT: below candle 2's swept low.
Question 8At a 40% win rate, what RR do you need just to break even?
The common SMC rule: RR of at least 1:2.
Question 9Why is treating Gold and silver buys as separate risk wrong?
A "mental stop" is also a mistake; it doesn't work in news.
Question 10A 1,500-dollar account, an 8.5-dollar stop. The formula gives 0.0176. What is the real risk?
The PDH target at 4,140 is 21 dollars away, 1:2.5.
Lesson checklist
Tick each point once you understand it. Your ticks are saved in this browser.
Assignment
- Write the dollar amount of 1% and 0.5% risk for your account.
- Build your own lot size table for stops of $5, $8, $10, $15 and $20.
- Write your daily, weekly and open-risk limits and stick them by your screen.
- Review your last 20 trades: how many risked more than 1%? How often did you move the stop?
- Post your table in the group.
Post your assignment screenshots with your reasons in our free Facebook group, where your charts will be checked.
Join the free group
Who wrote this lesson
Dr. Qazi Abdul Basit, Ph.D
Ph.D in Business Administration and a forex and Gold trader since 2013. Founder of Qazi Forex Tips, which teaches traders in Pakistan and India price action, risk management and trading psychology in their own language: 65 student batches so far, free courses on YouTube, and MT5 tools for traders (QFT Replay Simulator, QFT Trade Assistant).
- 2013 trading since
- 75K+ Facebook group members
- 65 student batches
- 15K+ YouTube subscribers
How this lesson was made: the content follows Dr. Qazi's teaching method and years of trading. Real charts are built from Dukascopy Gold (XAUUSD) data, and backtest results are shown as they came out, even when negative. We do not sell signals, manage accounts or take money from any broker. Last updated: 19 November 2026.
Questions
How do I calculate lot size for Gold?
Lot size equals risk in dollars divided by the stop distance in dollars times 100, rounded down, since one standard lot of Gold is 100 ounces.
How much should I risk per trade?
Between 0.5% and 1% of the account; new traders should never exceed 1%.
Where should the stop loss go?
Where price would prove the idea wrong, behind structure with a small buffer.
What is drawdown in forex?
How far the account has fallen from its highest point. From 10,000 to 9,200 is an 8% drawdown. Set daily and total drawdown limits and stop trading when one is hit.
What does floating loss mean?
The current loss on an open trade, not final until the trade closes. Removing the stop and hoping during a floating loss is the most dangerous habit.
Read more
Education only, not financial advice. Trading forex, Gold and CFDs carries a high risk of loss. SMC concepts describe tendencies, not guarantees. Lesson 33 of 38.