 Qazi Forex Tips

What is IDM?
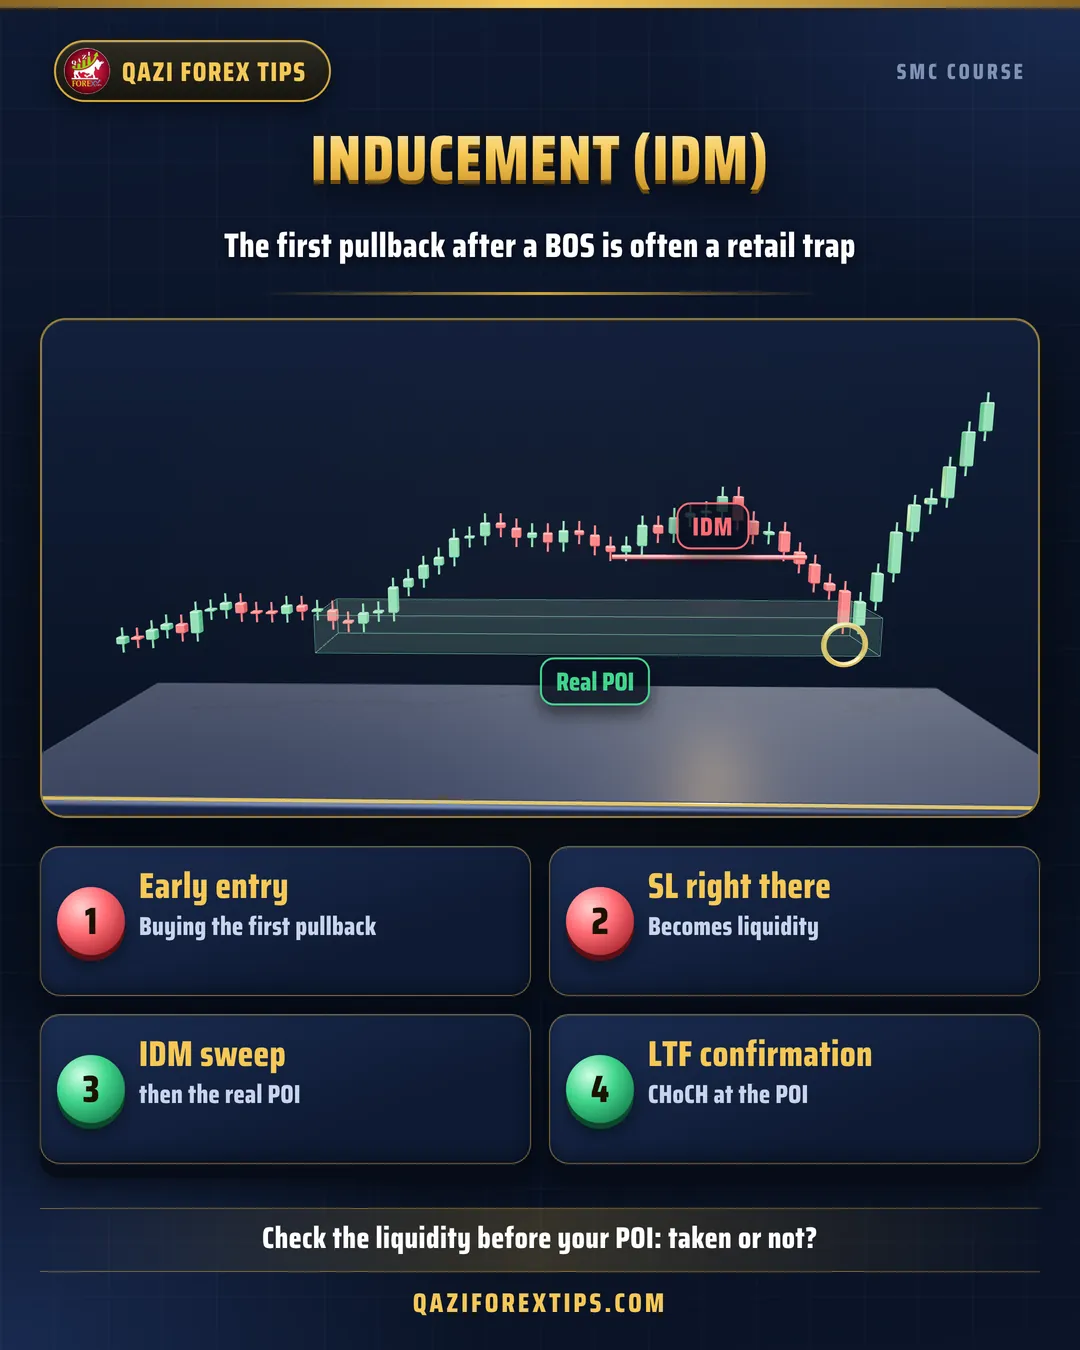
IDM (Inducement) means "luring in". The first small pullback after a BOS (an internal low in an uptrend) invites retail to enter early. Many traders buy there and keep their SL just under that small low. Those stops become liquidity. Price often sweeps that IDM first, then reaches the real zone (the POI), and makes the real move from there.
How to identify IDM
- Confirm the BOS first.
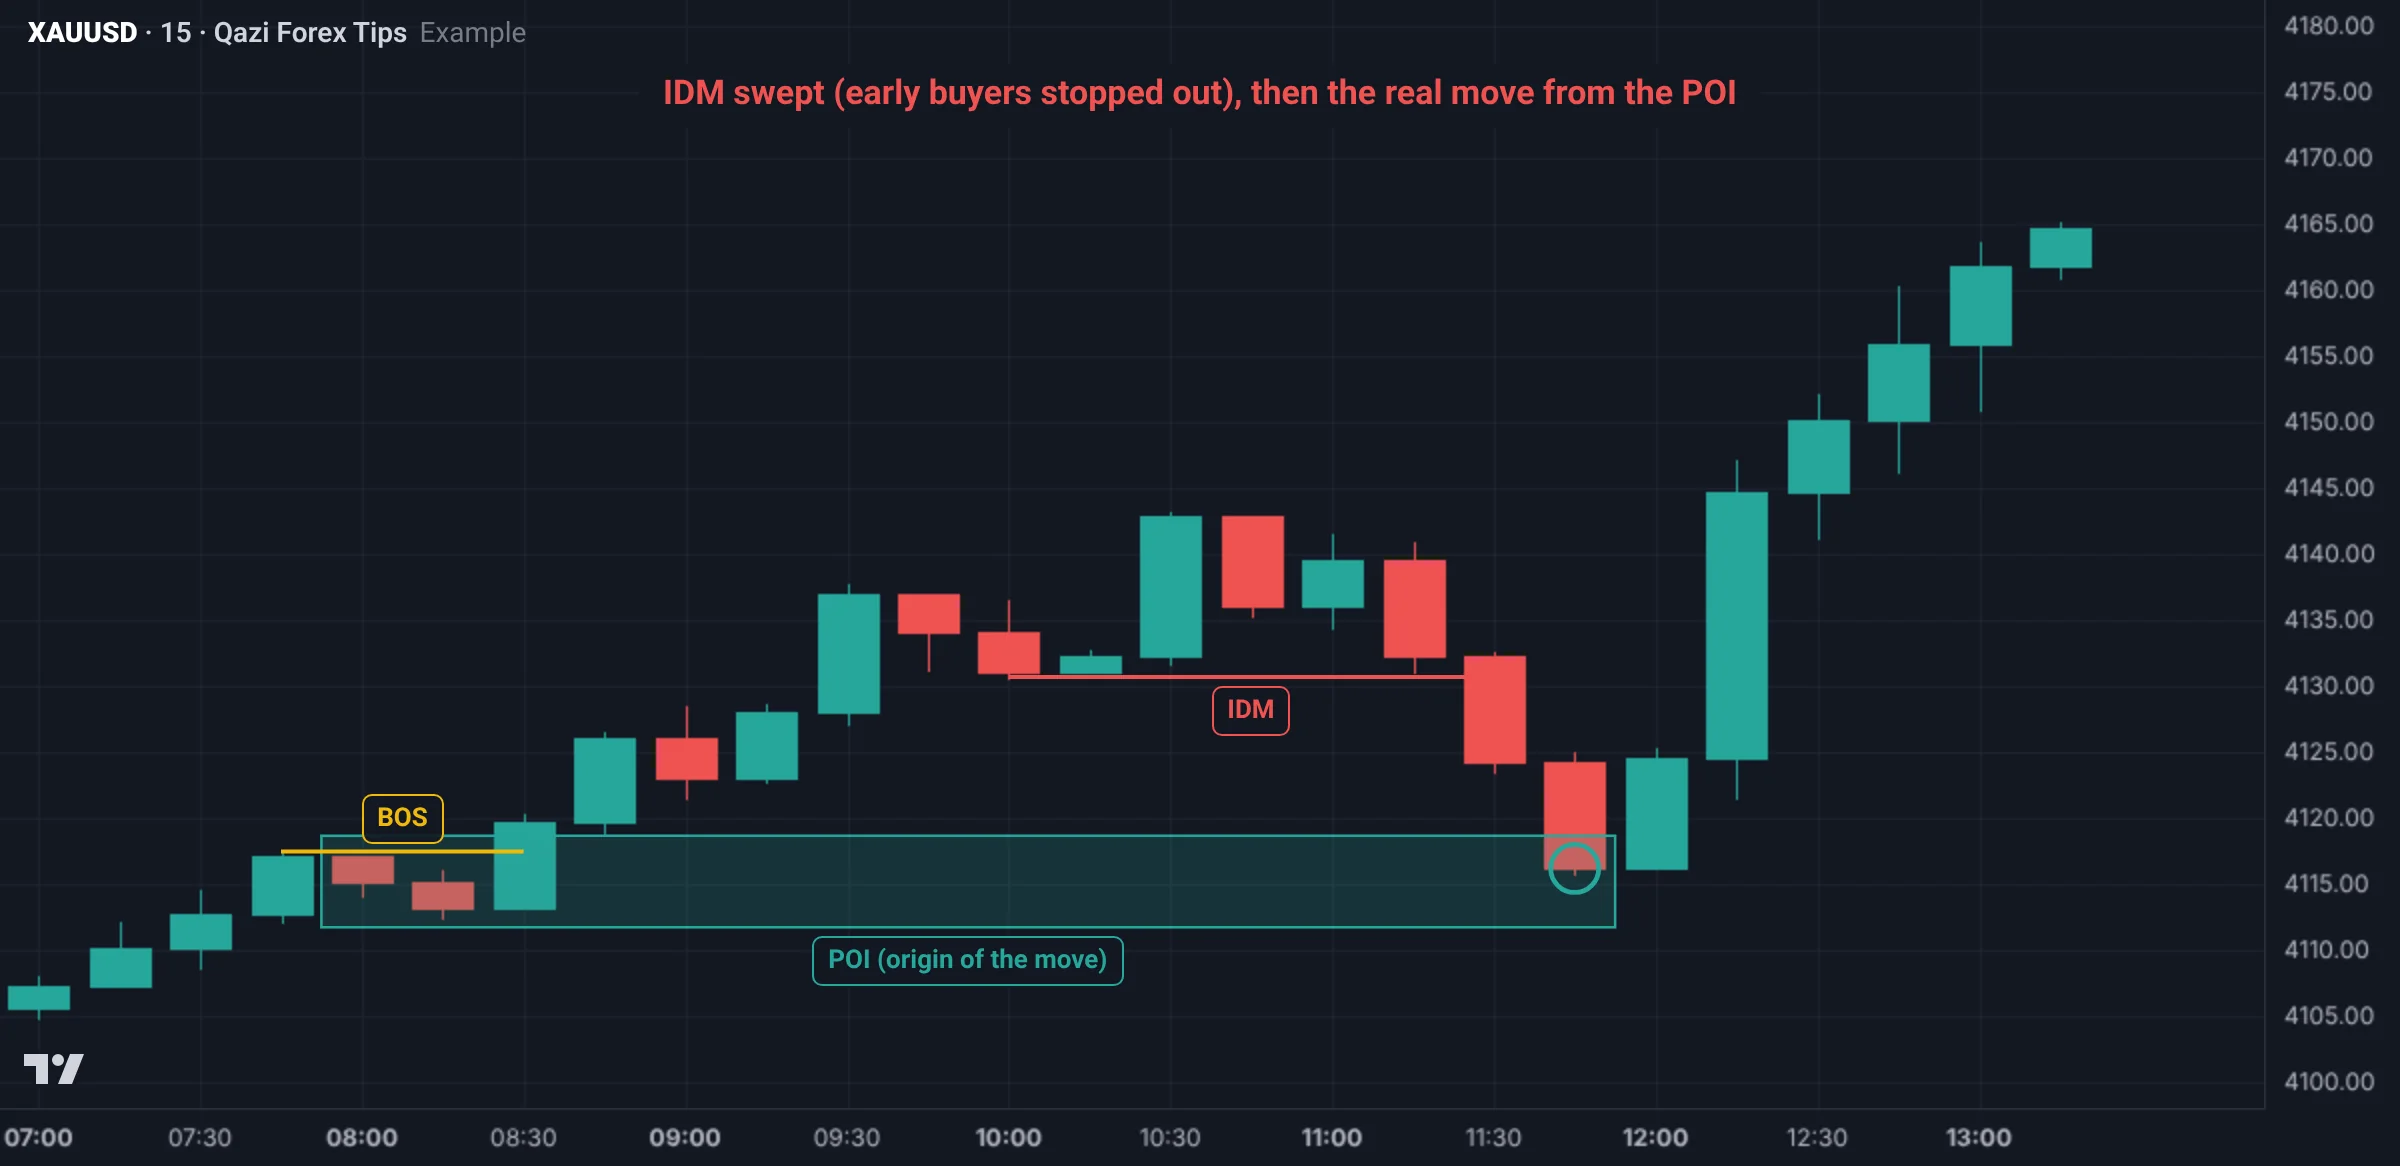
- Find the first internal pullback after the BOS (the first small low in an uptrend).
- Mark it as IDM.
- Below it, at the origin of the same BOS move, look for the POI (order block or FVG, Phase 3).
The rule: don't trust a POI before the IDM
- If the IDM has not been swept, the small zone above it is often a trap.
- When the IDM is swept and price reaches the POI, that POI is stronger.
Why does IDM work?
Big players need sellers in order to buy. When early buyers are stopped out, their stops become sell orders, which help the big buyer fill at a lower price. That is why an IDM sweep is often seen before price reaches the POI.
The limits of IDM
- IDM is not swept every time. In a strong trend price can leave without touching it.
- So IDM does not mean "always wait"; it means an entry before the IDM is higher risk: use a smaller risk, or skip it.
| Situation | What to do |
|---|---|
| IDM not taken yet, price at a small zone above | Avoid the entry, or use half risk |
| IDM swept and price reached the POI | Wait for a lower-timeframe CHoCH, then enter |
| IDM not swept and price made a new high | Let it go, don't chase |
Bearish IDM: the mirror image
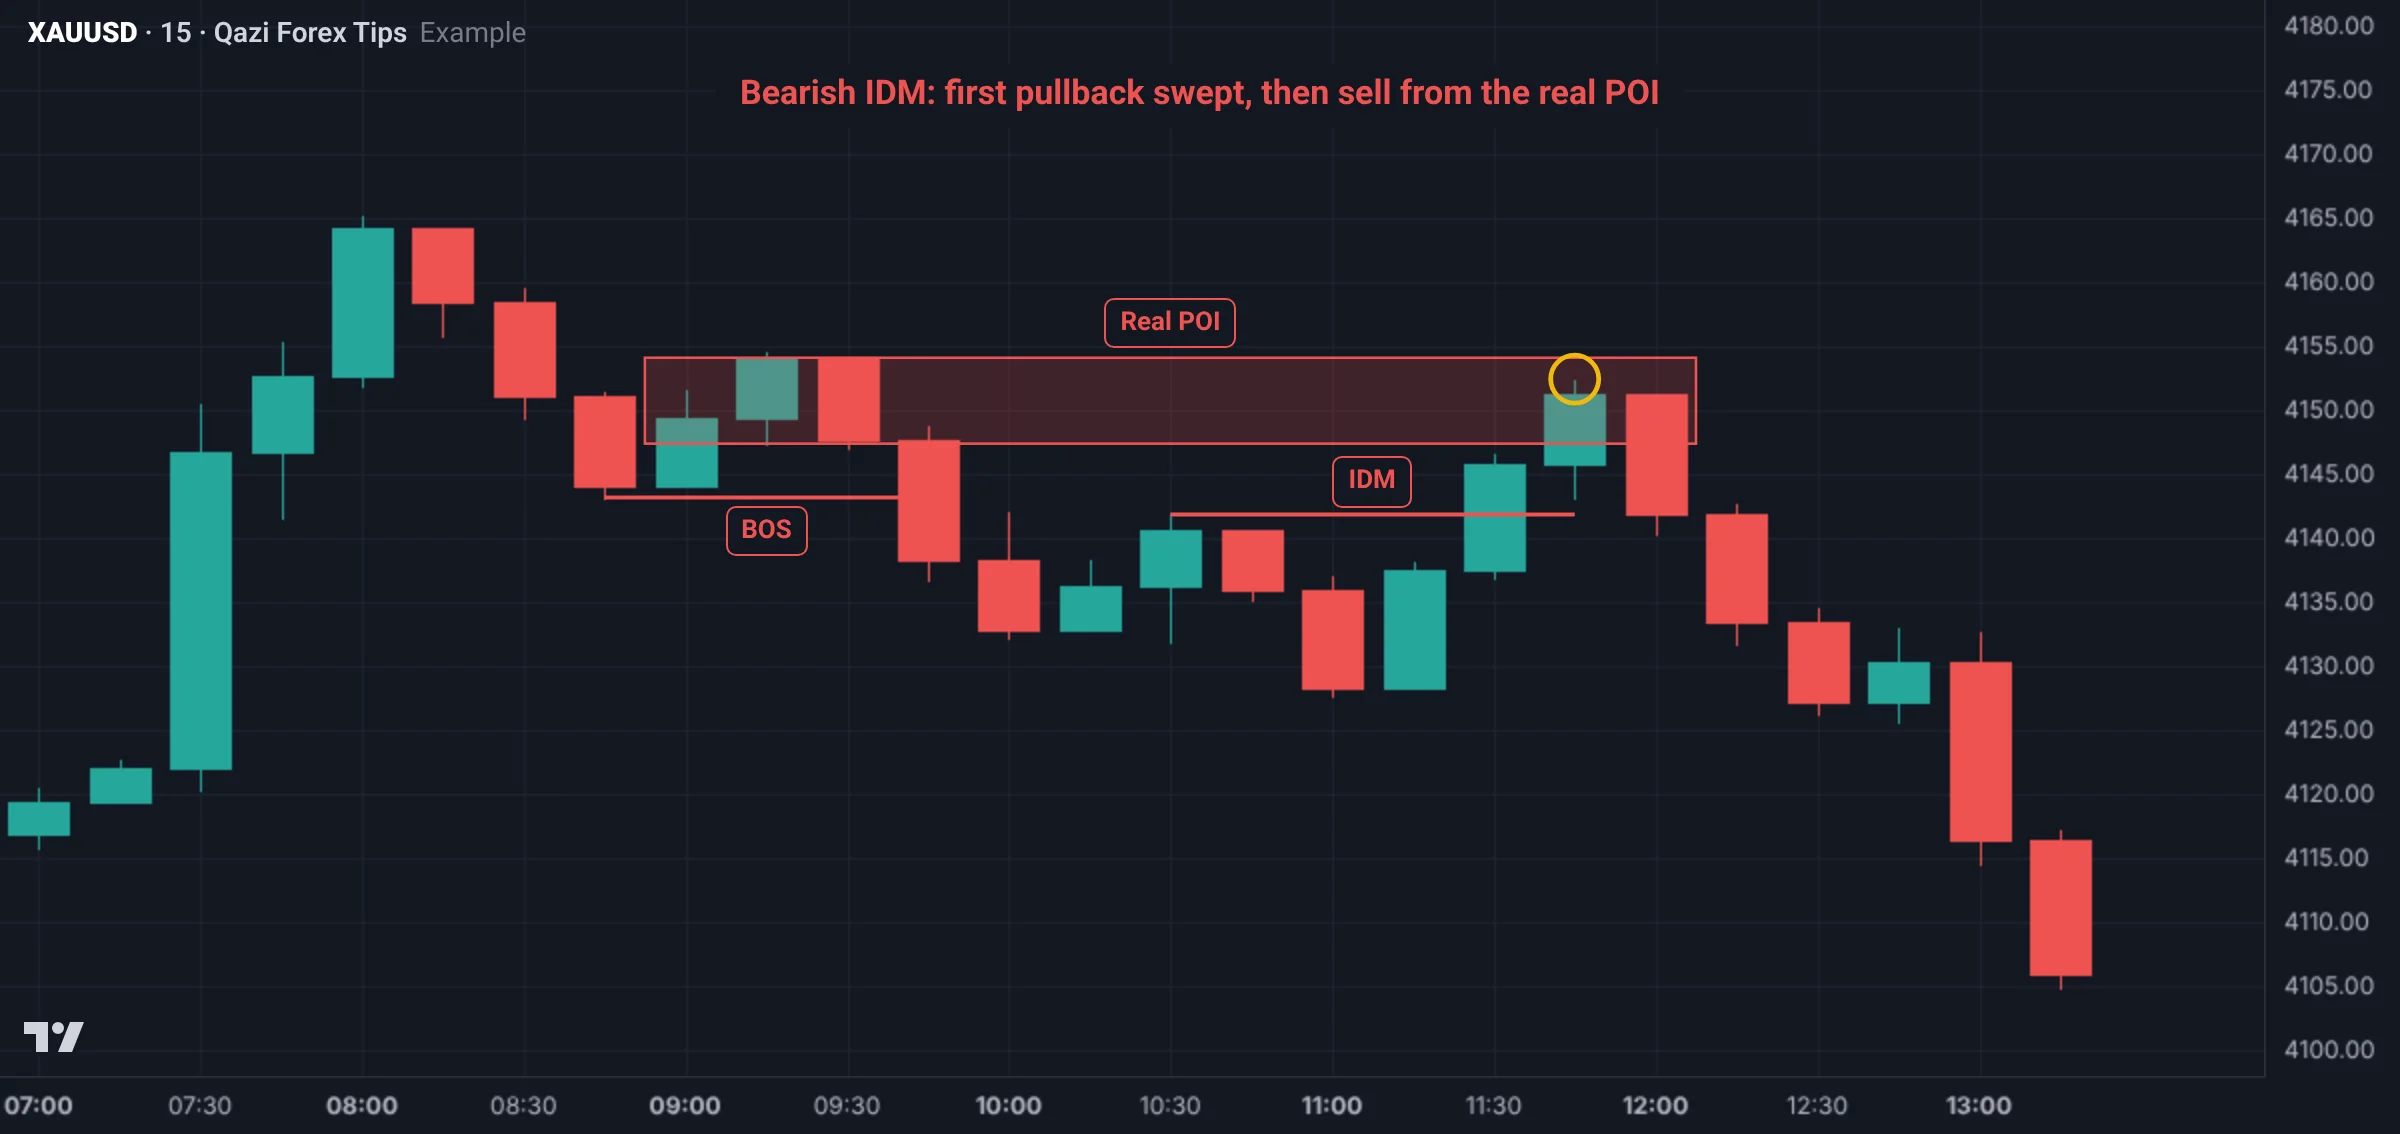
In a downtrend, after a bearish BOS the first pullback rises and makes a small high. Early sellers sell there with a stop above that high. That high is the bearish IDM. Price often sweeps it first, then reaches the real POI above (the origin of the BOS move) and falls.
Trading with IDM: step by step
- Mark the BOS (bullish in an uptrend, bearish in a downtrend).
- The first pullback after the BOS: its low (bullish) or high (bearish) is the IDM. Draw a line and write "IDM".
- Mark the real POI at the origin of the BOS move (order block or FVG, Phase 3).
- Don't place a limit order at the POI until the IDM is swept.
- When the IDM is swept and price reaches the POI, wait for a lower timeframe CHoCH.
- Enter after the CHoCH, stop behind the POI, target the next liquidity.
A Gold example (bearish)
H1 downtrend: price falls from a high at 4,162, breaks the low at 4,138 (BOS) and reaches 4,129.
- The first pullback rises to 4,141: this is the IDM. Many traders sell here with stops around 4,142.
- Real POI: the origin of the BOS move, the 4,155 to 4,160 zone.
- Price first reaches 4,143, taking the IDM stops, then climbs to 4,156 into the POI.
- After a bearish CHoCH on M15, sell near 4,153, stop 4,163, target 4,131. 10 dollars of risk for 22 dollars of target.
When IDM doesn't come
IDM is not swept every time. In a very strong trend (especially after big news) price leaves without touching the IDM. Then:
- Don't force a trade. If the chance is gone, it is gone.
- Wait for the next BOS and the next IDM.
- Write in your journal how often the IDM was swept and how often not; that is your backtest data.
Real Gold chart examples
Gold M15 on 9 Nov 2026 (data: Dukascopy, bid price; Pakistan time):
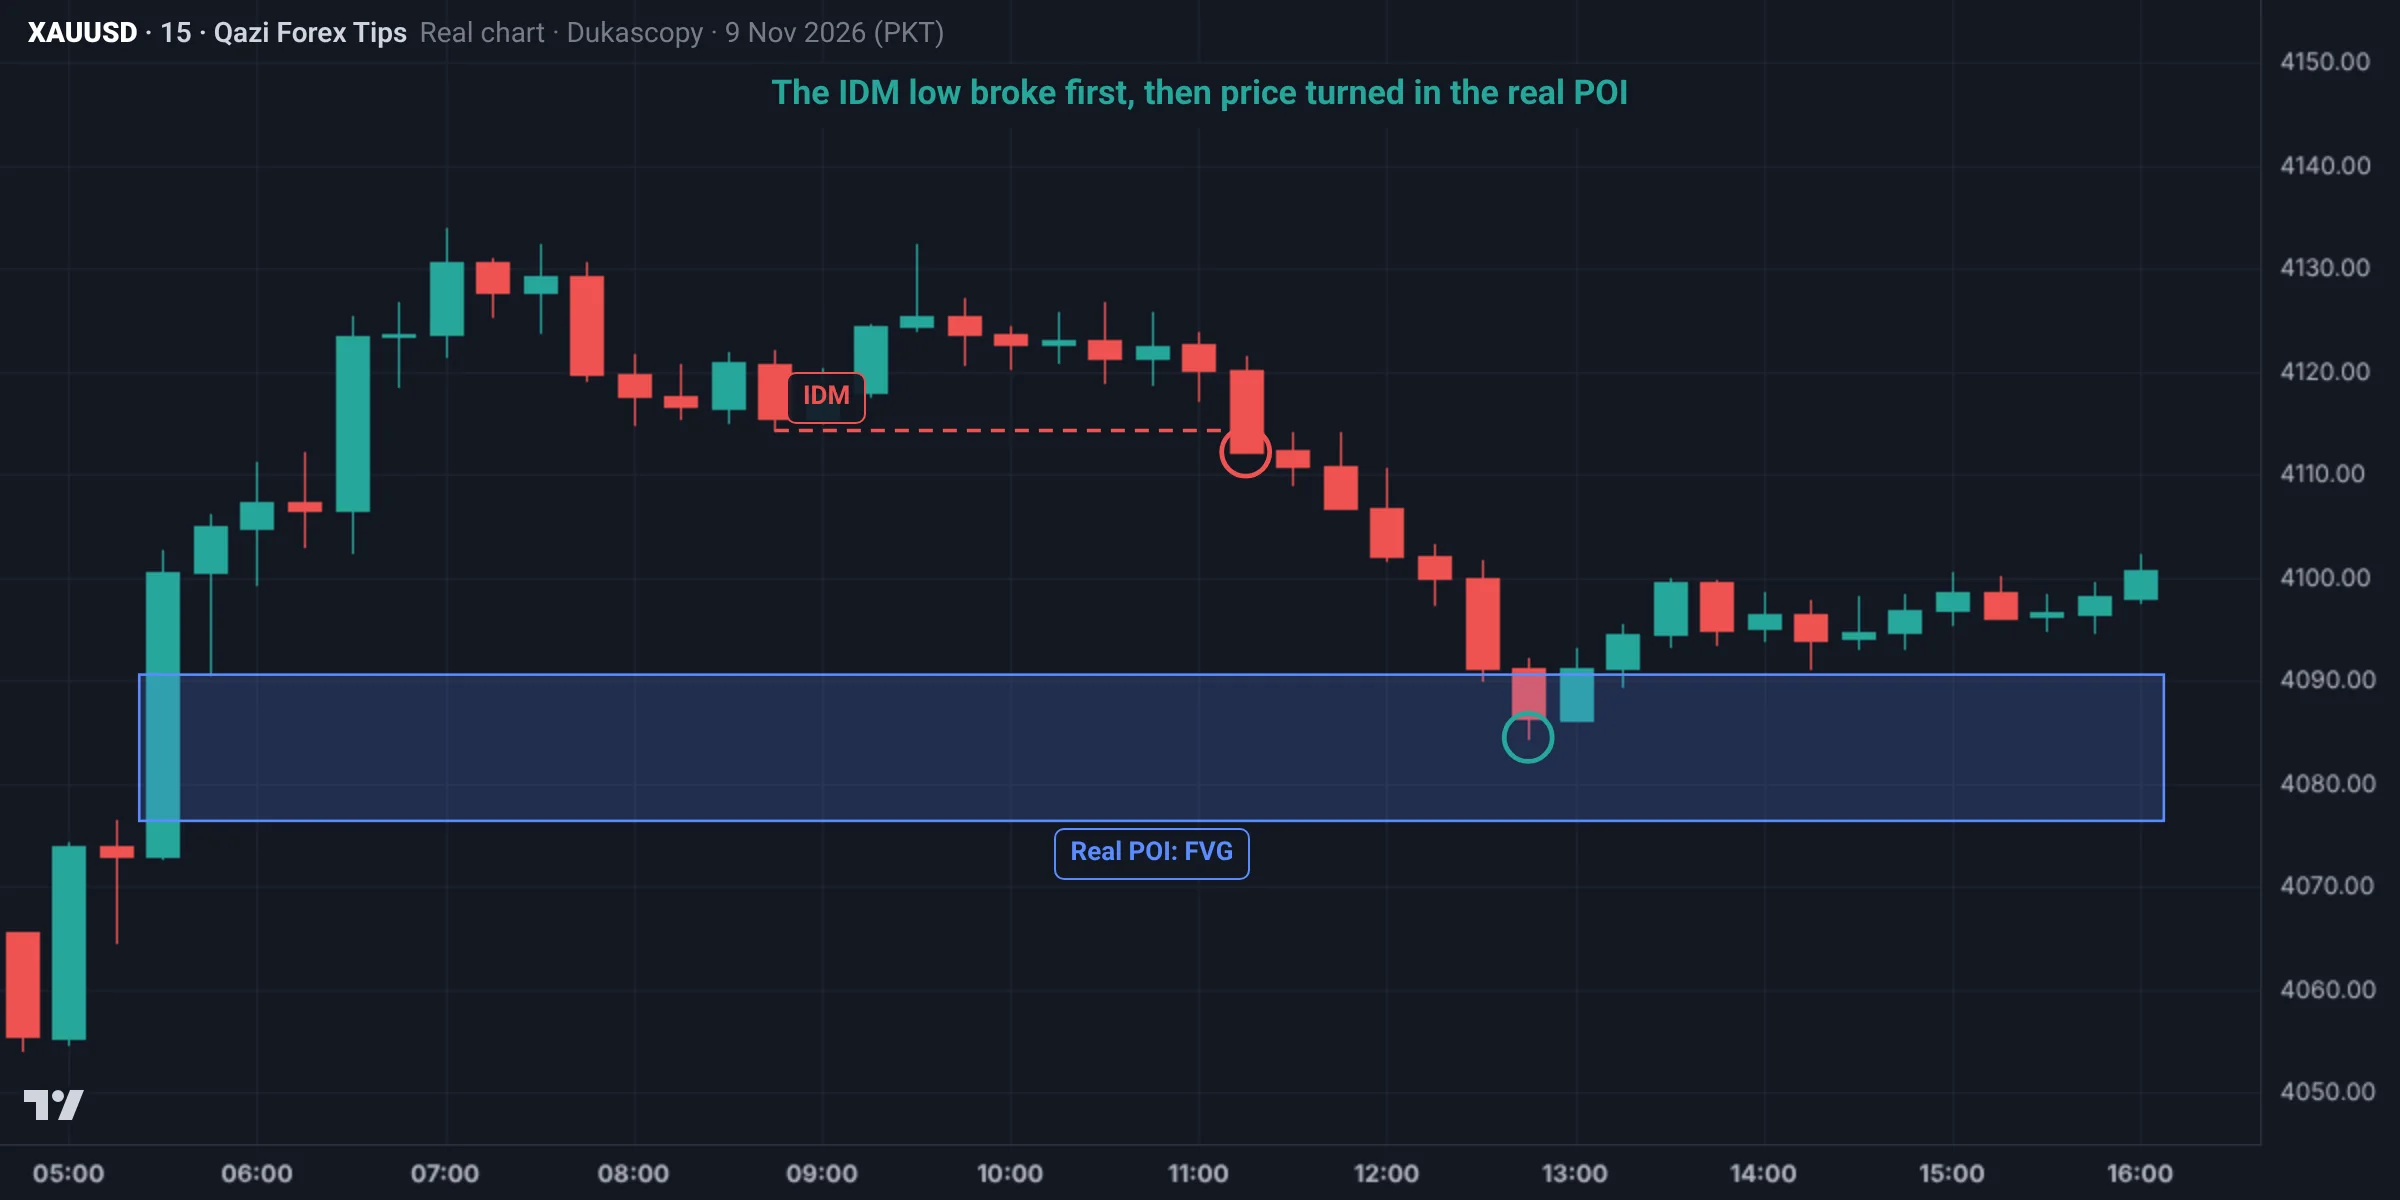
- From 05:00 to 07:00 price ran from 4,054.7 to 4,133.9. That move left an FVG at 4,076.4 to 4,090.6 at 05:30.
- In the pullback a small low formed at 4,114.3 at 08:45. Retail bought it as "support": that was the IDM.
- At 11:15 the low broke (low 4,112.2), those buyers were stopped out, and price reached 4,084.5 at 12:45: inside the real FVG, at about 62% of the move.
- Price turned there and reached 4,148.6 the next night. The real POI was the zone after the IDM.
Second example: a bearish IDM (30 Oct)
Gold M15 on 30 Oct 2026 (data: Dukascopy, bid price; Pakistan time), inducement on the bearish side:
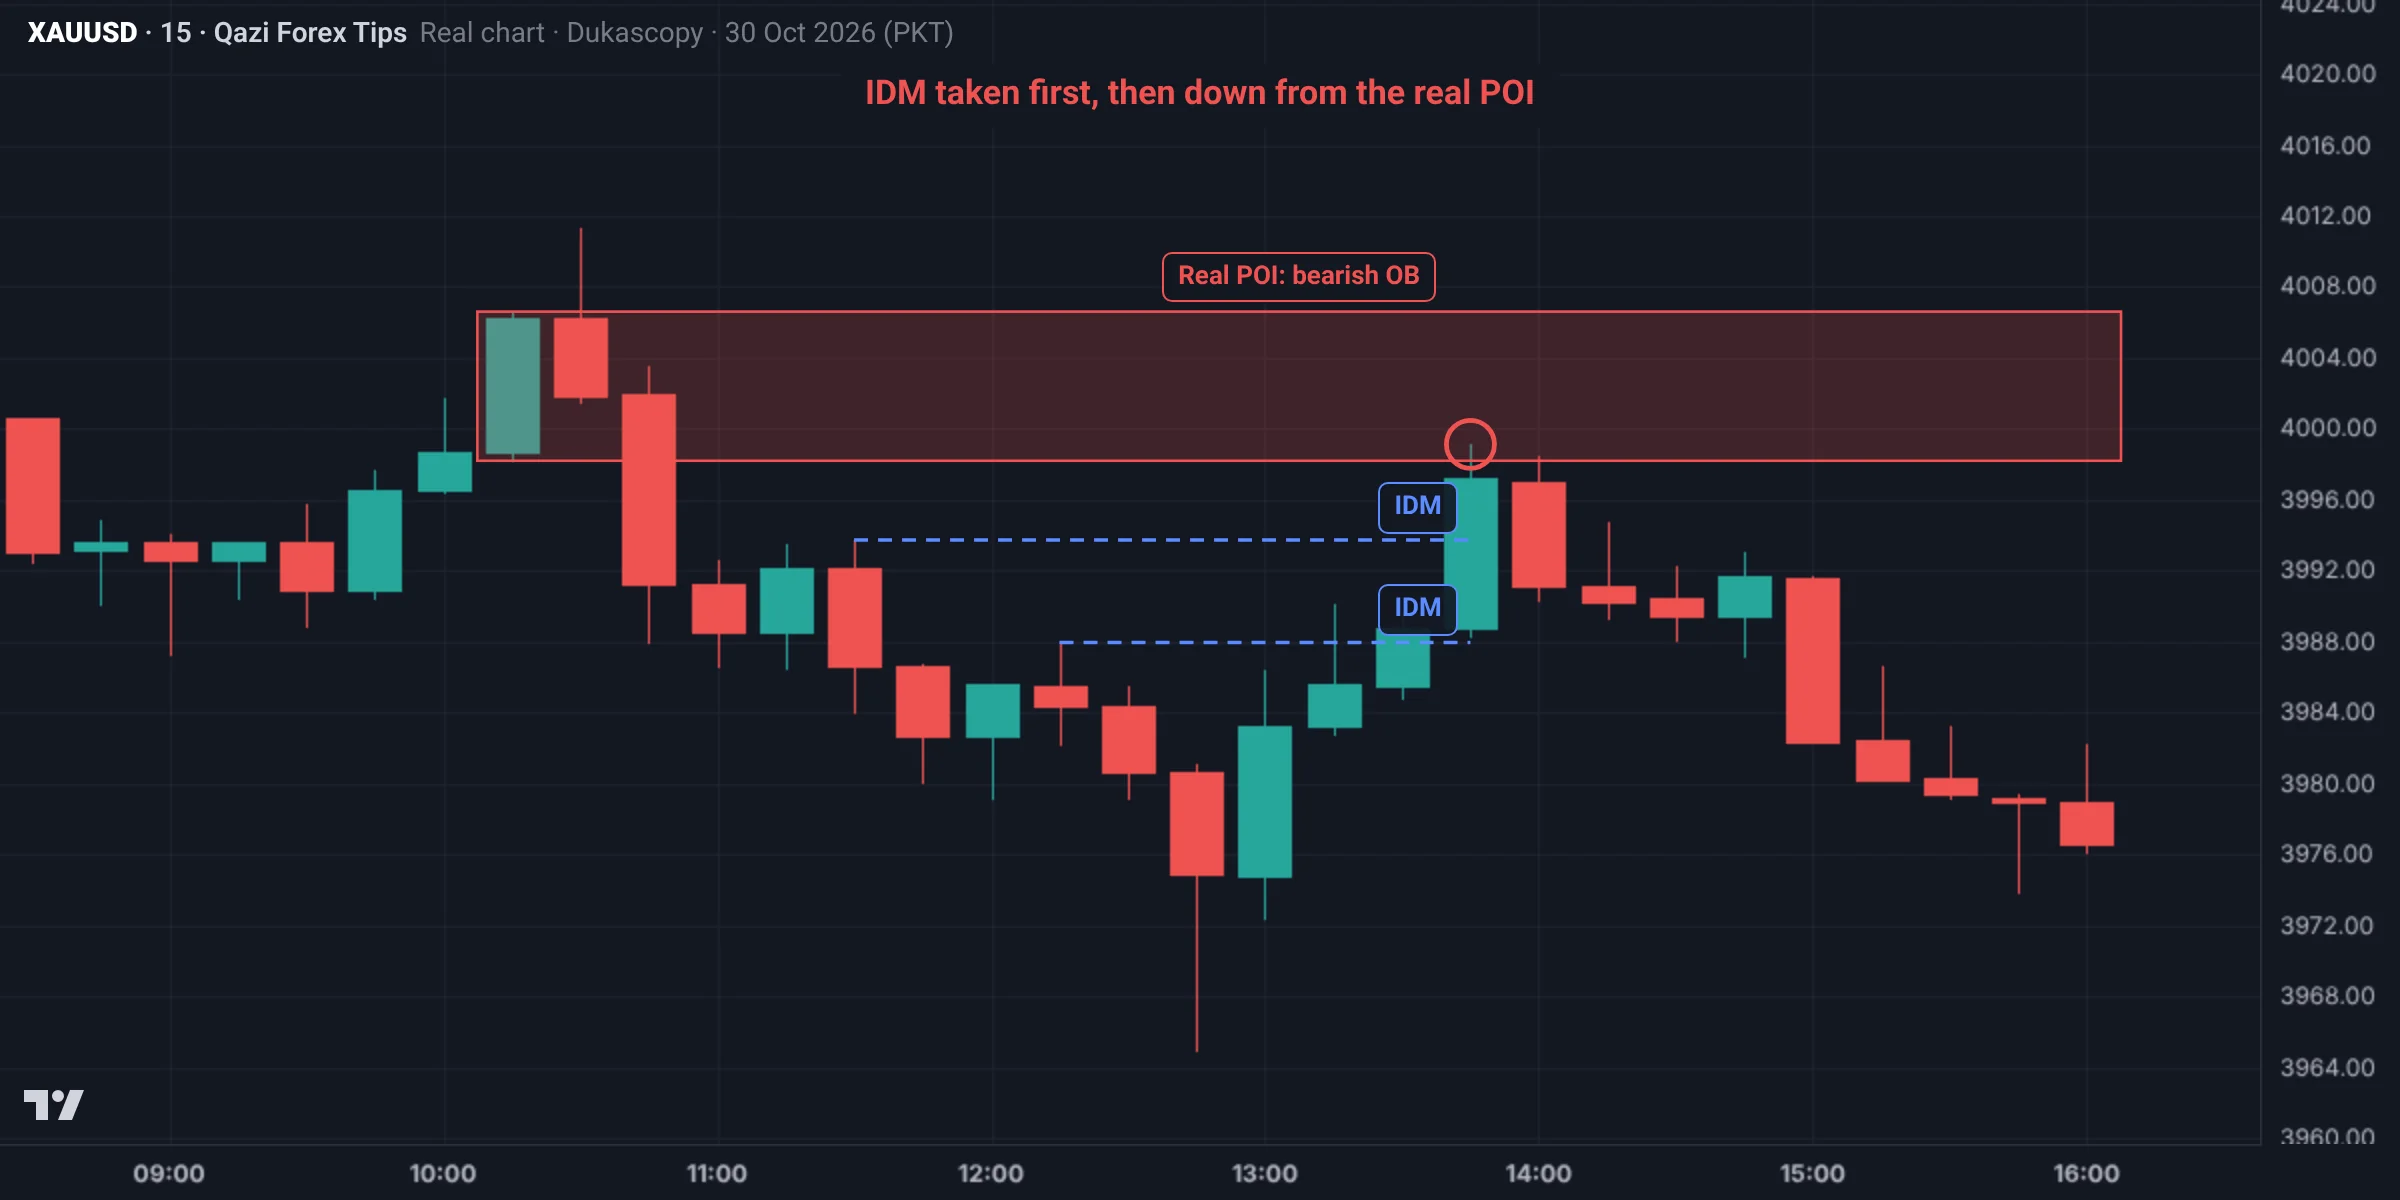
- Real POI: the 10:15 green candle (3,998.2 to 4,006.6), the last green candle before the big move down: a bearish order block. Then a high formed at 4,011.3 at 10:30 and price fell.
- IDM: on the way down two small highs formed: 3,993.7 at 11:30 and 3,988.0 at 12:15. Early sellers sold there with stops above them.
- From 13:00 to 13:45 price rose, took both IDMs, and reached 3,999.1 at 13:45, inside the real POI.
- Gold then turned and reached 3,877.5 that night.
Whoever sold at the IDM was stopped out; whoever waited for the IDM sweep and the real POI got the best location.
Common mistakes
Summary
- IDM = the first pullback after a BOS, where early traders enter.
- Price often sweeps the IDM first, then reaches the real POI.
- Enter only after the IDM sweep and a CHoCH inside the POI.
Spot it on the chart: practice
This is a real Gold chart (Dukascopy data, Pakistan time). Study it and pick an answer. After you answer, the fully marked chart and the explanation appear.
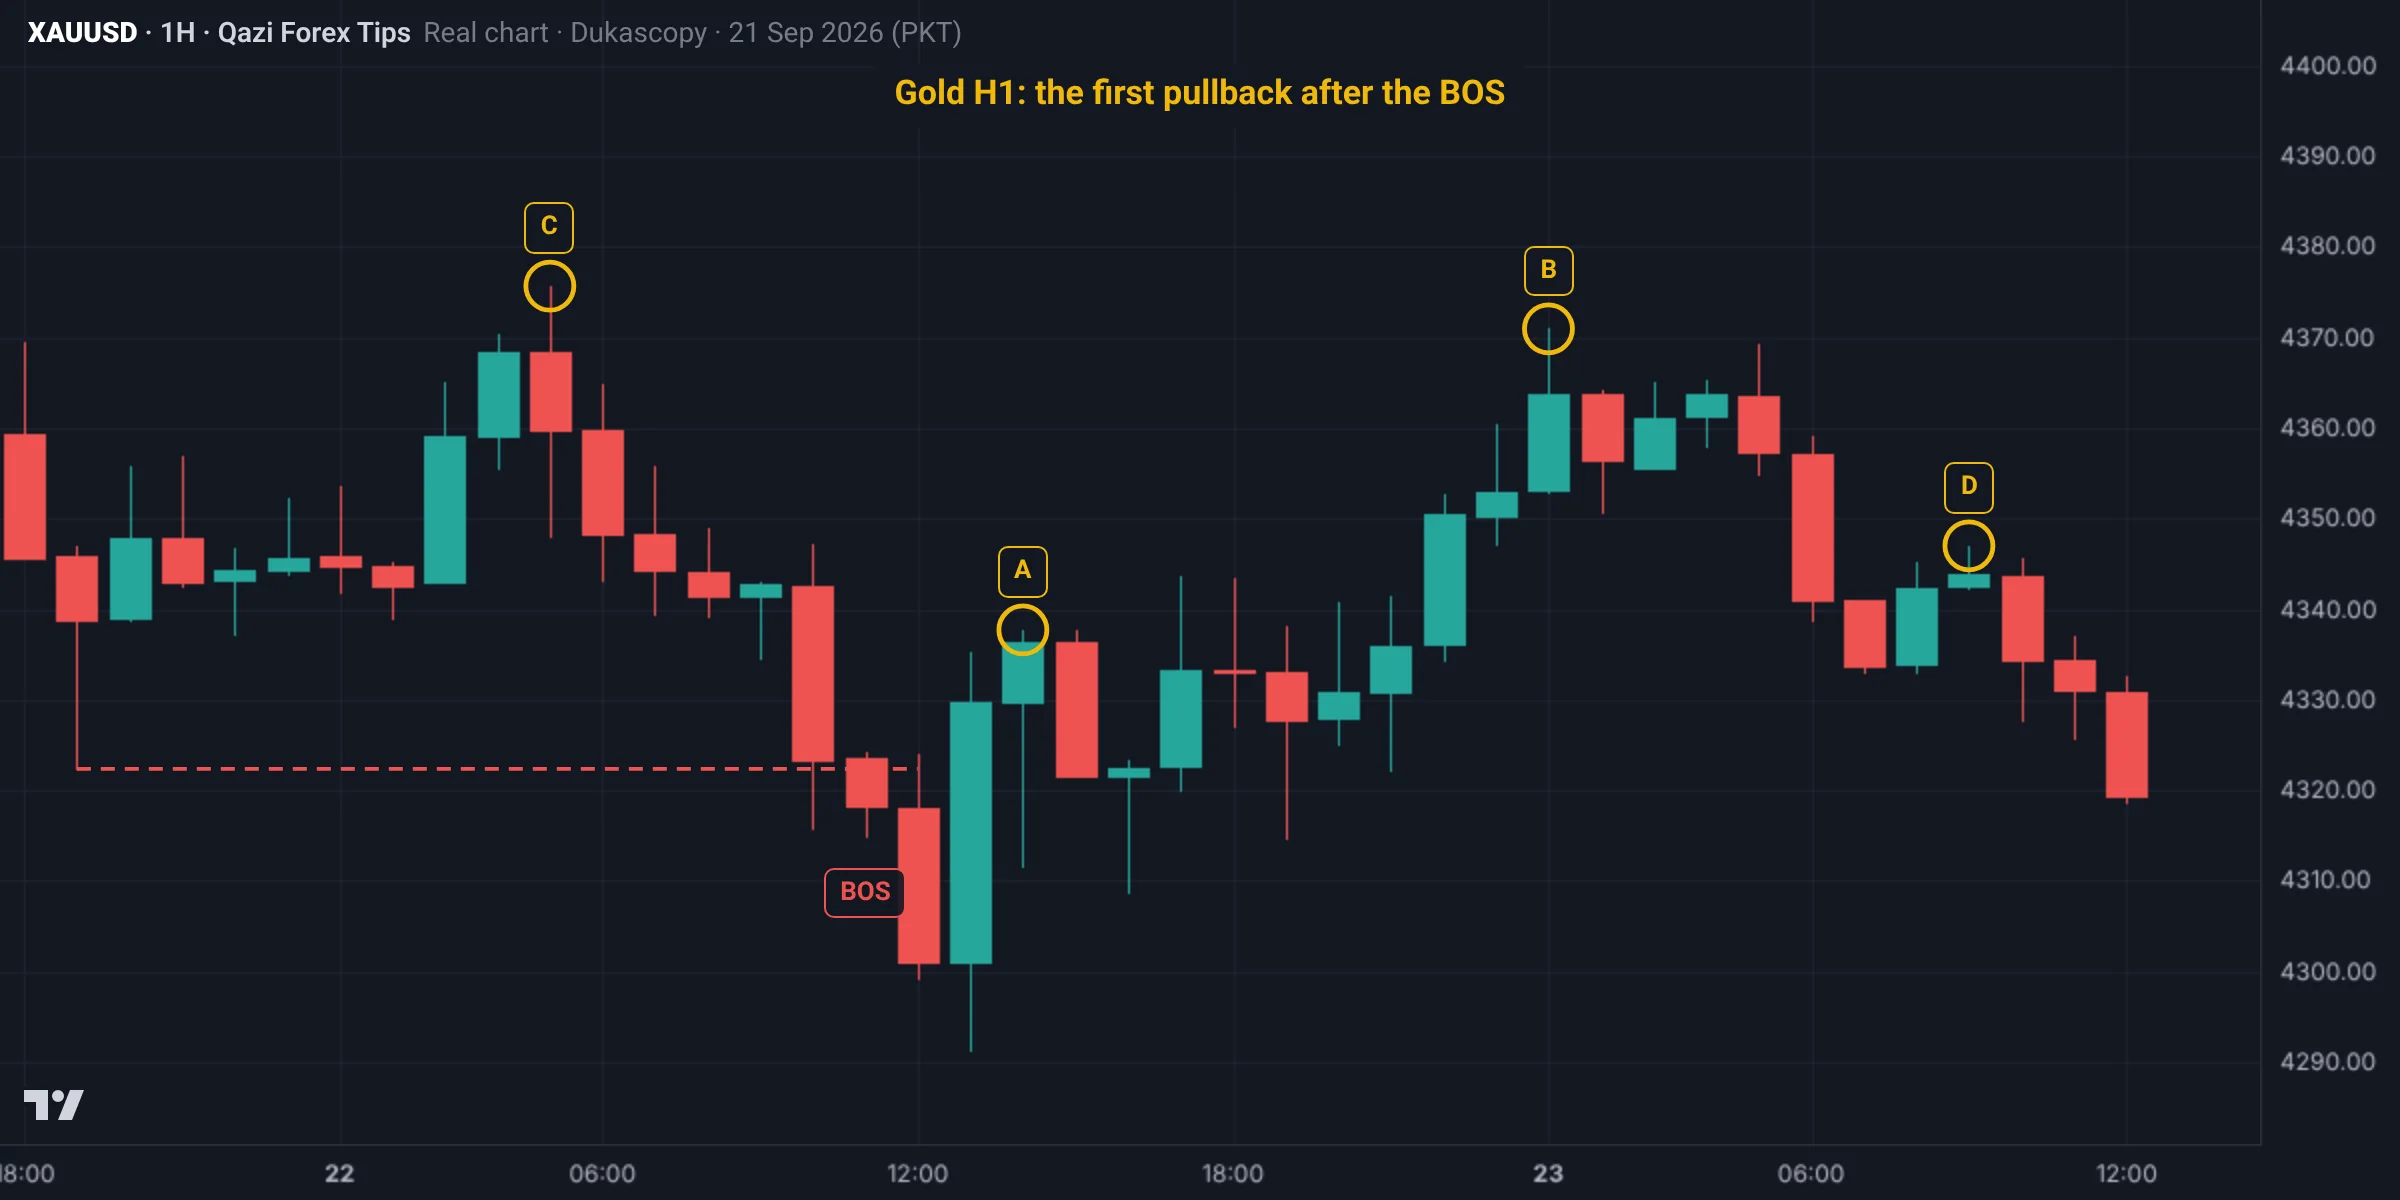
After the BOS at 11:00 on 22 Sep, which is the IDM (the first small pullback high)?
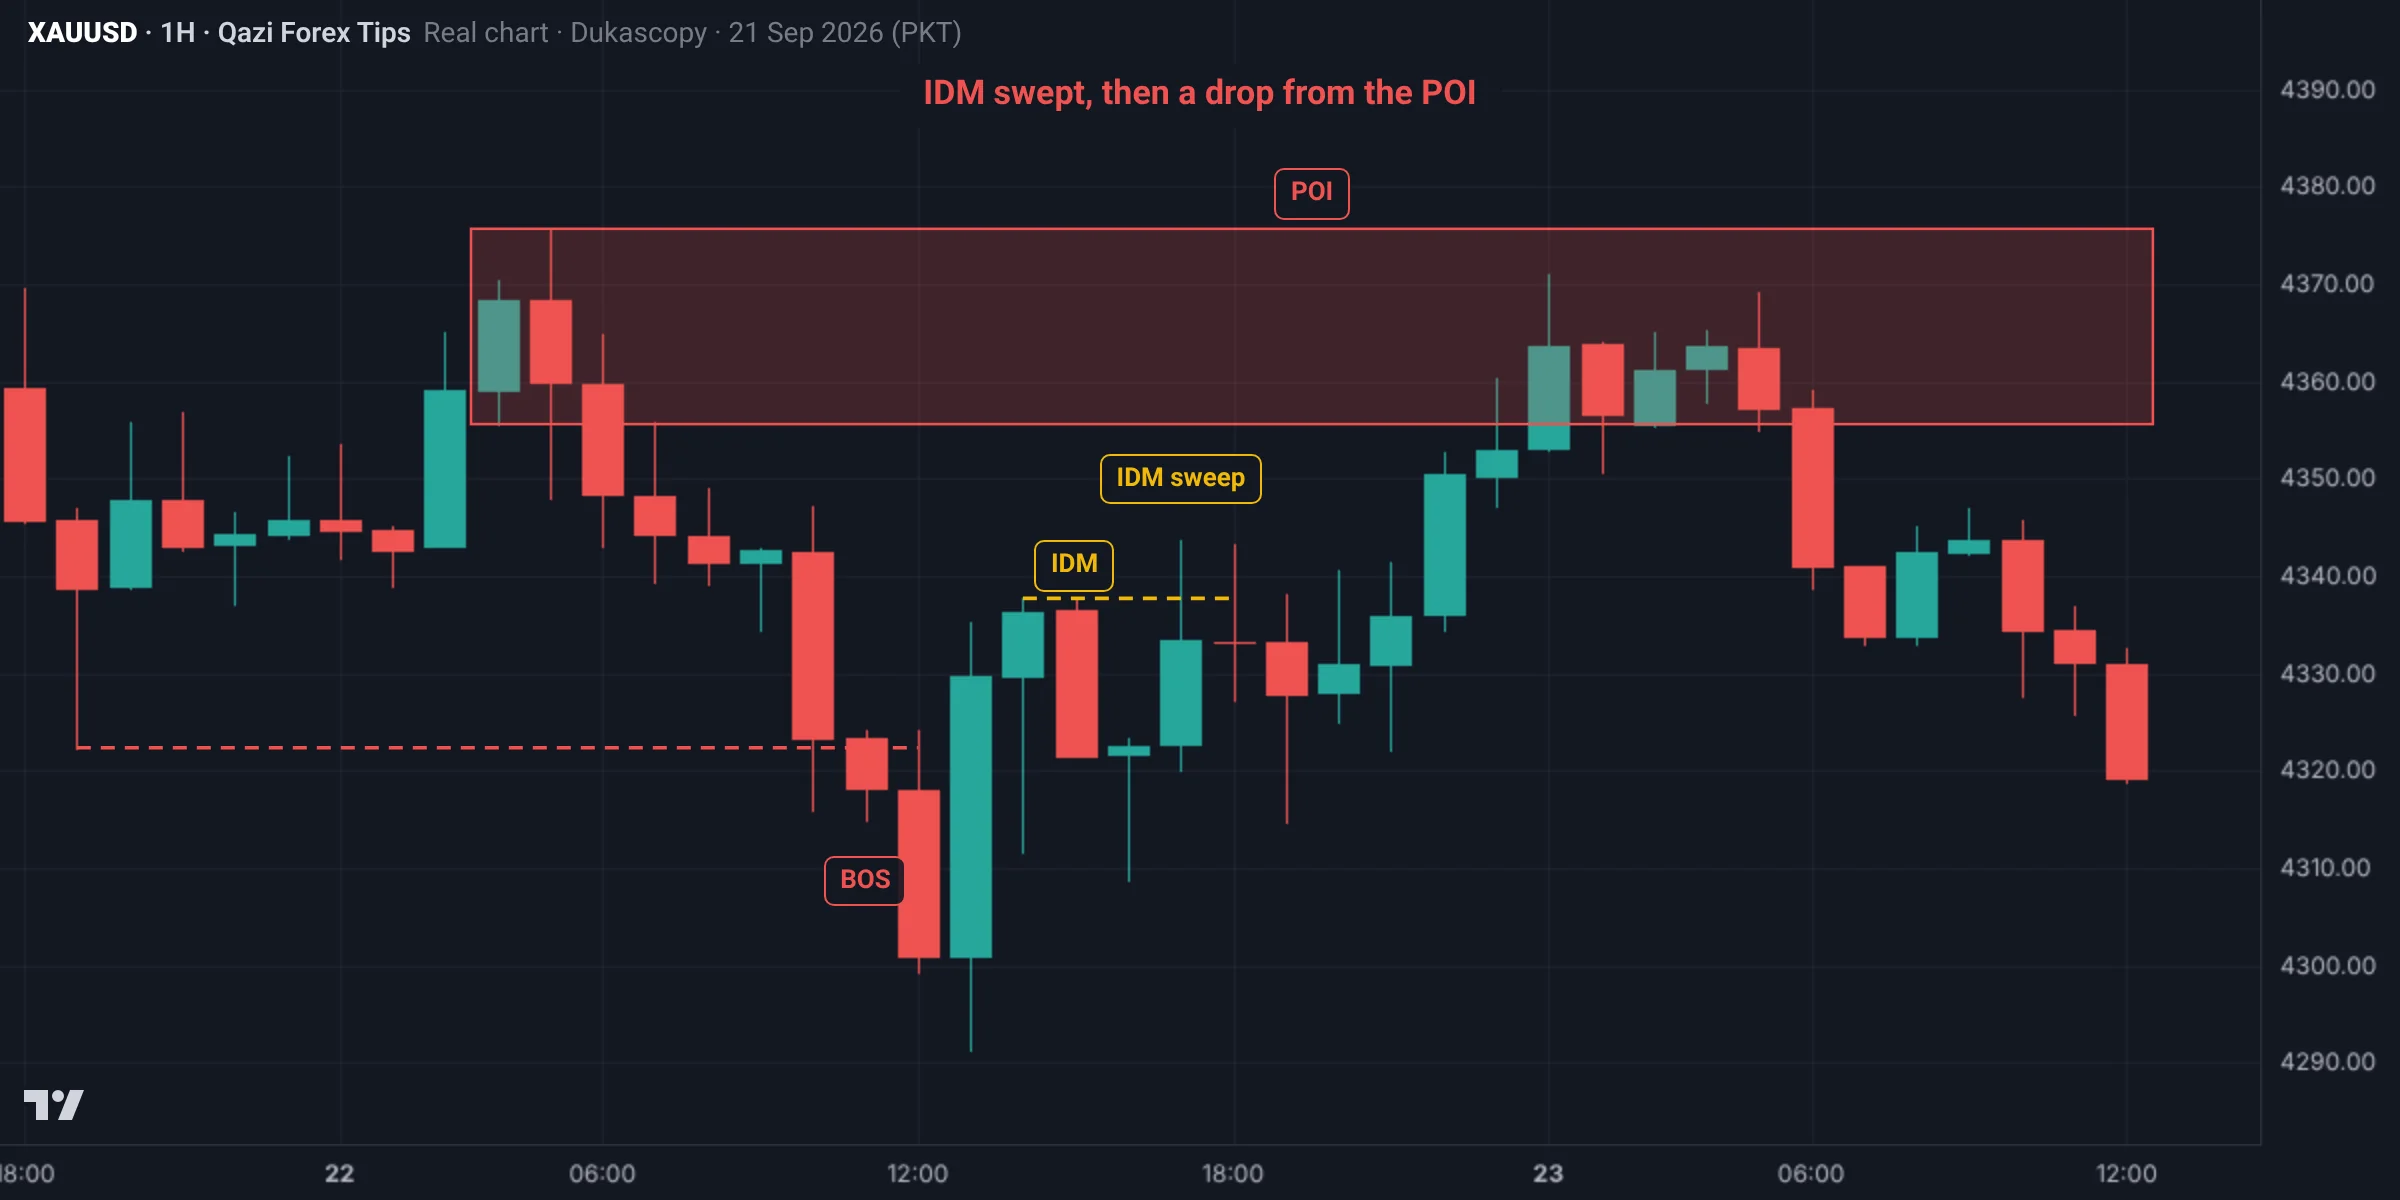
A (4,337.7, 14:00 on 22 Sep) is the first pullback high after the BOS. Early sellers' stops sat above it: price reached 4,343.6 at 17:00 (the IDM sweep), then climbed into the POI (4,371.0) and fell from there. C is the real POI, B is the reaction there, and D is a later pullback.
The marked chart
Test yourself: Lesson 1.6 quiz
8 questions. Pick one answer for each and you will see at once whether it is right and why. Your score and grade appear at the end. You need 70% to pass.
0 correct · 0 / 8
Question 1What is IDM (inducement)?
The stops placed under that small low become liquidity.
Question 2What does price often do with the IDM?
That is why a POI is stronger once the IDM has been swept.
Question 3Why does IDM work?
The stops of buyers being stopped out are sell orders.
Question 4The IDM has not been swept and price is at a small zone above it. What do you do?
An entry before the IDM is higher risk.
Question 5The IDM is swept and price reaches the POI. What now?
Entering the moment the IDM is swept, without confirmation, is also a mistake.
Question 6Which low is the IDM?
Calling every small low an IDM is a mistake.
Question 7Bearish example: BOS at 4,138, first pullback to 4,141 (IDM), POI 4,155 to 4,160. Where and when to sell?
Price first reached 4,143 (taking IDM stops), then 4,156 in the POI; stop 4,163, target 4,131.
Question 8If the IDM is not swept and price makes a new high?
In a strong trend price can leave without touching the IDM; note in your journal how often it happens.
Lesson checklist
Tick each point once you understand it. Your ticks are saved in this browser.
Assignment
- Find 15 BOS on the Gold H1 chart and mark the first pullback after each as IDM.
- Count how many times price swept the IDM before reaching the POI and how many times it did not.
- Where the IDM was swept, note what price did from the POI below it.
- Post your results (for example: IDM swept 10 times out of 15) in the group.
- Take 5 bearish BOS on Gold H1, mark the IDM and the real POI for each, and write whether the IDM was swept.
Post your assignment screenshots with your reasons in our free Facebook group, where your charts will be checked.
Join the free group
Who wrote this lesson
Dr. Qazi Abdul Basit, Ph.D
Ph.D in Business Administration and a forex and Gold trader since 2013. Founder of Qazi Forex Tips, which teaches traders in Pakistan and India price action, risk management and trading psychology in their own language: 65 student batches so far, free courses on YouTube, and MT5 tools for traders (QFT Replay Simulator, QFT Trade Assistant).
- 2013 trading since
- 75K+ Facebook group members
- 65 student batches
- 15K+ YouTube subscribers
How this lesson was made: the content follows Dr. Qazi's teaching method and years of trading. Real charts are built from Dukascopy Gold (XAUUSD) data, and backtest results are shown as they came out, even when negative. We do not sell signals, manage accounts or take money from any broker. Last updated: 19 November 2026.
Questions
What is inducement (IDM) in SMC?
The first internal pullback after a BOS, where early traders enter; their stops often get swept before price reaches the real POI.
Why is the first pullback a trap?
Stops placed under it become liquidity that larger players use to fill orders before the main move.
Does price always sweep IDM?
No. Strong trends can leave it untouched, so treat entries before the IDM sweep as higher risk.
Where should I enter after the IDM?
At the real POI after the IDM sweep, with a lower-timeframe CHoCH as confirmation.
Is every small low an inducement?
No. Only the first internal pullback after a BOS is the IDM.
What if price never sweeps the IDM?
Let the trade go. Chasing price after a missed setup usually means a poor entry and a wide stop.
What does IDM mean in trading?
IDM stands for inducement: a small high or low before the real POI that traps early traders. It usually gets swept first, then price reaches the real zone.
What is the difference between IDM and a liquidity sweep?
IDM is a particular kind of liquidity sitting right before a POI. Its sweep often tells you the real POI is now close.
Read more
Education only, not financial advice. Trading forex, Gold and CFDs carries a high risk of loss. SMC concepts describe tendencies, not guarantees. Lesson 10 of 38.