 Qazi Forex Tips

What is a BOS?
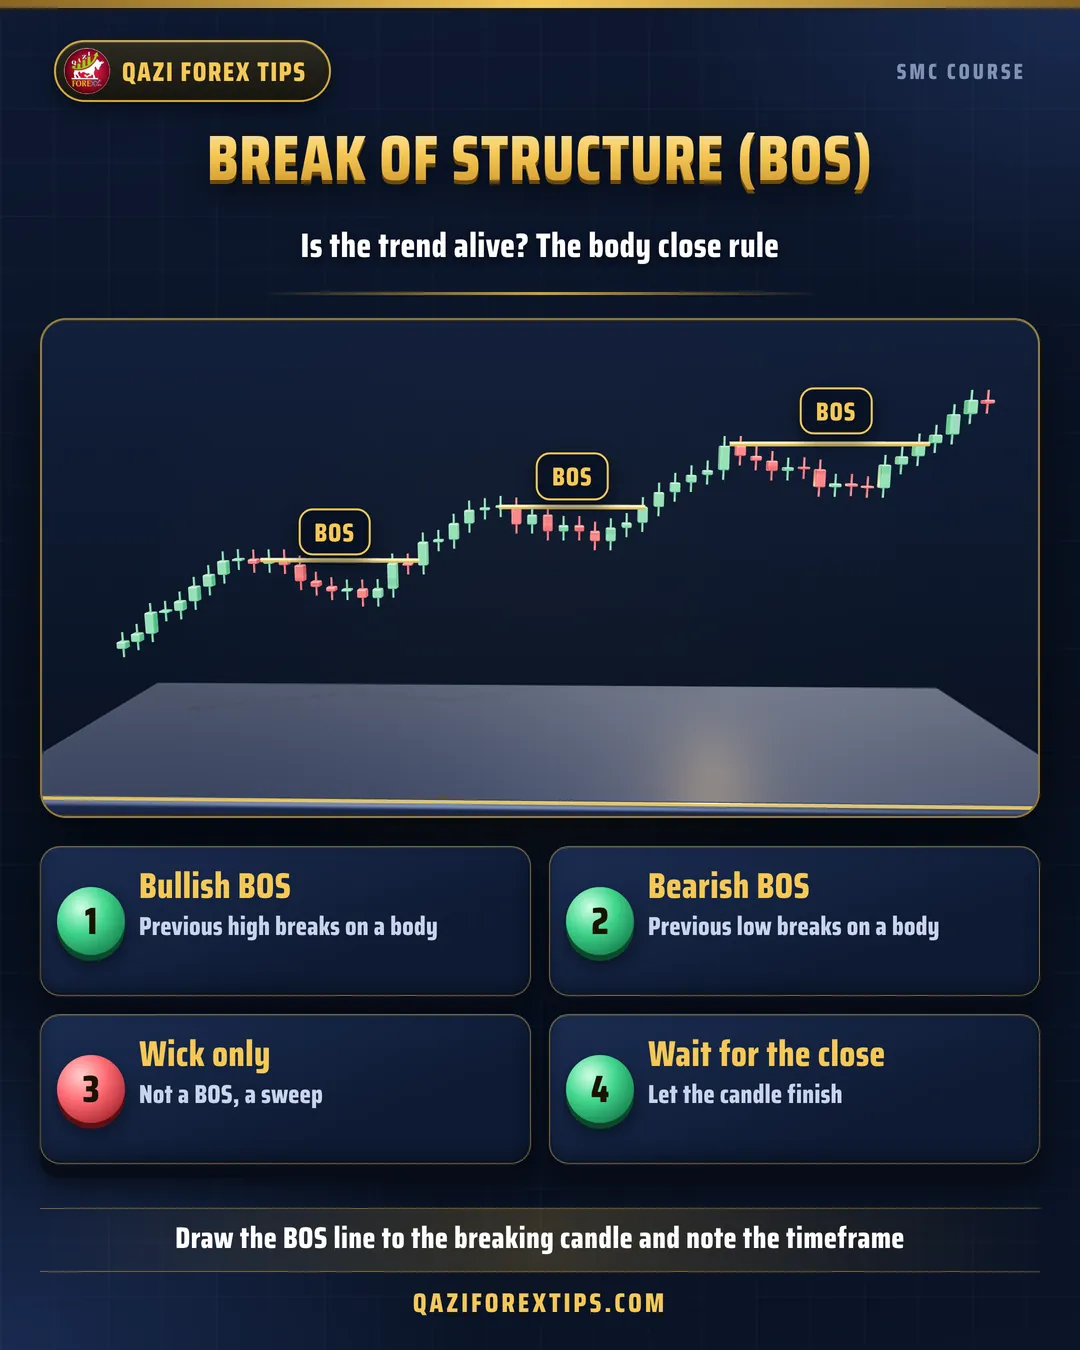
A BOS (Break of Structure) means structure breaks in the direction of the current trend:
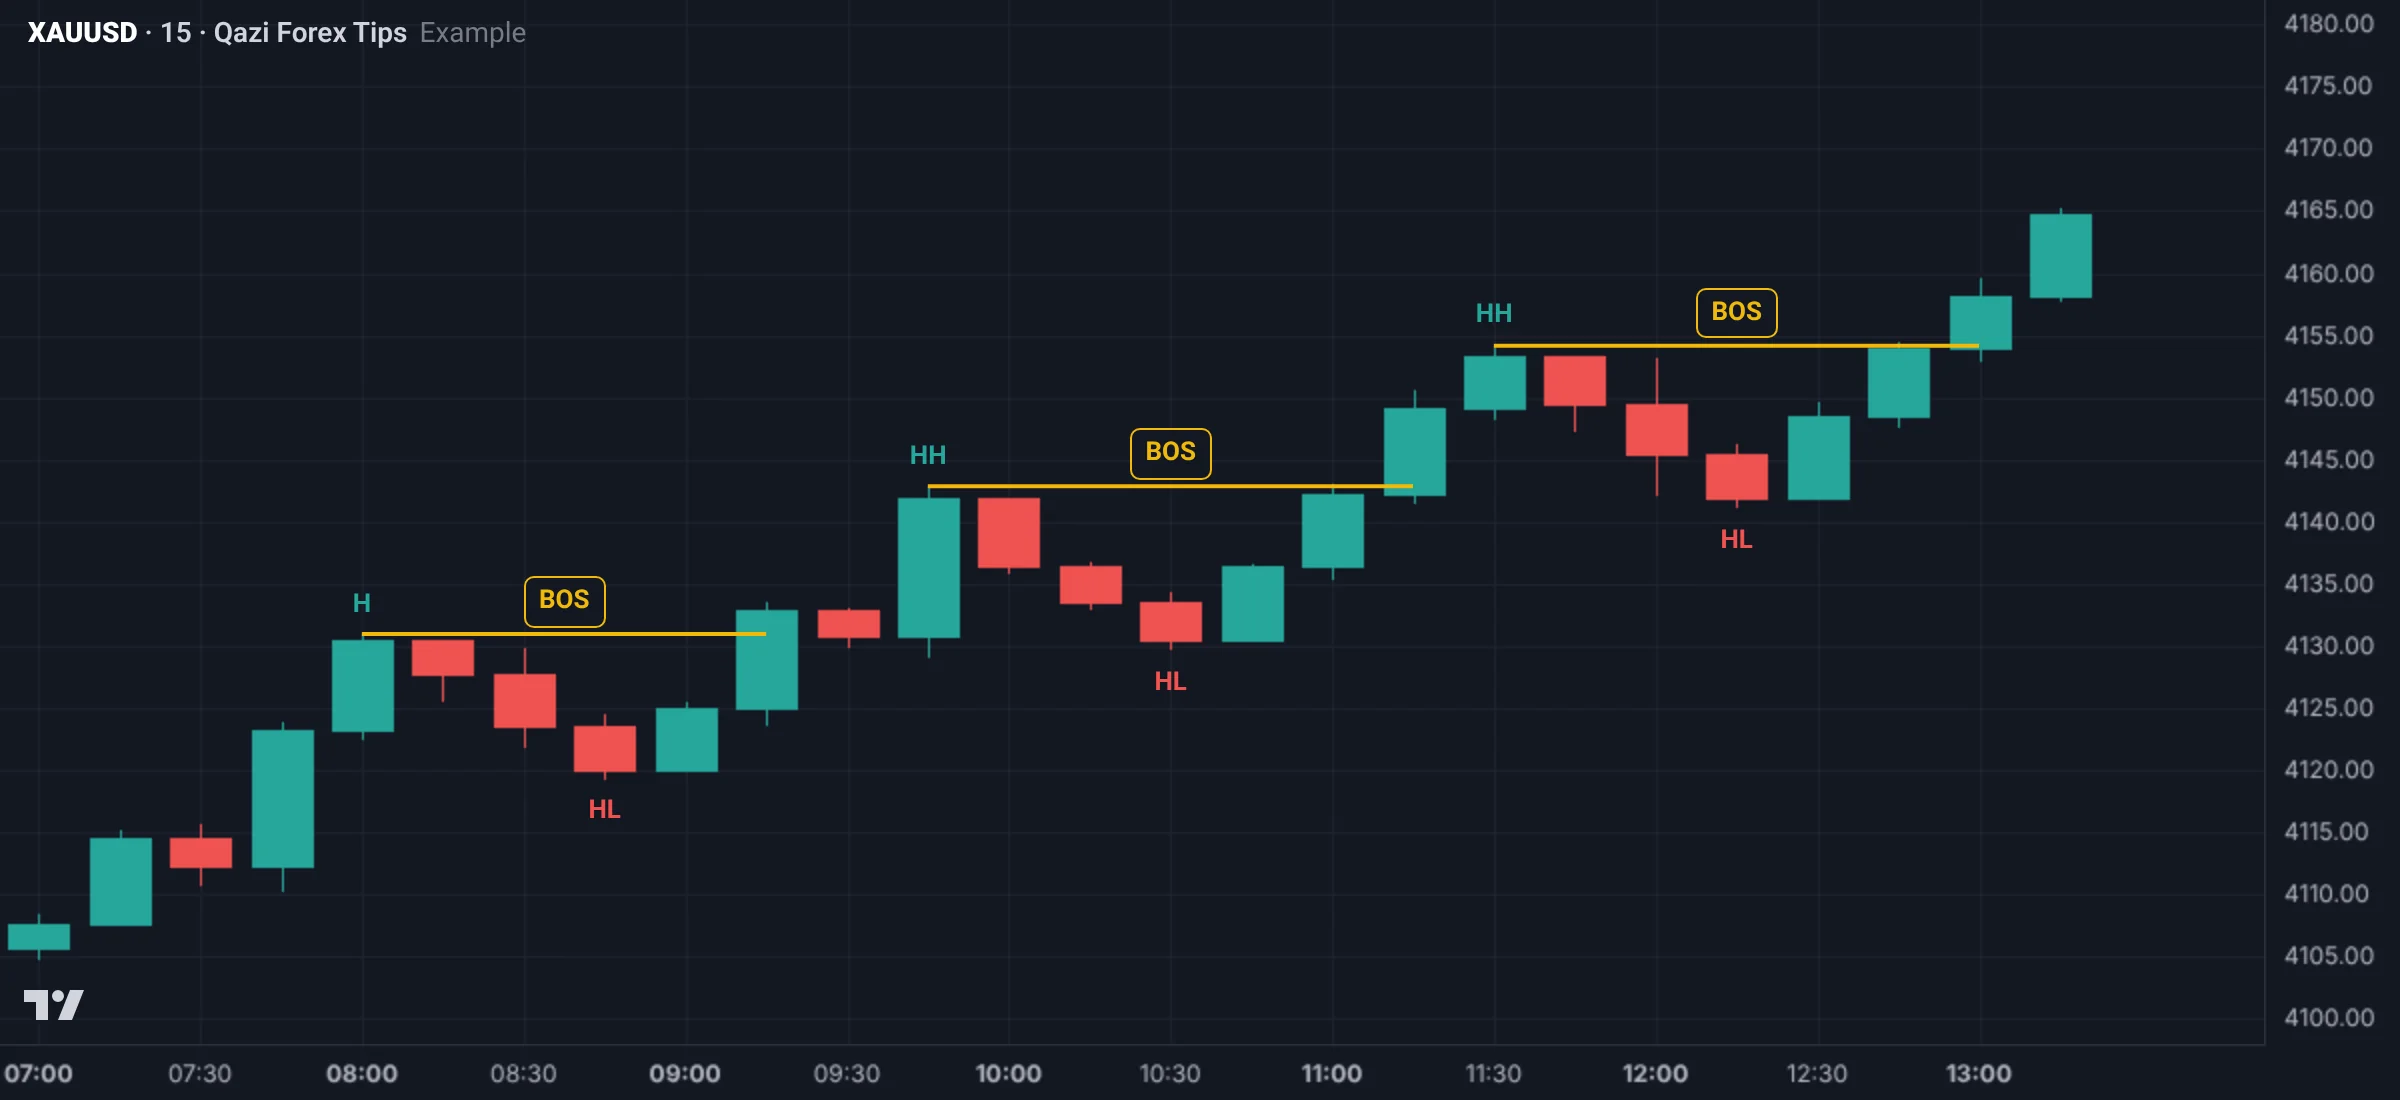
- Bullish BOS: in an uptrend the previous HH breaks. Buyers are still in control.
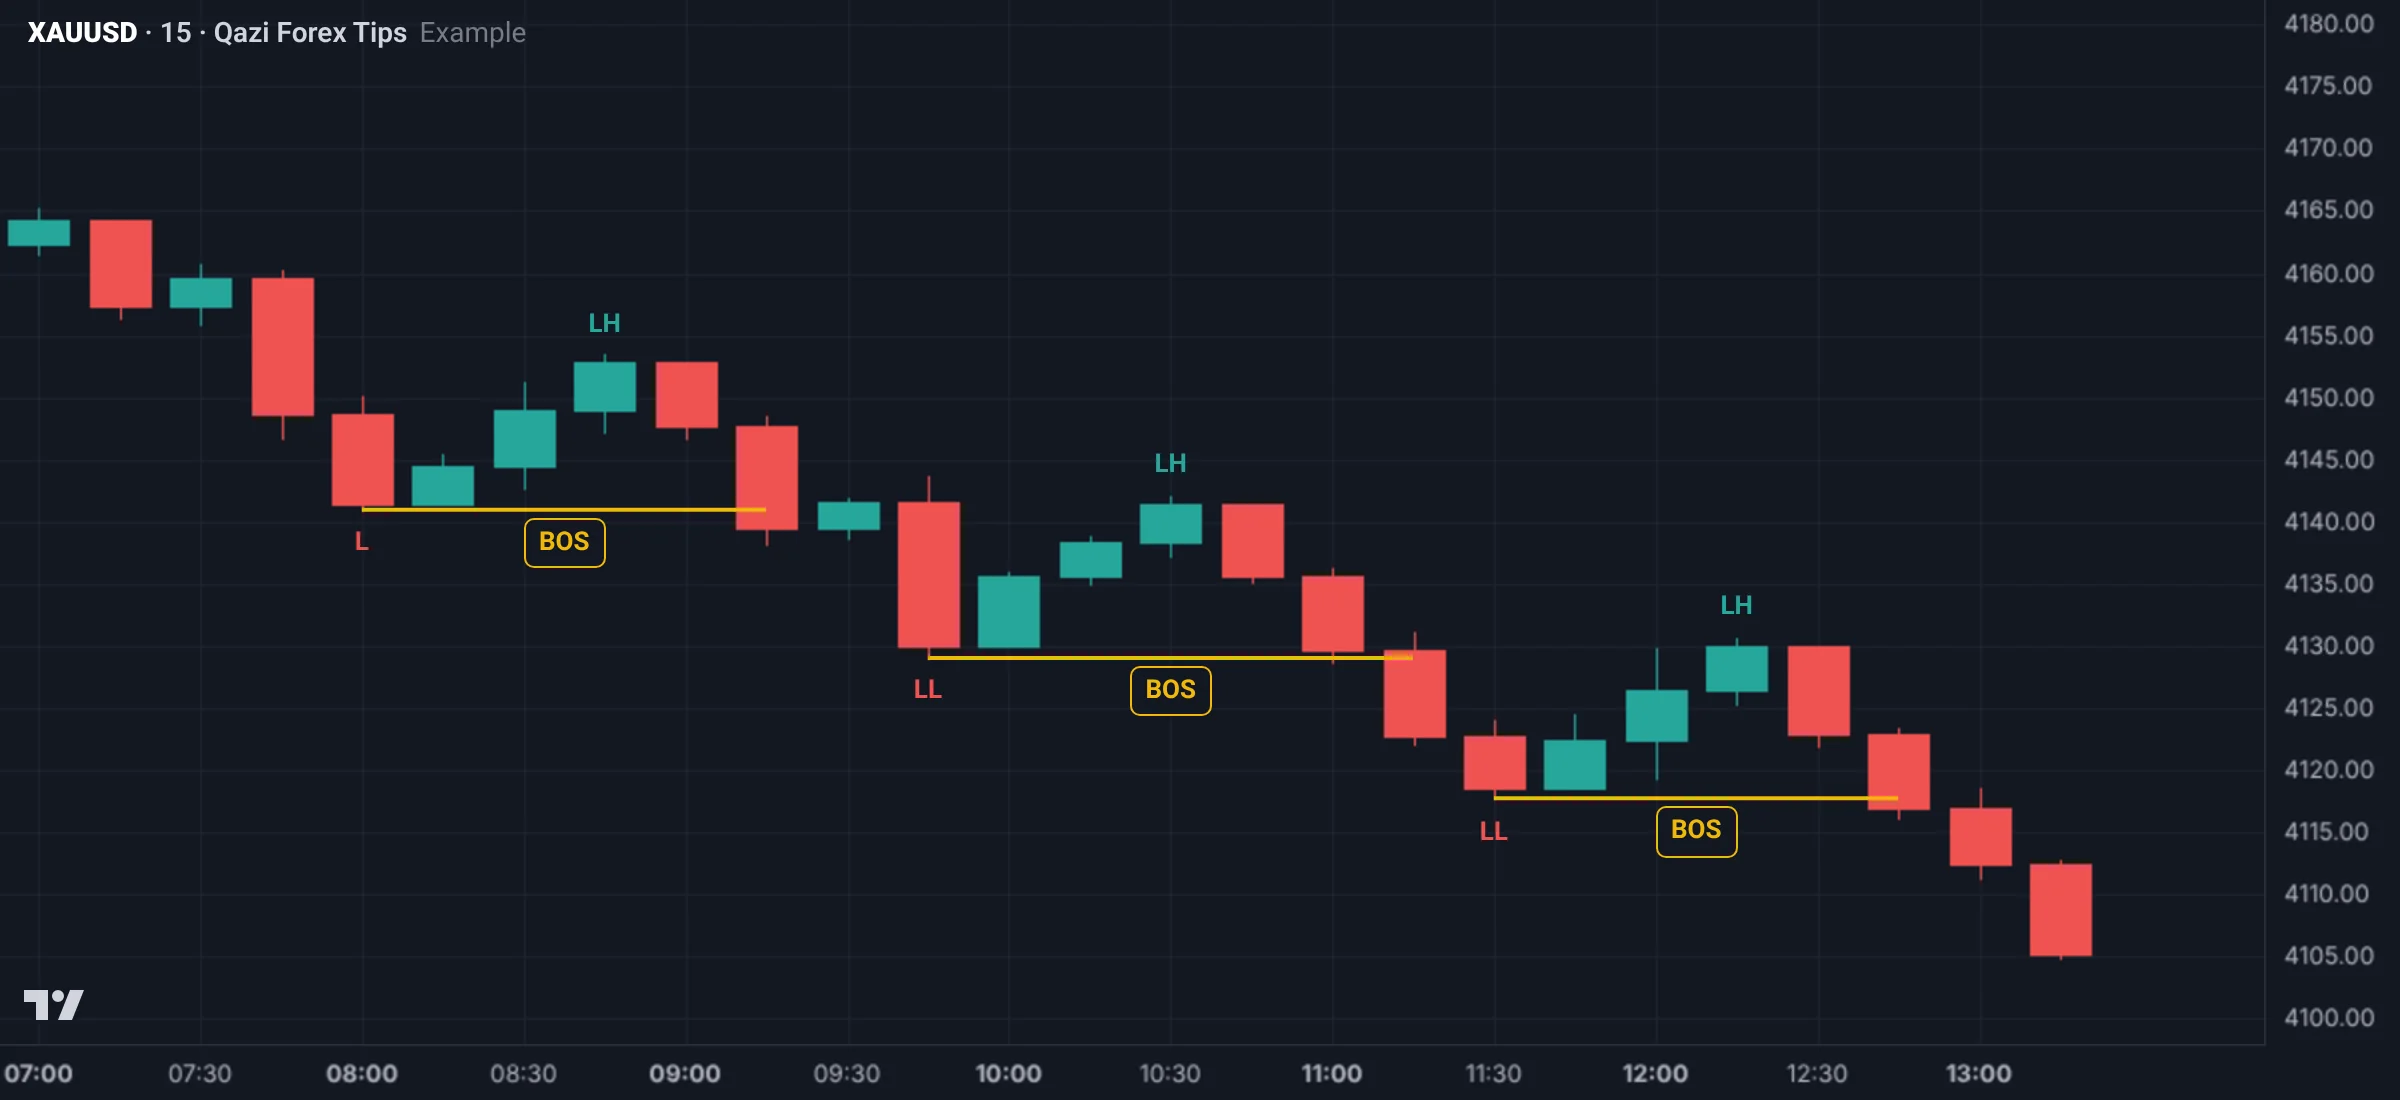
- Bearish BOS: in a downtrend the previous LL breaks. Sellers are still in control.
The key condition: a body close
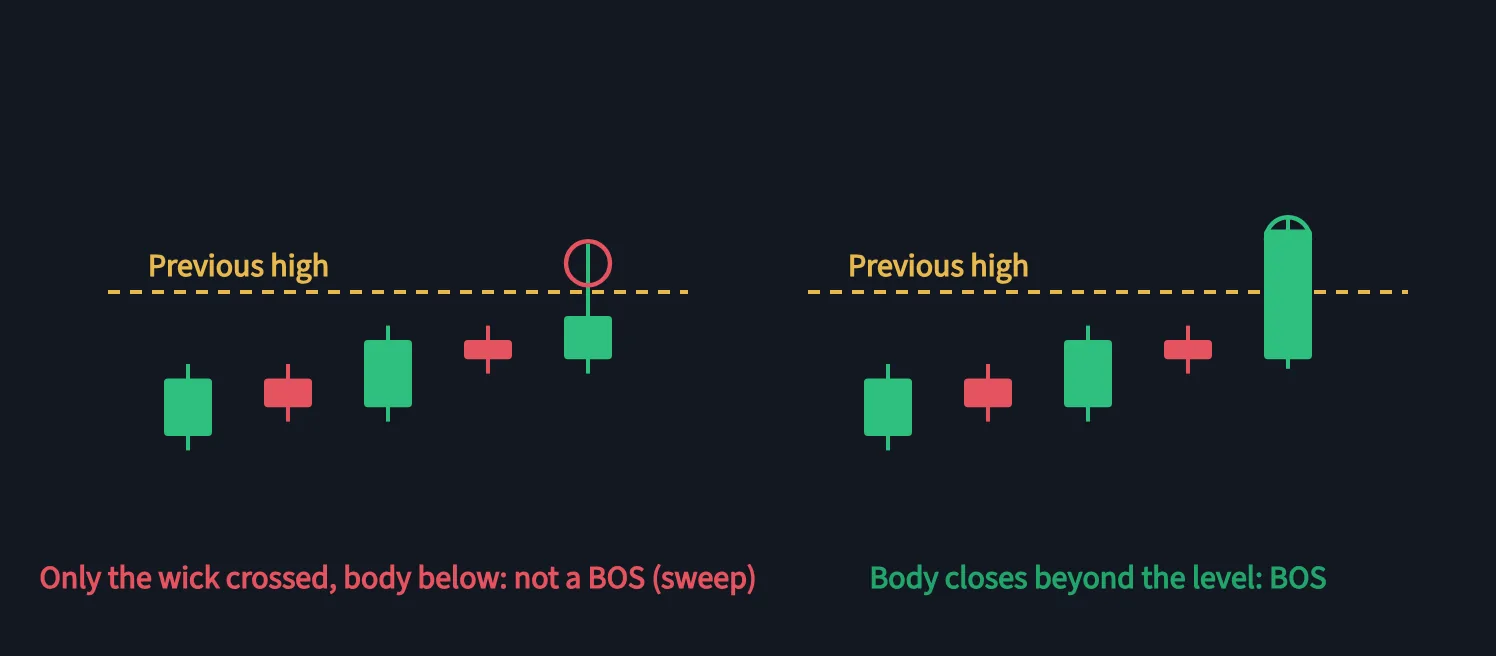
Count a BOS only when a candle body closes beyond the level. If only the wick went beyond and the body closed back inside, it is not a BOS. It is often a liquidity sweep, after which price may reverse.
Bearish BOS
How to mark a BOS
- Draw a straight line from the swing (high or low) that broke.
- End the line at the candle whose body closed beyond the level.
- Write "BOS" on the line.
- Add the timeframe, for example "H1 BOS".
Why the BOS matters
- Bias confirmation: each new BOS says the trend continues, so look for setups in that direction.
- Finding POIs: order blocks and FVGs form at the origin of the move that made the BOS. Phase 3 uses those zones.
- Protected low or high: after a BOS, the low where the BOS move began now protects the trend (lesson 1.5).
What happens after a BOS?
Price often pulls back after a BOS. The pullback is a trade opportunity, but not immediately: traders who jump on the first pullback are often trapped (IDM), which lesson 1.6 explains.
Wick versus body: in one chart
See BOS's most important rule in one picture:
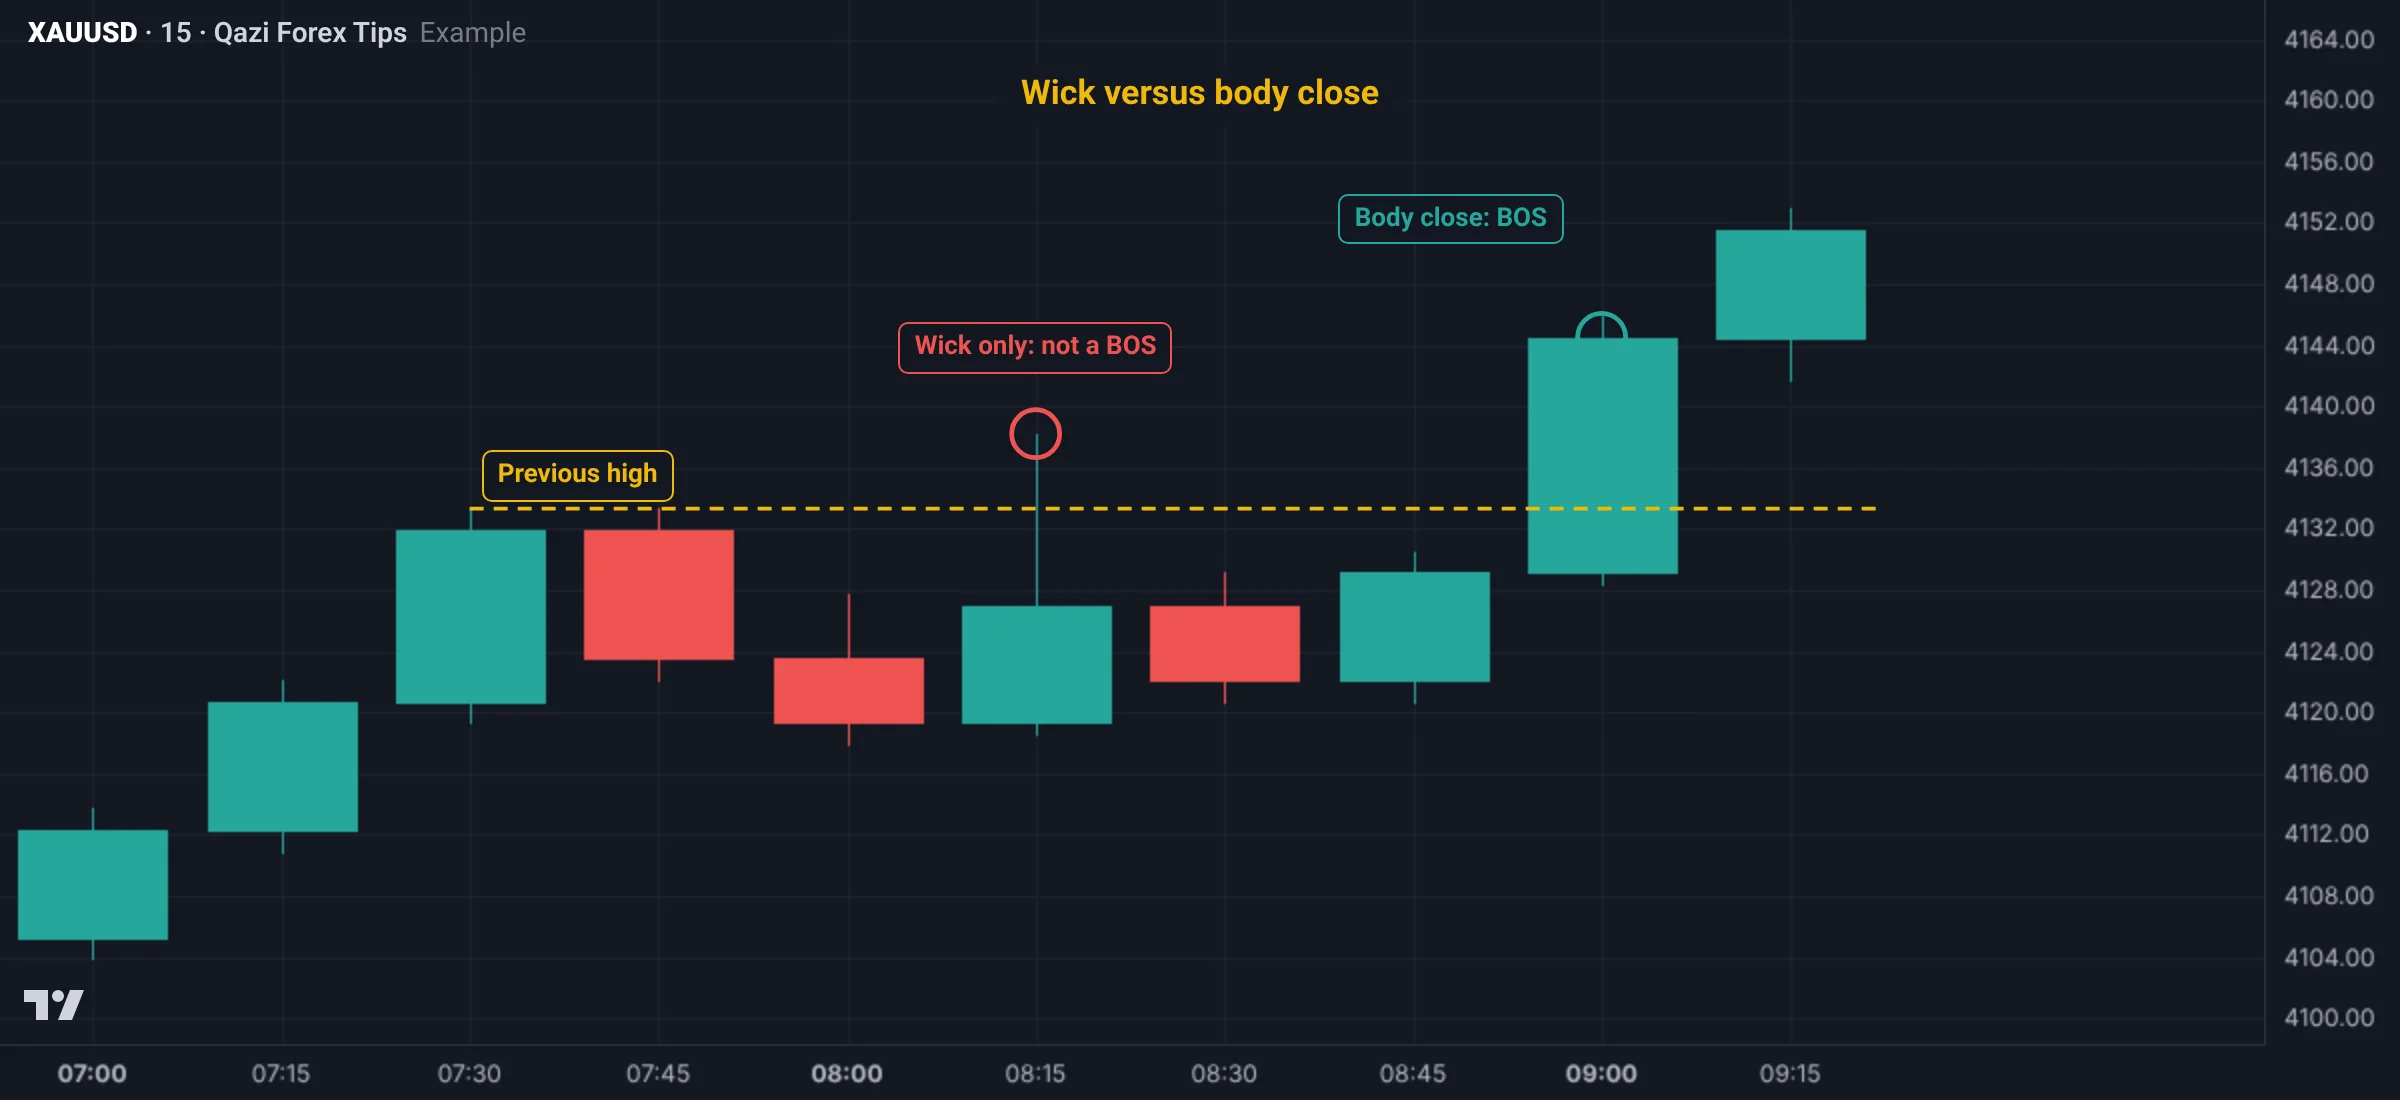
- Wick only: price went above the high but was not accepted there. This is often a liquidity sweep (Phase 2).
- Body close: price closed above the high, so the higher price was accepted. This is a BOS.
Marking a BOS: step by step
- First decide the structure: uptrend or downtrend.
- In an uptrend, watch the last major swing high (HH).
- When a candle closes its body above that high, draw a horizontal line from the high to that candle and write "BOS".
- Write the timeframe next to it (for example "BOS H1"), because an M15 BOS and an H4 BOS are not the same.
- Now find the new HL: the low where the BOS move started is the next important low.
- In a downtrend do the reverse: a body close below the last LL = a bearish BOS.
Strong and weak BOS
Not every BOS is equal:
| Strong BOS | Weak BOS |
|---|---|
| From a big momentum candle, with an FVG | From small candles, slowly |
| Closes well beyond the high | Closes just beyond the high |
| In the direction of the higher timeframe bias | Against the higher timeframe bias |
| In a killzone | In the quiet Asian hours |
After a strong BOS, its origin (order block or FVG) makes a good POI. Trust a weak BOS less.
A Gold example
Gold is in an H1 uptrend; the last HH is at 4,152.40.
- In London a candle reaches 4,156.10 but closes at 4,150.80: not a BOS, only a wick.
- In New York a big candle goes from 4,149 and closes at 4,161.30: a BOS (H1).
- The new important low is where this move began, say 4,144.50. The uptrend holds as long as price doesn't close below it.
Real Gold chart examples
Gold H1 on 4 and 5 Nov 2026 (data: Dukascopy, bid price; Pakistan time):
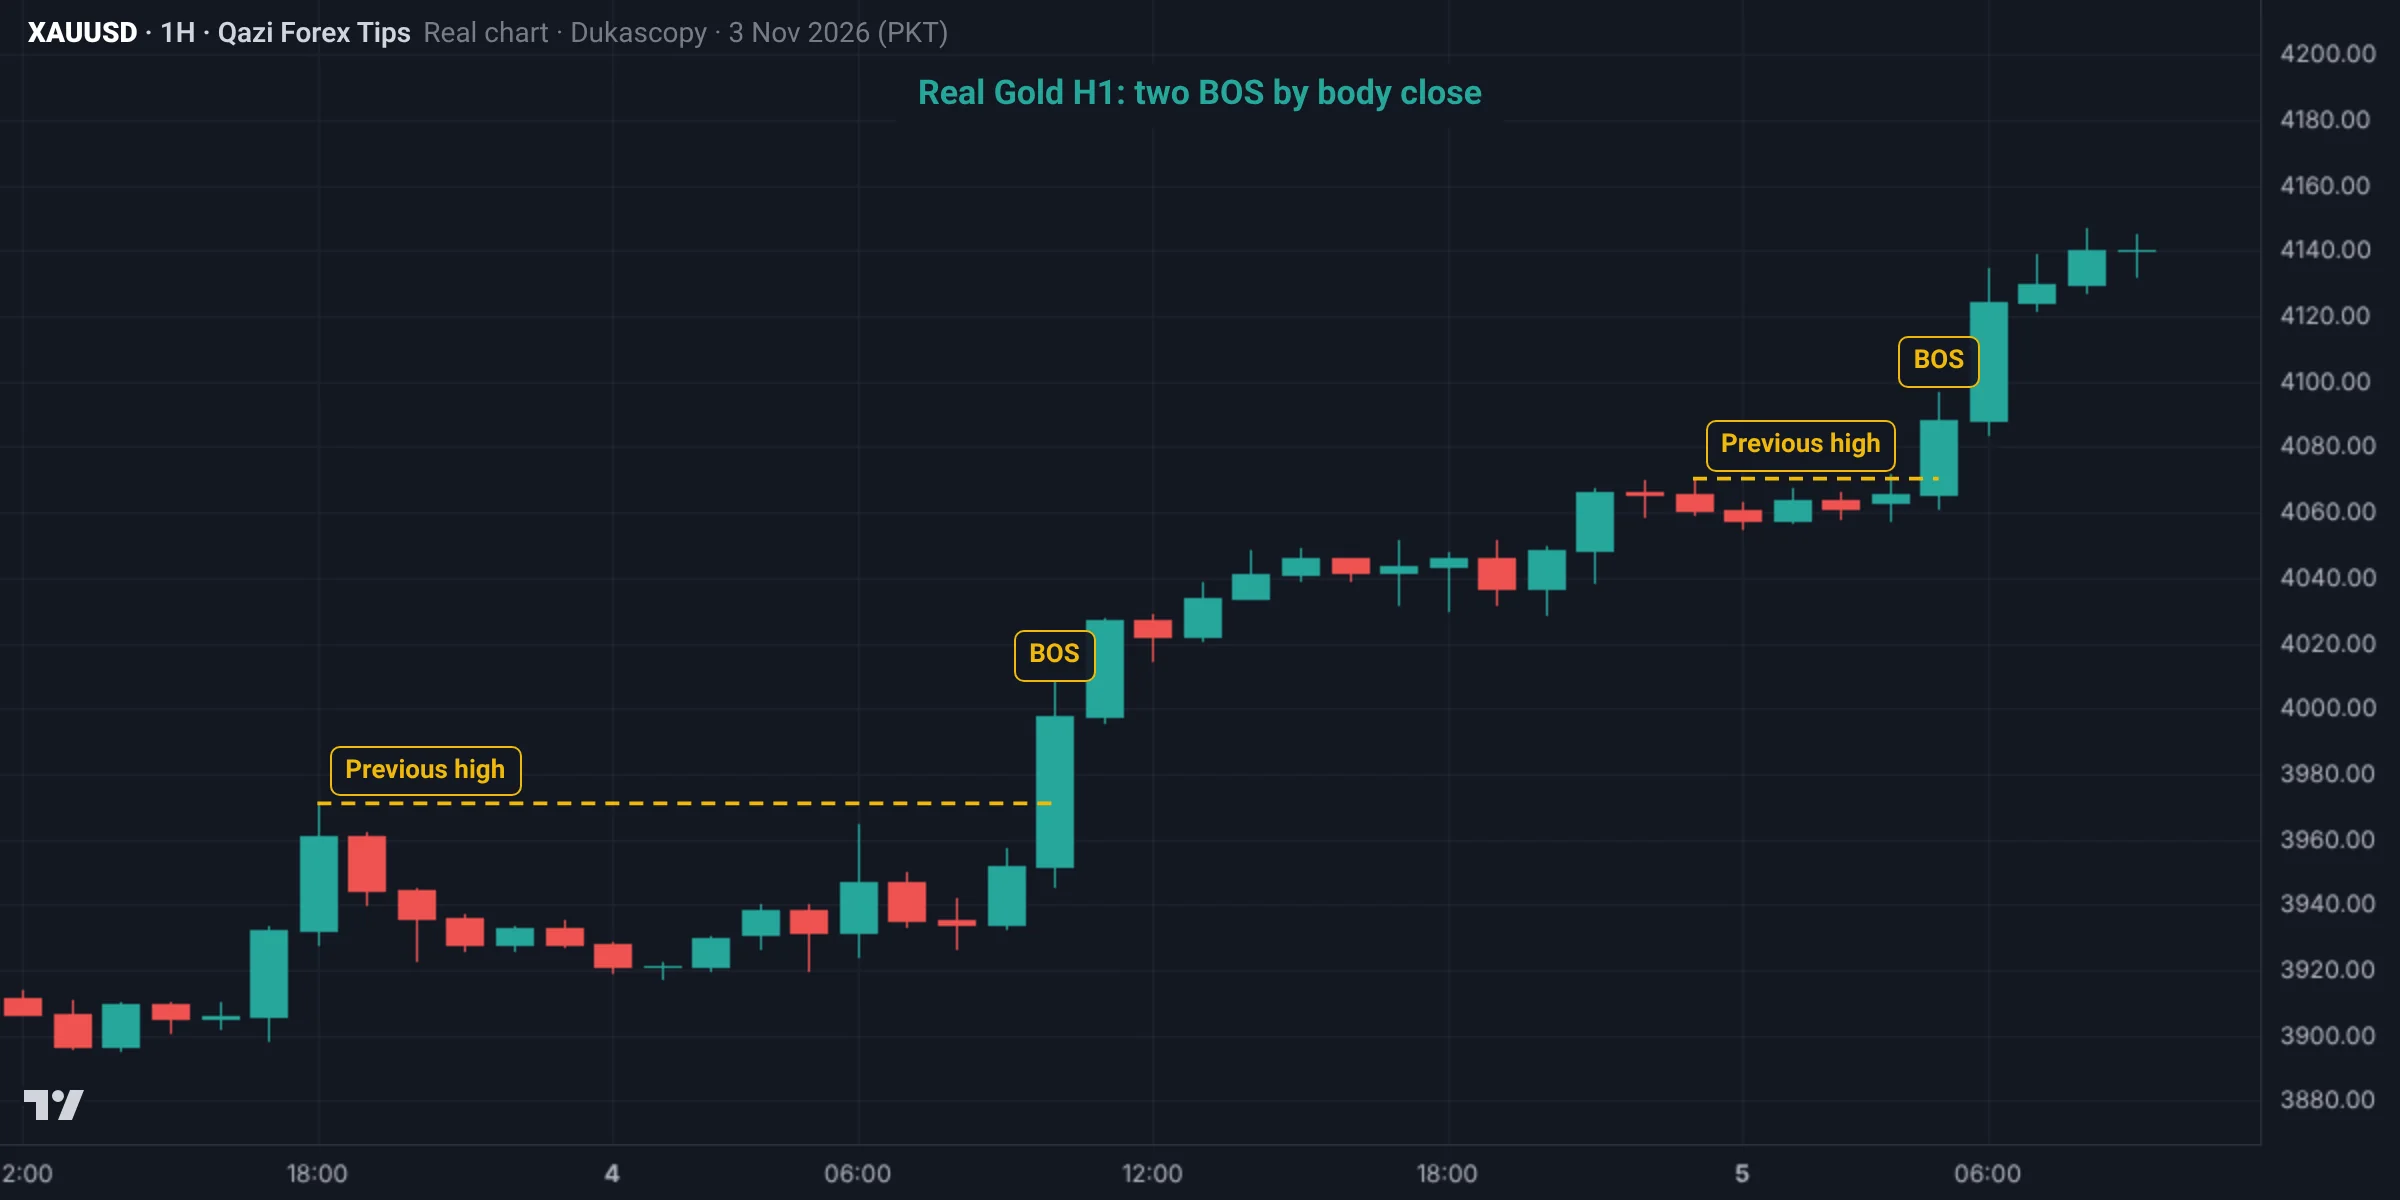
- The high at 18:00 on 3 Nov was 3,970.9. The 10:00 H1 candle on 4 Nov closed its body at 3,997.5, above it: the first BOS.
- Then a high formed at 4,070.3 at 23:00 on 4 Nov. The 05:00 candle on 5 Nov closed at 4,088.3: the second BOS, and price reached 4,146.8 that morning.
In both cases the decision came from the close, not a wick.
Second example: bearish BOS (22 Oct)
Gold H1 on 22 Oct 2026 (data: Dukascopy, bid price; Pakistan time), this time to the downside:
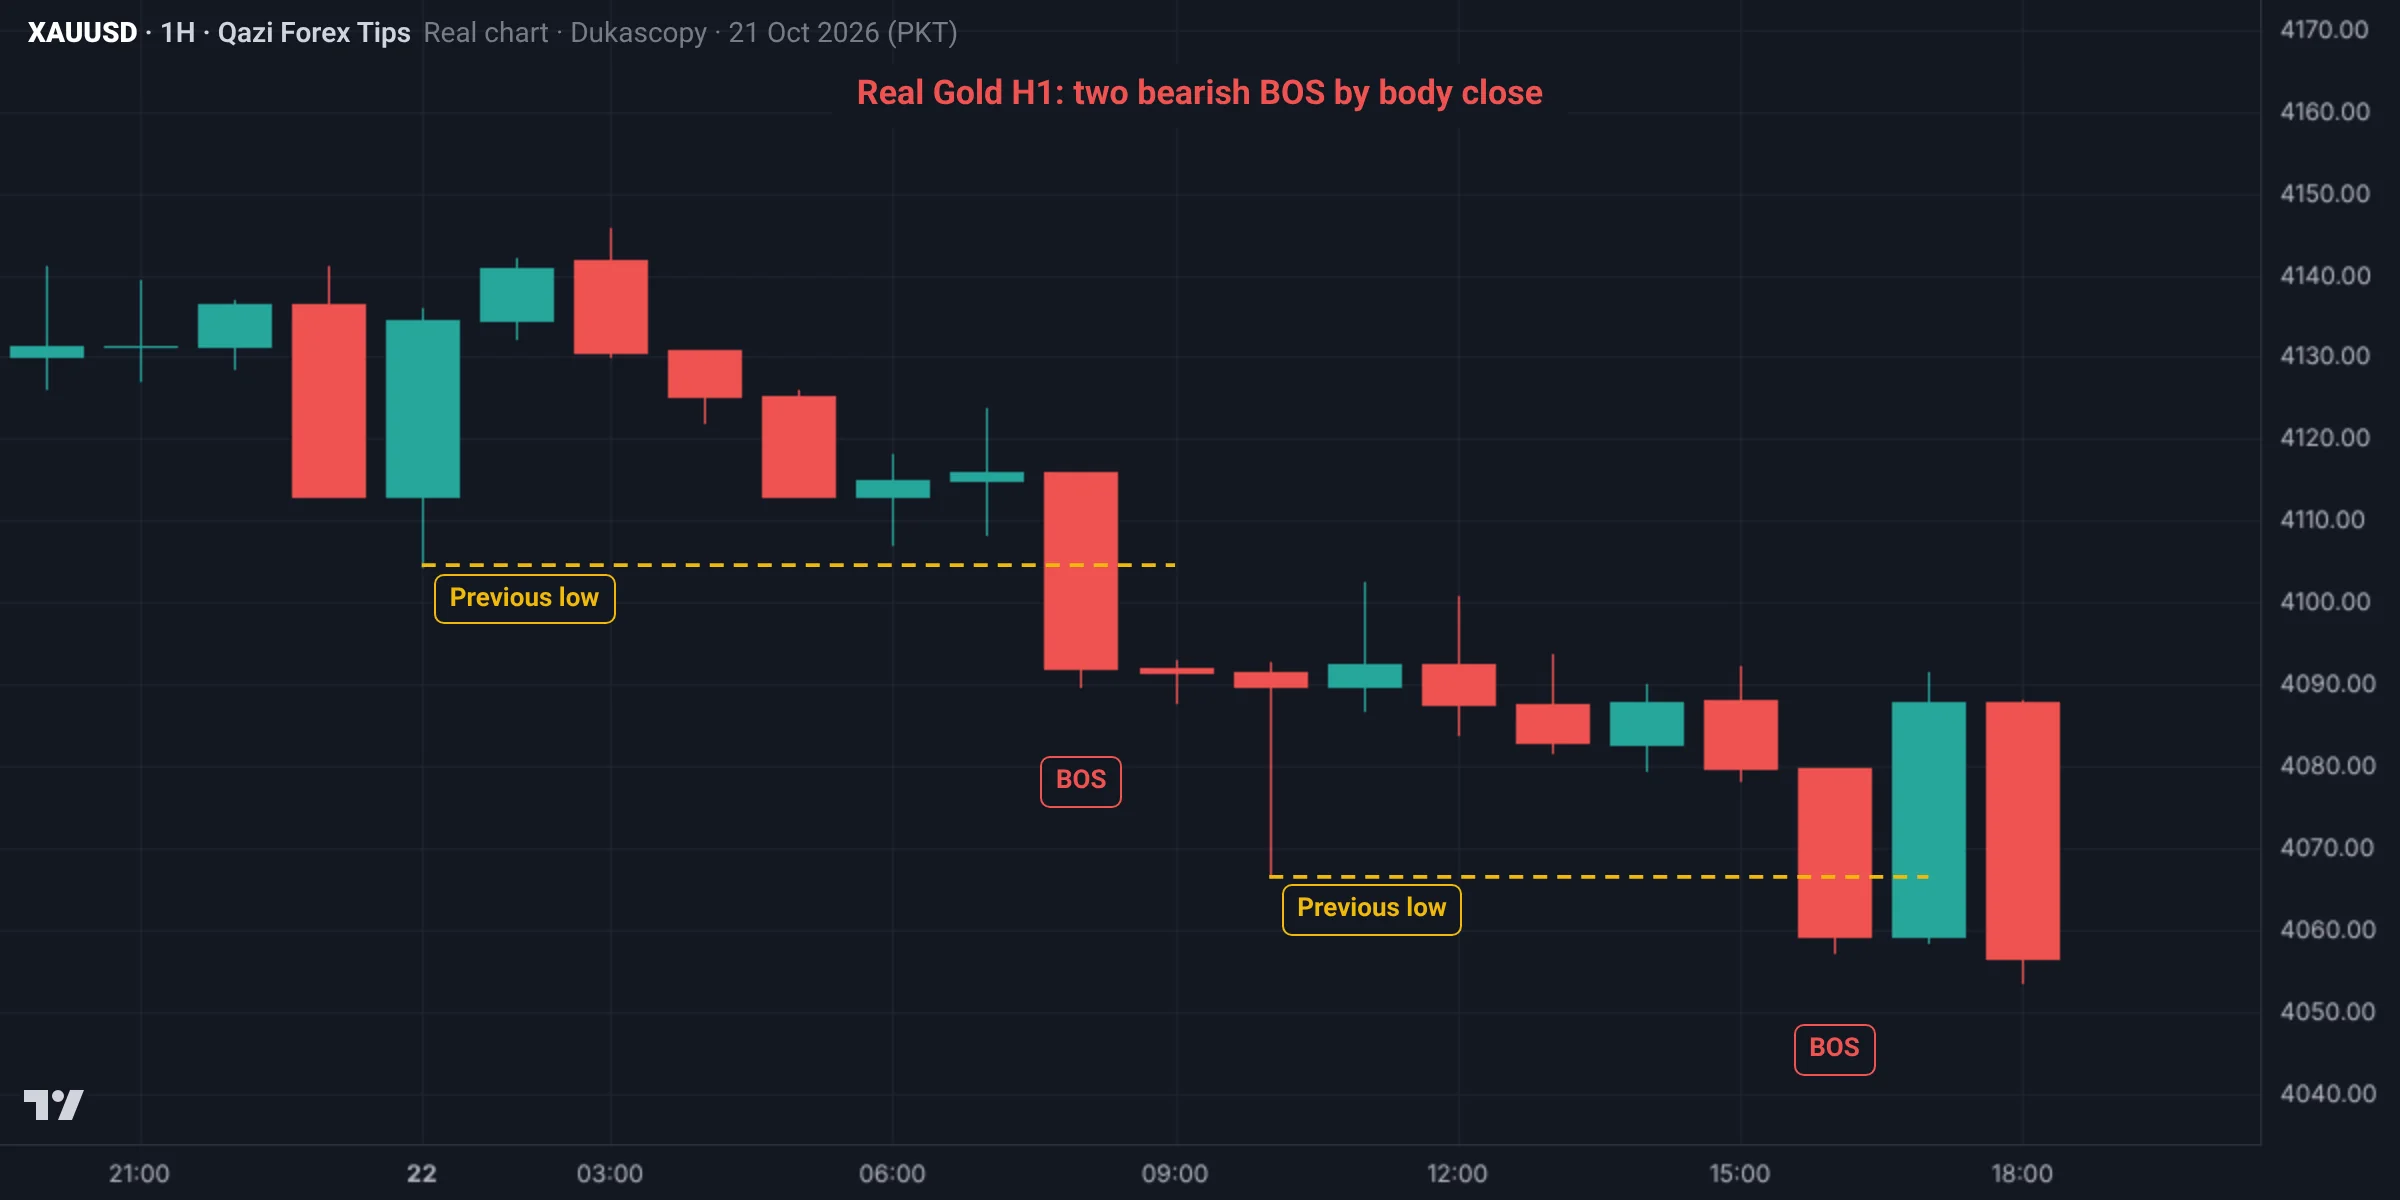
- The low at 00:00 was 4,104.6. The 08:00 candle closed its body at 4,092.0, below it: the first bearish BOS.
- Then a low formed at 4,066.6 at 10:00. The first close below it was the 16:00 candle, at 4,059.4: the second BOS. The candles from 11:00 to 15:00 kept closing above that level, so they were not a BOS.
Both times the decision came from the close. A bearish BOS means the downtrend continues: look for sells, not buys.
Common mistakes
Summary
- BOS = the previous swing broken by a body close in the trend direction.
- Draw the line from the swing to the breaking candle, with the timeframe.
- A strong BOS comes with momentum, an FVG and the bias.
- After a BOS, the entry comes on the pullback from its origin.
Spot it on the chart: practice
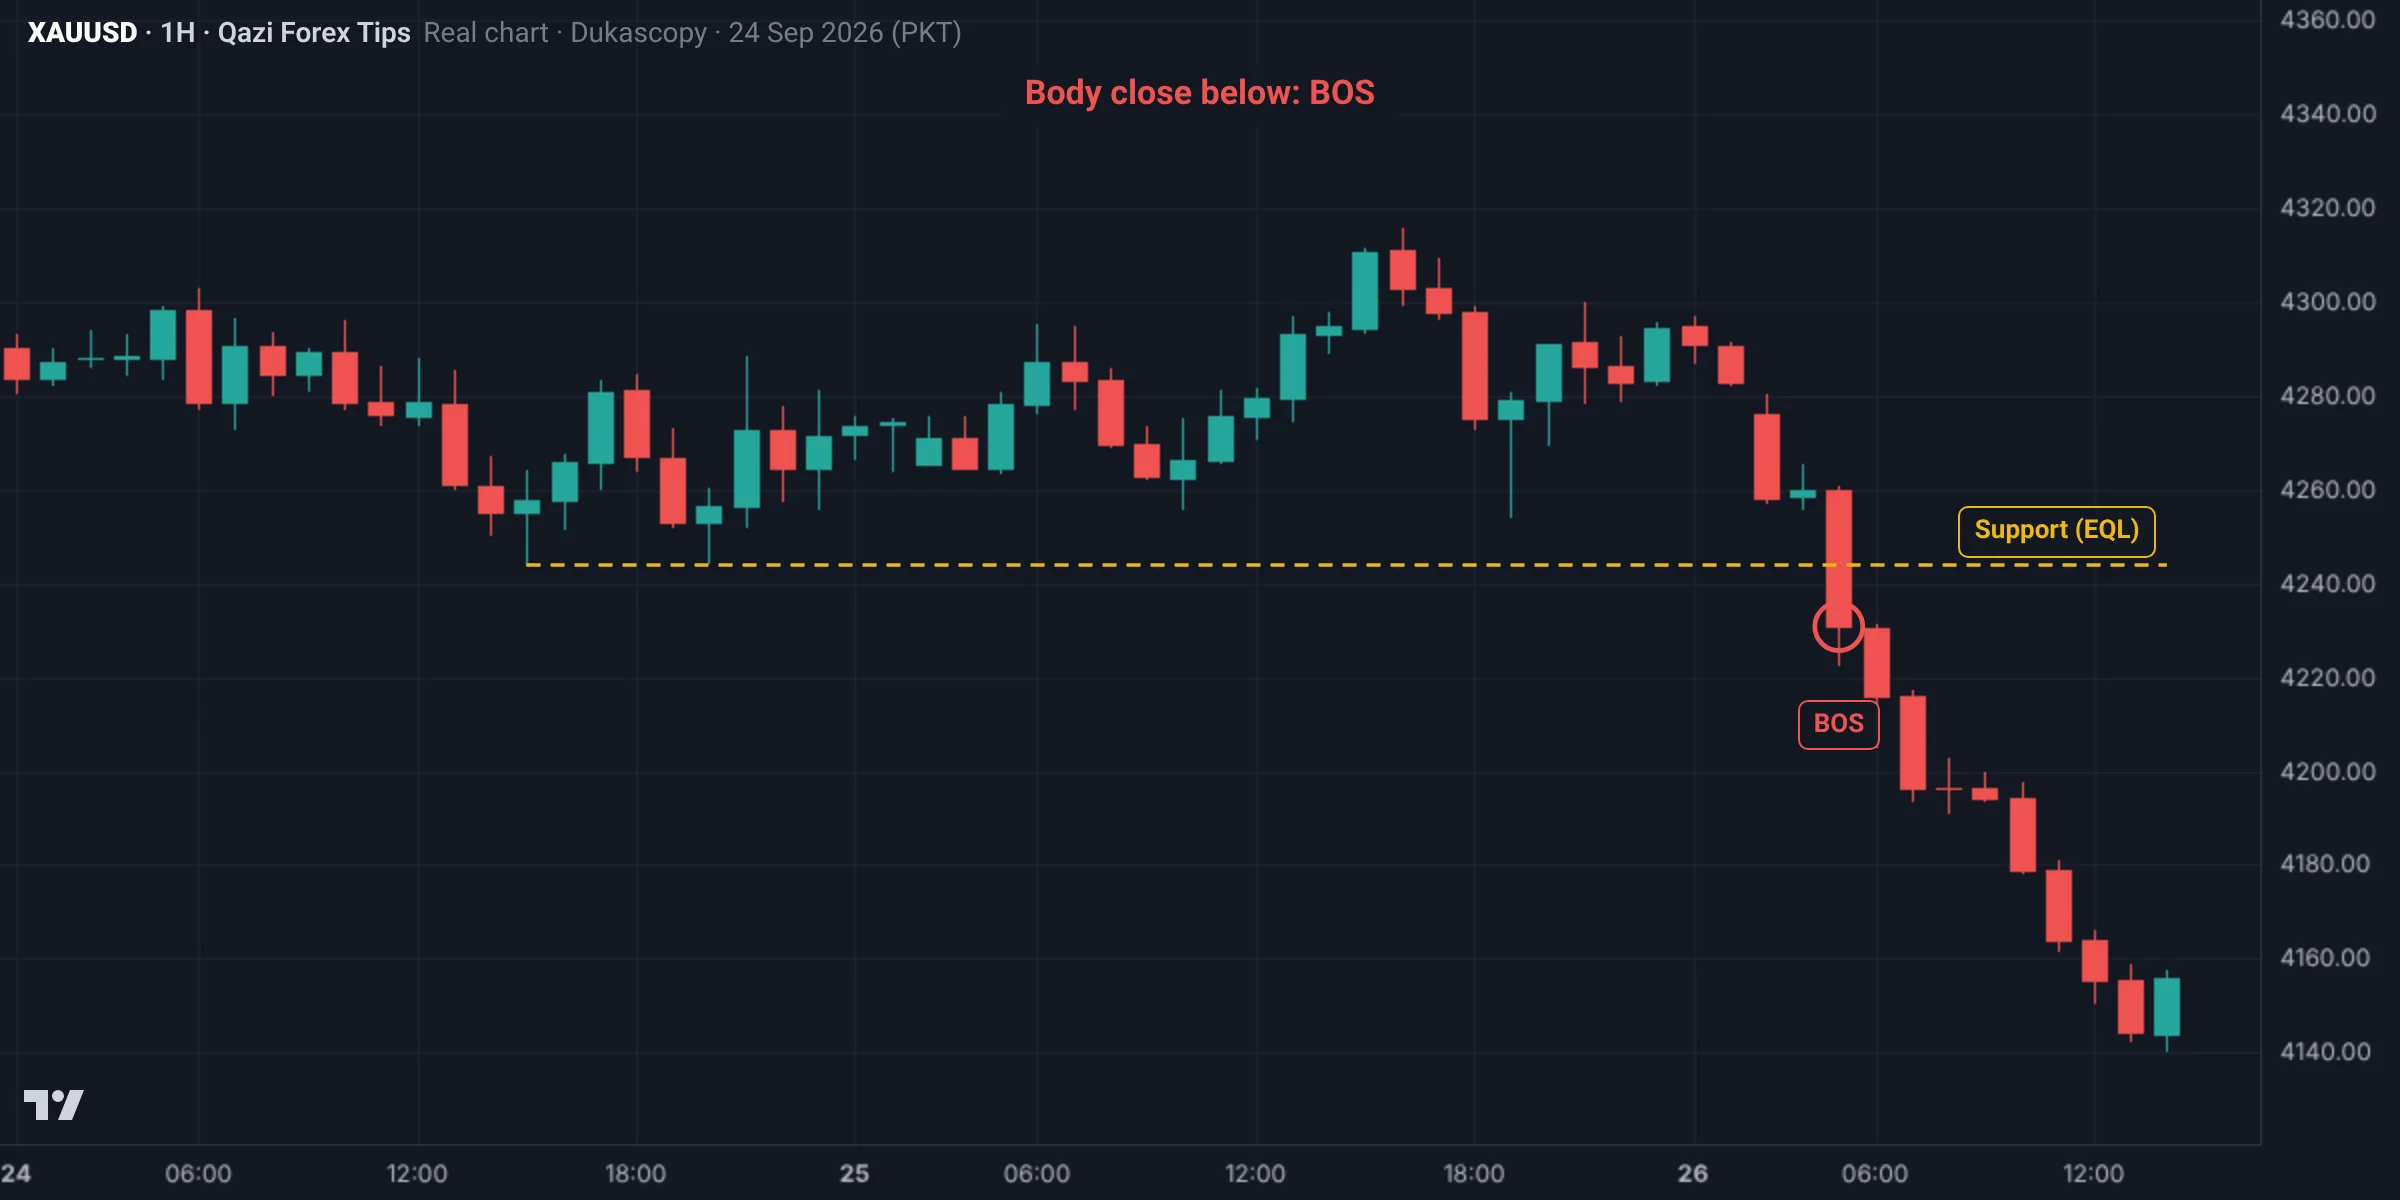
This is a real Gold chart (Dukascopy data, Pakistan time). Study it and pick an answer. After you answer, the fully marked chart and the explanation appear.
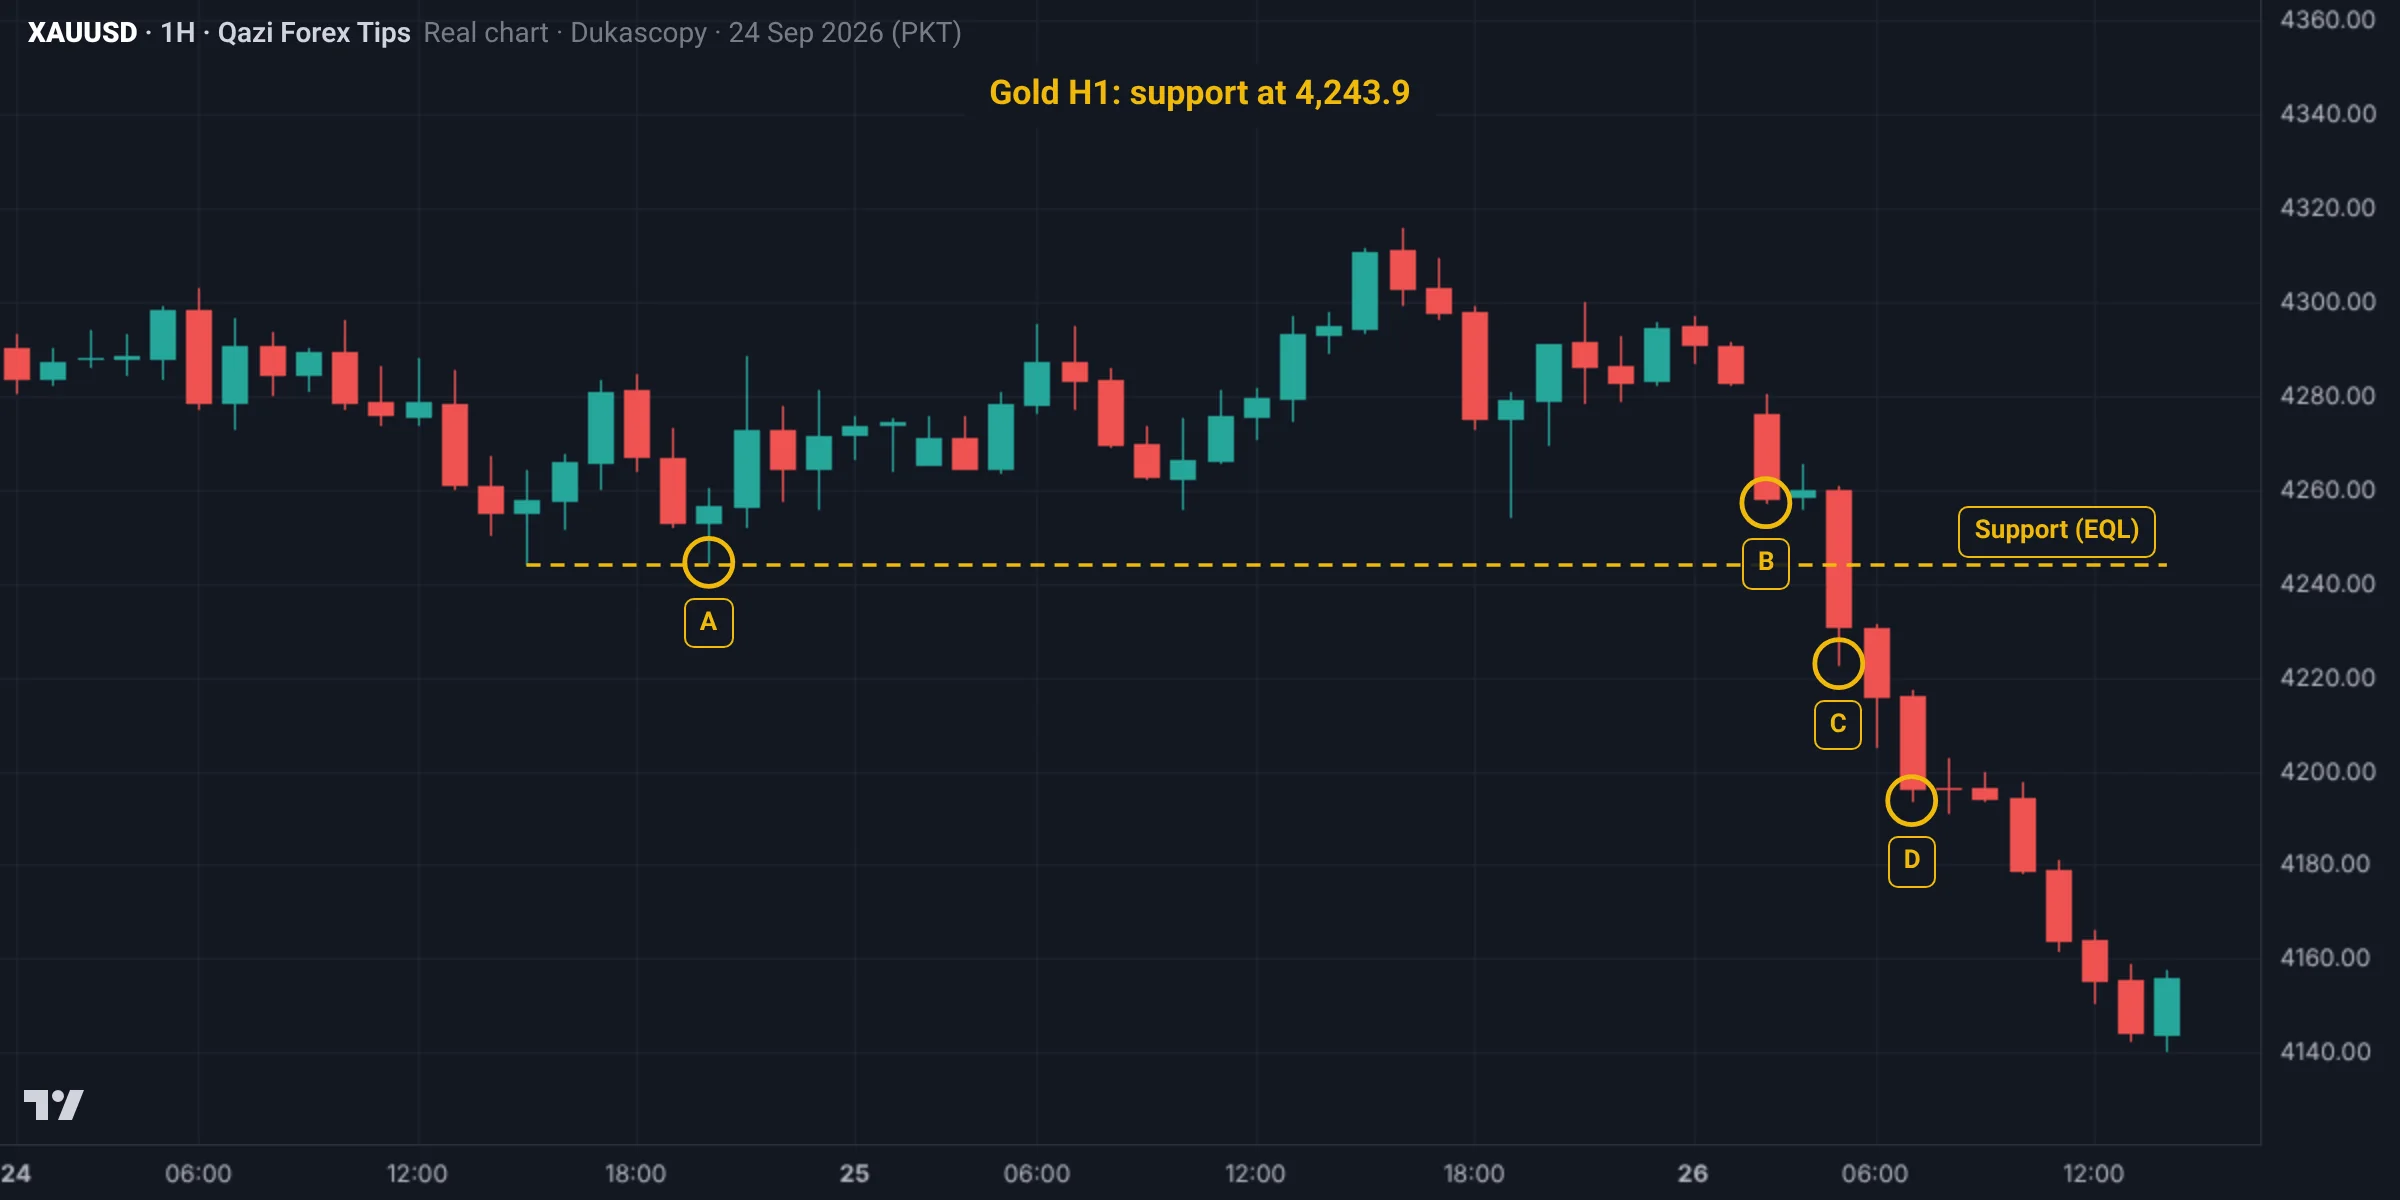
Which candle made the bearish BOS of the 4,243.9 support?
C (05:00 on 28 Sep) closed its body at 4,230.8, below support: that is the BOS. A only touched the level, B was a big red candle but closed at 4,258.4, above the level, and D came later.
The marked chart
Test yourself: Lesson 1.2 quiz
9 questions. Pick one answer for each and you will see at once whether it is right and why. Your score and grade appear at the end. You need 70% to pass.
0 correct · 0 / 9
Question 1What is a BOS?
In a bullish BOS the previous HH breaks; in a bearish BOS the previous LL.
Question 2What is the key condition for a BOS?
If only the wick went beyond and the body closed back inside, it is not a BOS; it is often a sweep.
Question 3The last HH is 4,152.40. In London a candle reaches 4,156.10 but closes at 4,150.80. What is it?
The body closed below the high, so the higher price was not accepted.
Question 4How do you draw a BOS line?
An M15 BOS and an H4 BOS are not the same, so write the timeframe.
Question 5Which of these is NOT a benefit of a BOS?
A BOS confirms the trend is alive; it guarantees nothing about the next candle.
Question 6Why do traders who jump on the first pullback after a BOS often get trapped?
The first small pullback after a BOS is often inducement (lesson 1.6).
Question 7Which is a sign of a strong BOS?
The origin of a strong BOS (order block or FVG) makes a good POI.
Question 8After a BOS, which is the new important low?
In the Gold example the BOS move began at 4,144.50, so that is the new important low.
Question 9Why is chasing the BOS candle wrong?
Chasing the BOS candle makes the SL large and the RR poor.
Lesson checklist
Tick each point once you understand it. Your ticks are saved in this browser.
Assignment
- Find 20 BOS on the Gold H1 chart: 10 bullish and 10 bearish, and draw each line to the breaking candle.
- Find 5 places where a wick broke a high or low but the body closed back inside, and write where price went next.
- For each BOS, note whether the breaking candle was a momentum candle or a weak one.
- Post your cleanest BOS and your most confusing case in the group.
- Mark 10 BOS on Gold H1 and label each strong or weak, with the reason.
- Find 3 places where only a wick went above a high and no BOS formed; see what price did next.
Post your assignment screenshots with your reasons in our free Facebook group, where your charts will be checked.
Join the free group
Who wrote this lesson
Dr. Qazi Abdul Basit, Ph.D
Ph.D in Business Administration and a forex and Gold trader since 2013. Founder of Qazi Forex Tips, which teaches traders in Pakistan and India price action, risk management and trading psychology in their own language: 65 student batches so far, free courses on YouTube, and MT5 tools for traders (QFT Replay Simulator, QFT Trade Assistant).
- 2013 trading since
- 75K+ Facebook group members
- 65 student batches
- 15K+ YouTube subscribers
How this lesson was made: the content follows Dr. Qazi's teaching method and years of trading. Real charts are built from Dukascopy Gold (XAUUSD) data, and backtest results are shown as they came out, even when negative. We do not sell signals, manage accounts or take money from any broker. Last updated: 19 November 2026.
Questions
What is a break of structure (BOS)?
A candle body closing beyond the previous swing high in an uptrend, or the previous swing low in a downtrend, confirming the trend continues.
Does a wick count as a BOS?
No. A wick beyond the level with the body closing back inside is usually a liquidity sweep.
Where should the BOS line end?
At the candle whose body closed beyond the broken swing.
What is the difference between BOS and CHoCH?
BOS breaks structure in the direction of the trend; CHoCH is the first break against it.
Should I enter right after a BOS?
No. Wait for a pullback to a valid POI; the first pullback is often inducement.
Is a BOS with momentum more reliable?
Yes. A BOS made with displacement candles is more likely to hold than a slow, weak break.
What is BOS and CHoCH in trading?
BOS (break of structure) is a body close through the previous swing in the trend direction: the trend continues. CHoCH (change of character) is the first such break against the trend: the first sign of a reversal.
Is there a BOS and CHoCH strategy?
Yes: take the direction from a higher timeframe BOS, wait for price to reach a POI in that direction, then enter on a lower timeframe CHoCH. That is model B (lesson 5.3), with a stop loss and 1% risk.
How do you mark a BOS on a chart?
Draw a horizontal line from the previous swing high (uptrend) or swing low (downtrend) to the candle whose body first closed beyond it, and label it BOS there.
Read more
Education only, not financial advice. Trading forex, Gold and CFDs carries a high risk of loss. SMC concepts describe tendencies, not guarantees. Lesson 6 of 38.