 Qazi Forex Tips

What top-down means
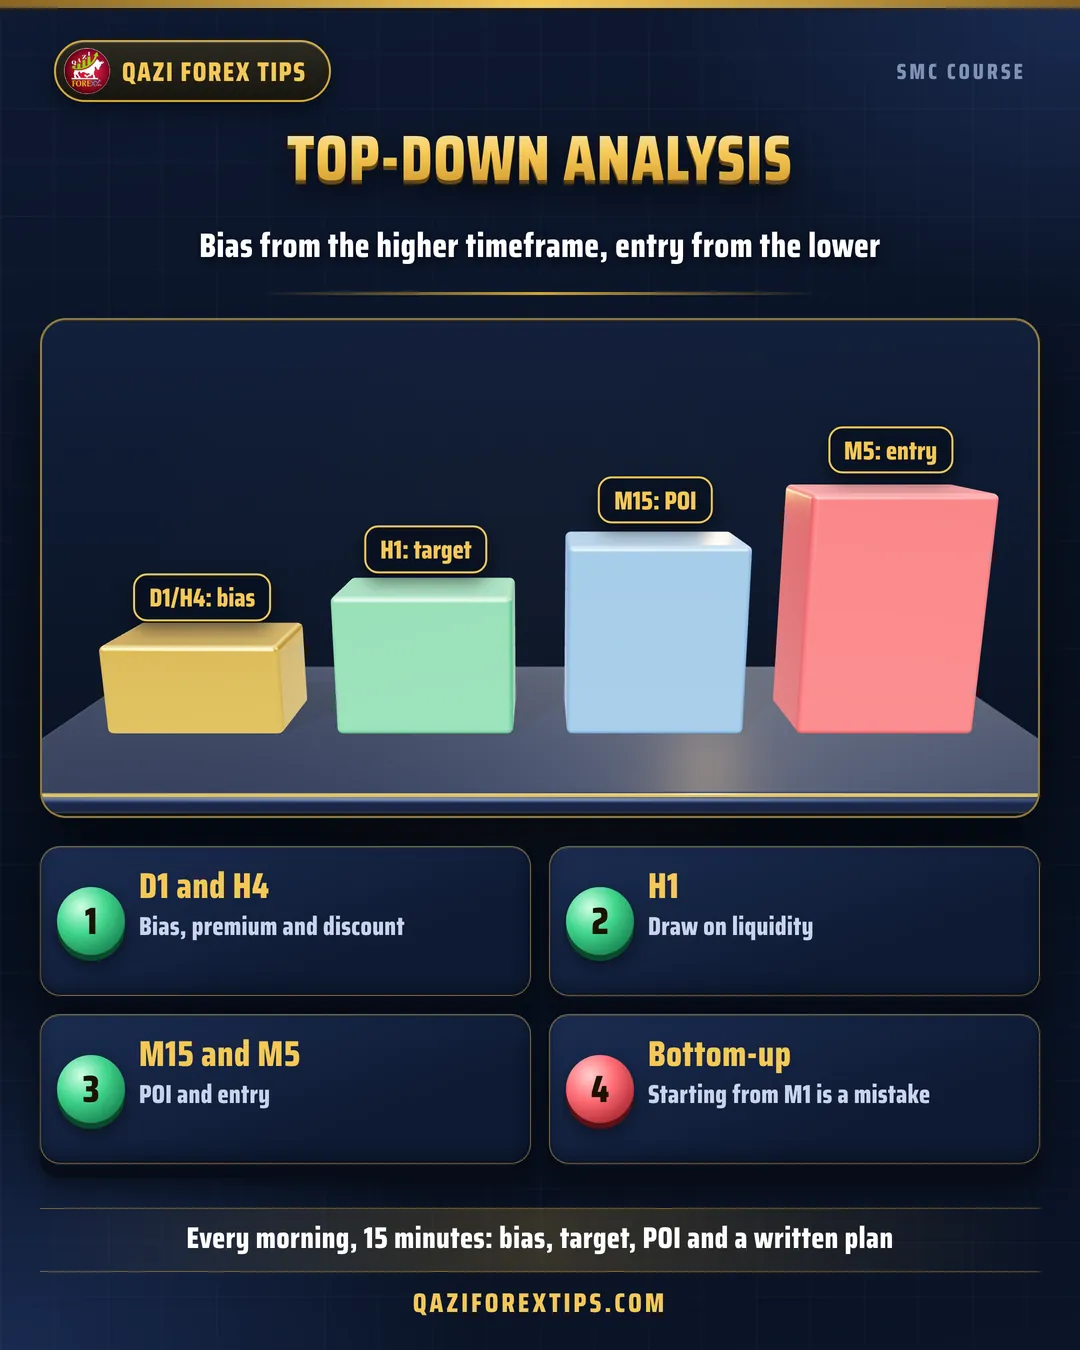
Top-down analysis means reading the chart from the top (higher timeframe) down (lower timeframe). The higher timeframe tells you what should happen; the lower timeframe tells you when. The opposite, taking a trade from M1 and then checking H4, is one of the most common beginner mistakes. M1 prints a new "signal" every few minutes, and most of them run against the higher timeframe.
Four levels
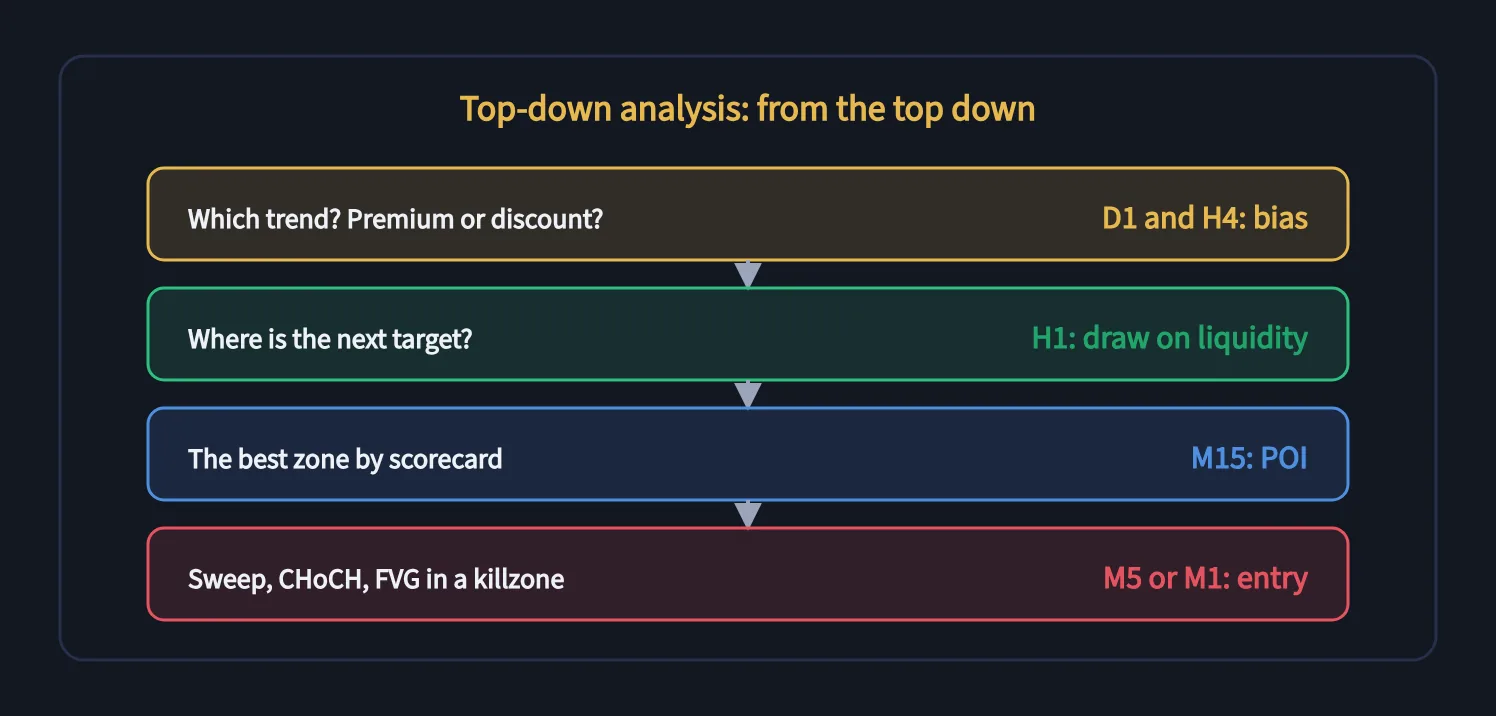
| Level | Timeframe | Question | Learned in |
|---|---|---|---|
| 1. Bias | D1 and H4 | Which way is the trend? Is price in premium or discount? | Phase 1, lesson 3.6 |
| 2. Target | H1 | Which draw on liquidity is next? | Phase 2 |
| 3. POI | M15 | What is the best zone in the bias direction? | Phase 3 |
| 4. Entry | M5 or M1 | Did a sweep, CHoCH and FVG form in a killzone? | Phases 4 and 5 |
For Gold this set (H4, H1, M15, M5) is the most balanced. Swing traders go one level up (W1, D1, H4, H1); scalpers one level down (H1, M15, M5, M1). Rule: each level is roughly 3 to 4 times smaller than the one above.
The 15-minute daily routine (at the New York midnight open)
- D1 (2 minutes): how did yesterday's candle close? Which way was the last BOS? Is price in daily premium or discount?
- H4 (3 minutes): bullish or bearish structure? Where is the protected high or low? Write one line: "Today's bias is bullish because..."
- H1 (3 minutes): mark PDH, PDL, the Asian high and low, equal highs or lows. The nearest clear liquidity in the bias direction is your target (DOL).
- M15 (5 minutes): find POIs in the bias direction and score them (lesson 3.7). Keep only 8 or more. Set alerts.
- Write the plan (2 minutes): "If price reaches this POI in the London killzone and an M5 CHoCH forms, buy, SL here, TP here. If H1 closes below this low, the bias is void."
Then close the chart and wait for the alert.
When timeframes disagree
| H4 | H1 | What to do |
|---|---|---|
| Bullish | Bullish | Best case: buys only |
| Bullish | Bearish (pullback) | Let the H1 pullback reach the H4 POI, then wait for an H1 or M15 CHoCH |
| Bearish | Bullish (pullback) | Let the pullback reach the H4 premium POI, then sell |
| Range | Anything | Trade only the range edges, or sit out |
Core rule: a lower timeframe moving against the higher one is a pullback, not a trend. Enter when the lower timeframe turns back in the higher timeframe's direction.
Gold example
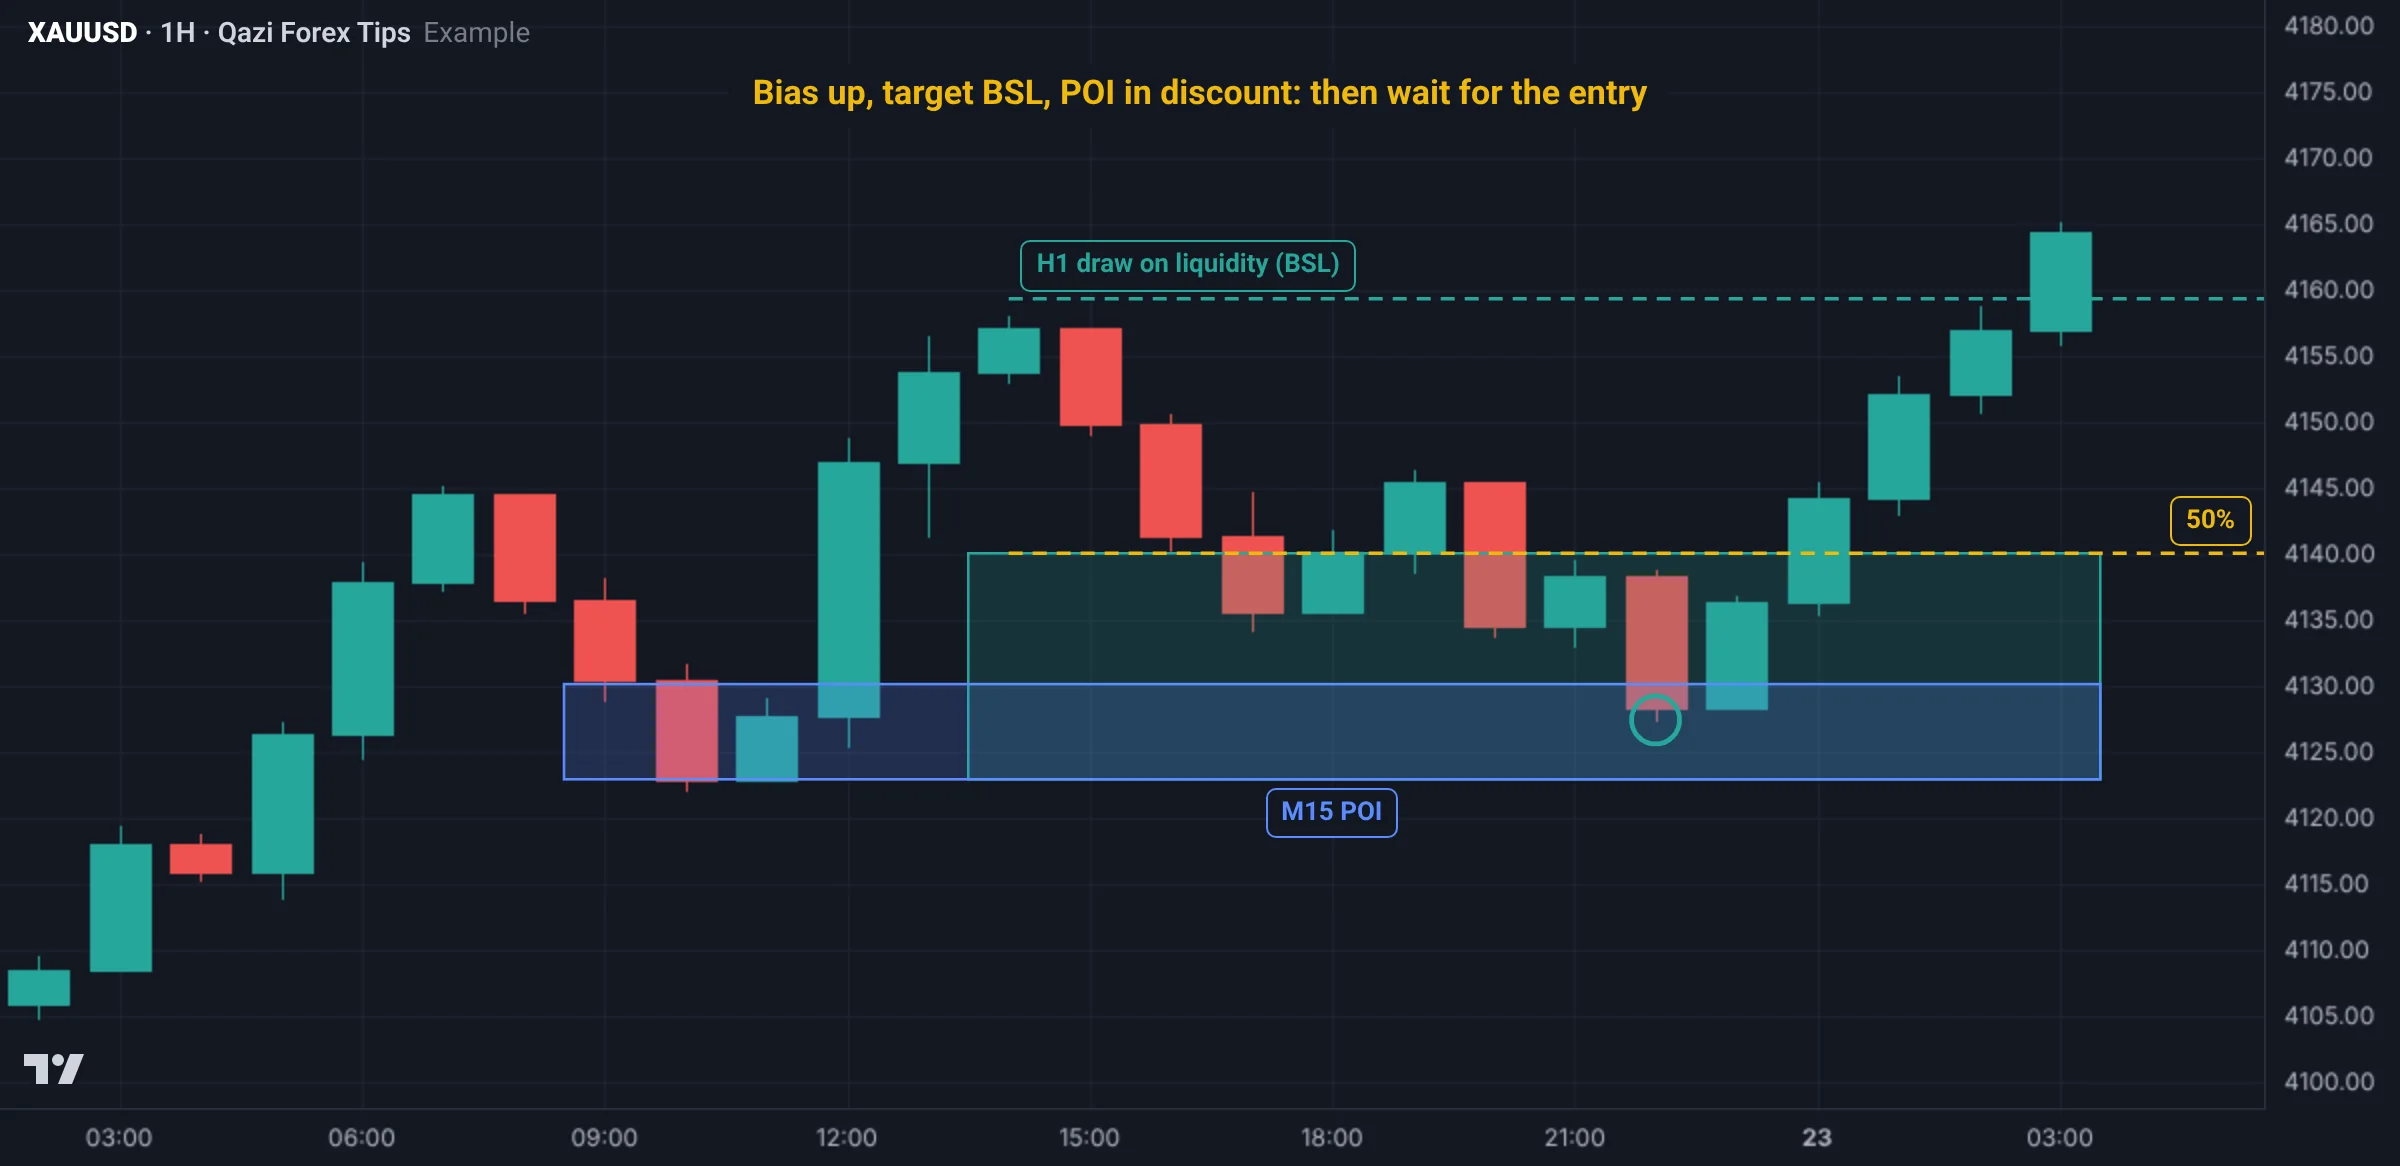
Monday, winter, at the midnight open:
- D1: Friday closed bullish; last week's high at 4,152 is still untaken.
- H4: HHs and HLs continue, protected low 4,096. Bias: bullish. Invalidation: an H4 close below 4,096.
- H1: the last leg ran 4,108 to 4,146, equilibrium 4,127. Target: 4,152 (last week's high, BSL).
- M15: a bullish order block and FVG at 4,112 to 4,118 in discount, after an IDM sweep. Score 9/10. Alert at 4,119.
- Plan: in the London killzone, if price enters the zone and an M5 CHoCH forms, buy with SL 4,108, TP1 4,146, TP2 4,152.
- Result: price reached 4,114, entry at 4,117 after an M5 CHoCH, risk $9. Price hit 4,152 in New York: about 1:3.9.
Real Gold chart examples
The real top-down plan for the morning of Monday 9 Nov 2026, on Gold H4 (data: Dukascopy, bid price; Pakistan time):
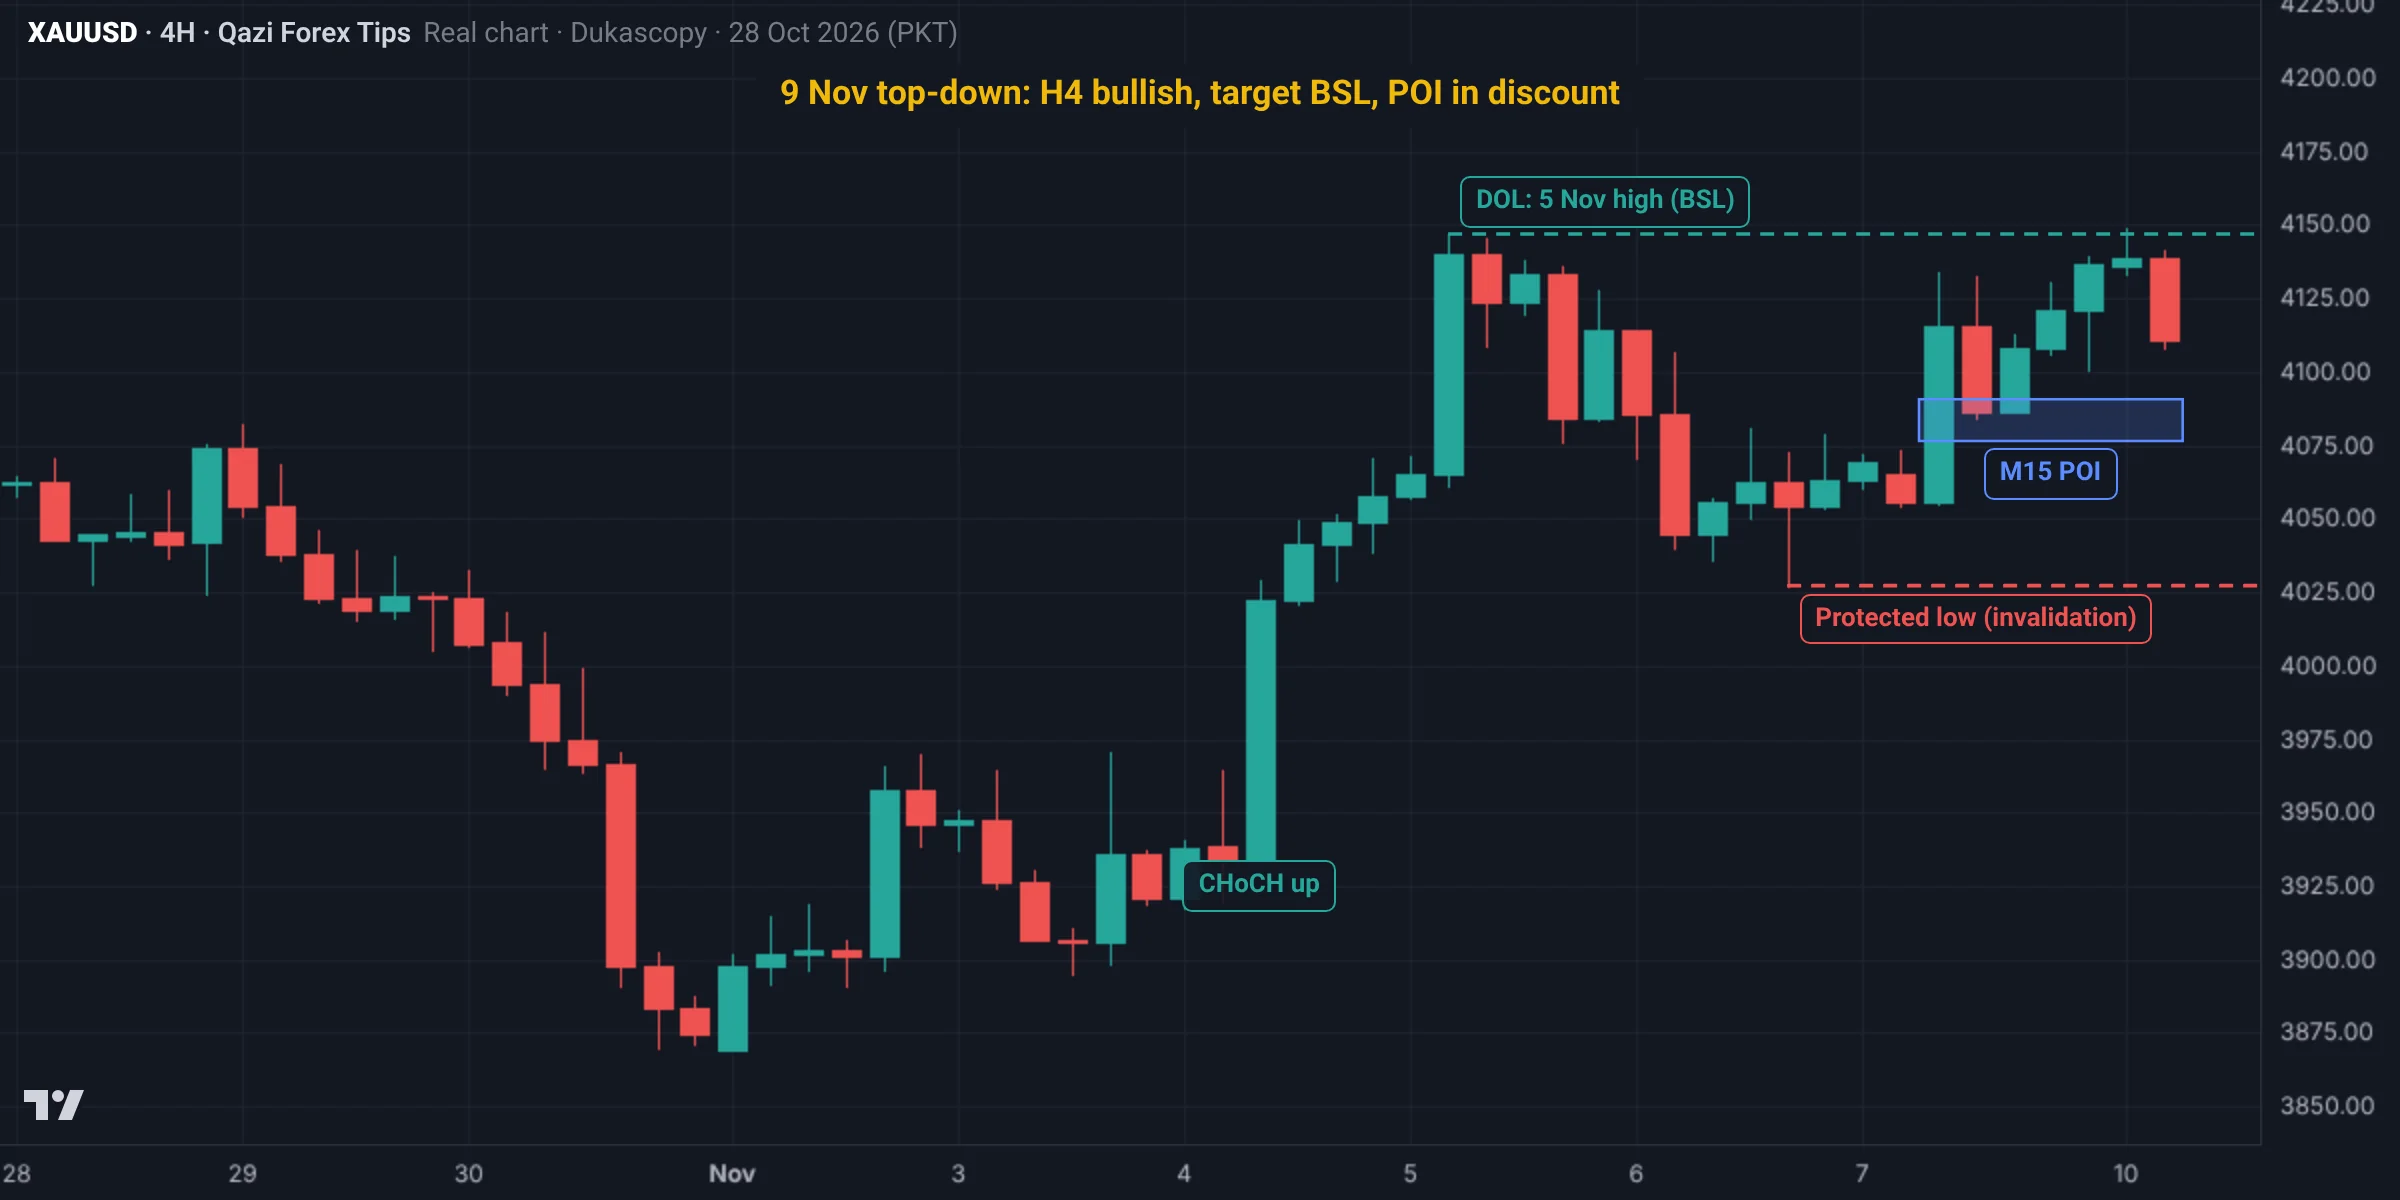
- H4 bias: structure shifted up on 4 Nov (CHoCH), an HH at 4,146.8 on 5 Nov and an HL at 4,027.2 on 6 Nov. Bias: bullish.
- Invalidation: an H4 close below 4,027.2 (the protected low).
- DOL: the BSL above the 5 Nov high at 4,146.8.
- M15 POI: the FVG of the morning leg (4,054.7 to 4,133.9) at 4,076.4 to 4,090.6, in discount (lessons 1.6 and 3.7 cover this day in detail).
- Result: price reached 4,084.5 at 12:45 and hit 4,148.6 at 01:00 on 10 Nov: DOL reached. Later that day the bias changed (lesson 1.3).
Second example: a bearish top-down (29 Oct)
The top-down plan on the morning of Thursday 29 Oct 2026, on Gold H4 (data: Dukascopy, bid price; Pakistan time). The first example was a bullish plan; this is a bearish plan:
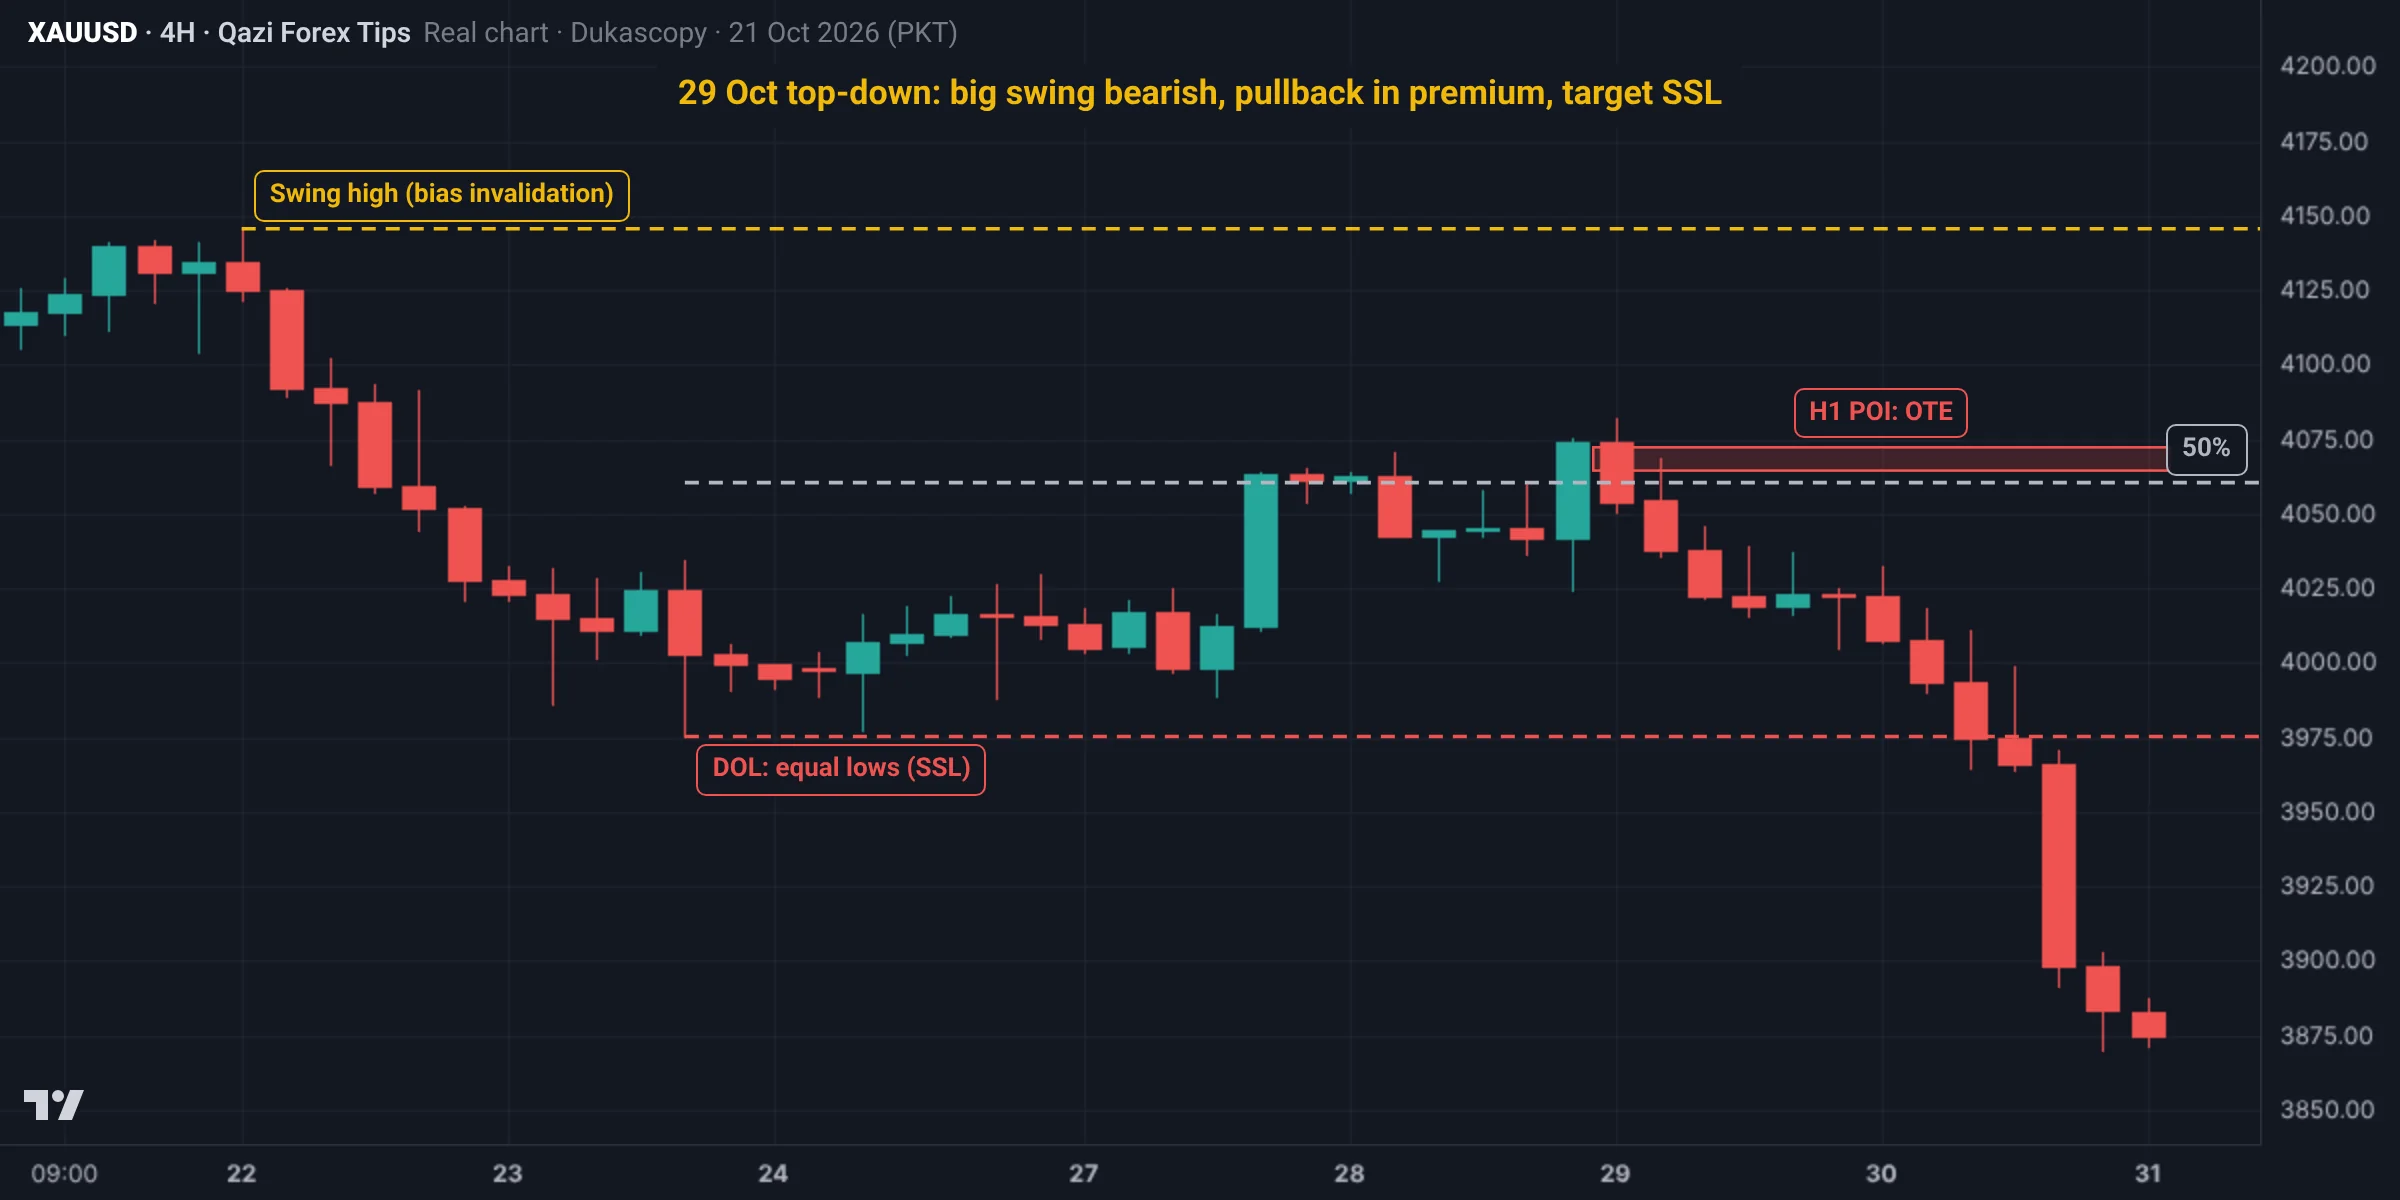
- The big swing: the top on 21-22 Oct at 4,145.6, then a sharp drop to 3,975.3 on 23 Oct: the swing structure is bearish. The 50% of that range is 4,060.5.
- To be honest: in the 26-29 Oct rally the H4 internal structure had turned up (new highs). But price was in the premium of the big range and below the swing high at 4,145.6: a pullback in the bigger downtrend (lessons 1.4 and 1.7). That makes this a B plan, not an easy one.
- DOL: the near-equal lows of 23 and 26 Oct, 3,975.3 and 3,977.8: SSL below.
- Invalidation: for the bias, an H4 close above 4,145.6; the trade's stop is much closer.
- H1 POI: the OTE of the range from the 01:00 high at 4,082.0 to the 05:00 low at 4,036.1: 4,064.5 to 4,072.3 (the second example in lesson 3.6).
- M15 entry: at 06:15 price reached 4,068.6 inside the OTE; at 07:15 an M15 candle closed below the last HL at 4,052.4 (CHoCH); at 07:45 a sell in its FVG at 4,048.9, SL 4,070.1.
- Result: the DOL at 3,975.3 was reached on 30 Oct 2026 at 12:45, about +3.5R, and the stop was not hit.
Common mistakes
Summary
- The higher timeframe says what, the lower says when.
- For Gold: H4 bias, H1 target, M15 POI, M5 entry.
- 15 minutes every morning: bias, DOL, POI and a written plan with invalidation.
- A lower timeframe against the higher one is a pullback.
Free downloads
Print them or keep them on your phone. No sign-up, no email.
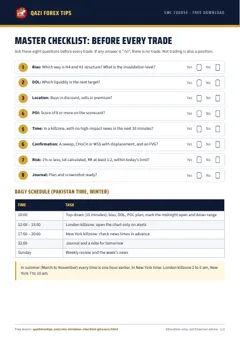
Master Checklist and 15 Mistakes
Eight questions before every trade, a daily schedule in Pakistan time and the 15 common mistakes. PDF, 2 pages.
Free downloadاردو میںSpot it on the chart: practice
This is a real Gold chart (Dukascopy data, Pakistan time). Study it and pick an answer. After you answer, the fully marked chart and the explanation appear.
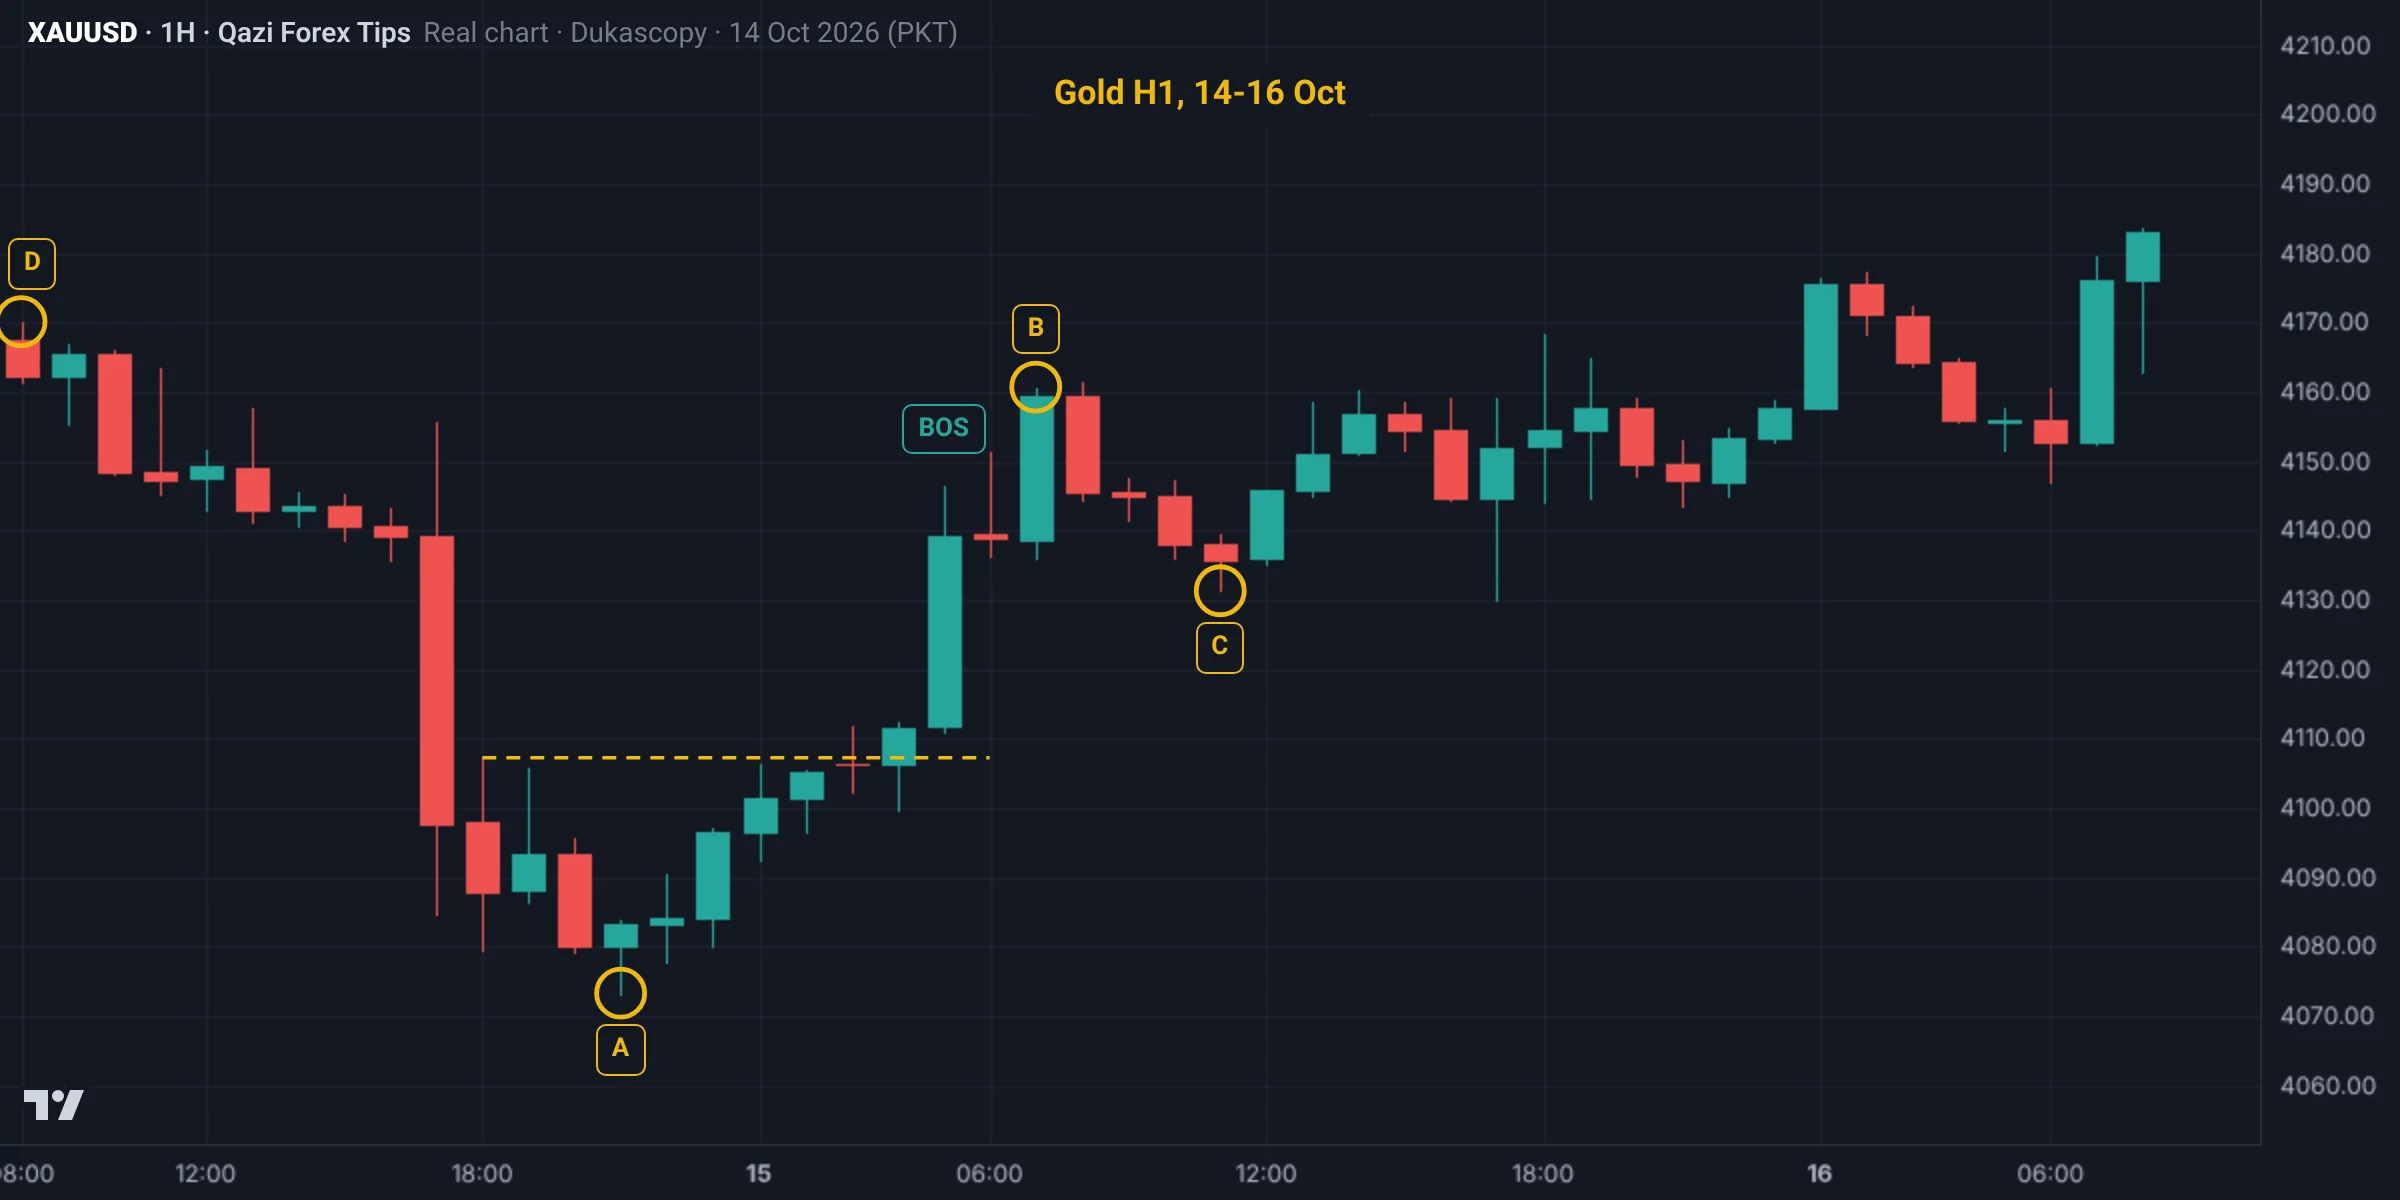
After the BOS at 05:00 on 15 Oct the bias is bullish. At which level do you write the invalidation (the level whose break proves the bias wrong)?
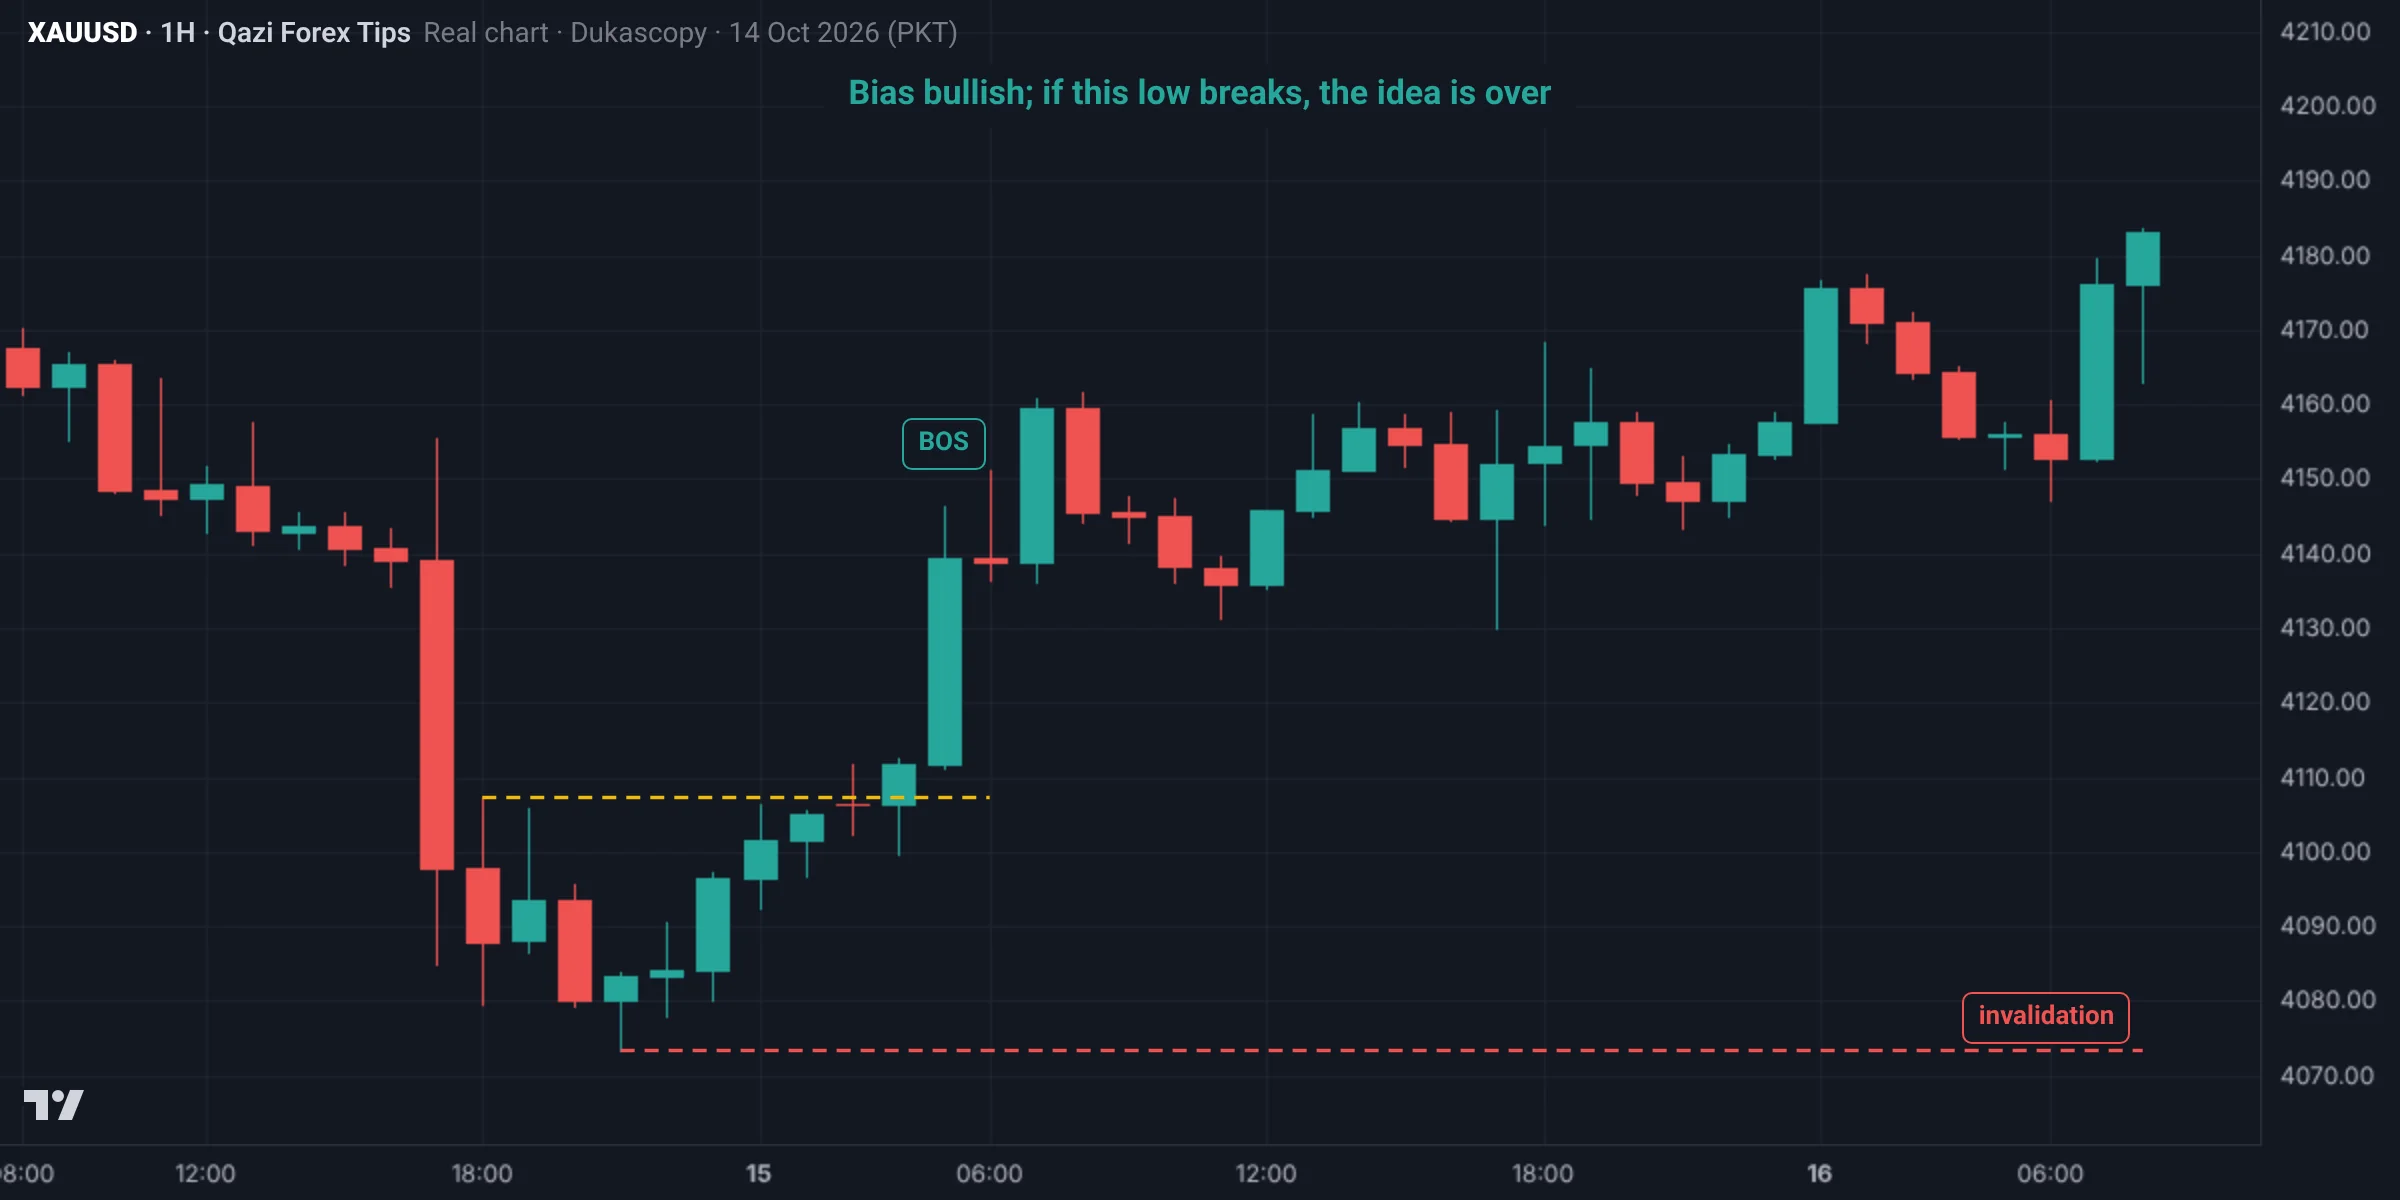
A (4,073.3) is the low where the BOS move began: the protected low. An H1 close below it ends the bullish idea. B is a high, C only a pullback low (its break does not change the trend), and D a high from the old downtrend.
The marked chart
Test yourself: Lesson 5.1 quiz
9 questions. Pick one answer for each and you will see at once whether it is right and why. Your score and grade appear at the end. You need 70% to pass.
0 correct · 0 / 9
Question 1In top-down analysis, what does the higher timeframe tell you and what does the lower one tell you?
Doing it the other way (an M1 trade, then checking H4) is a common beginner mistake.
Question 2Which timeframe set is the most balanced for Gold?
Swing traders go one level up, scalpers one down; each level is roughly 3 to 4 times smaller than the one above.
Question 3In the four levels, which question does H1 answer?
D1/H4 bias, H1 target, M15 POI, M5/M1 entry.
Question 4When is the 15-minute daily routine done?
That is 10 am in Pakistan in winter.
Question 5Why must you always write an invalidation in your plan?
Example: if H1 closes below this low, the bias is void.
Question 6H4 is bullish and H1 bearish (a pullback). What do you do?
A lower timeframe moving against the higher one is a pullback, not a trend.
Question 7When you score POIs on M15, which do you keep?
Then close the chart and wait for the alert.
Question 8Gold example: H4 protected low 4,096, entry 4,117, SL 4,108, target 4,152. What was the RR?
9 dollars of risk for 35. Invalidation: an H4 close below 4,096.
Question 9What about changing bias on every M1 candle during a trade?
A trade without a written plan is usually emotional.
Lesson checklist
Tick each point once you understand it. Your ticks are saved in this browser.
Assignment
- Do the 15-minute top-down every morning for the next 5 days and write a plan.
- In the evening check: was the bias right? Did price reach the DOL? Did the POI react?
- Save D1, H4, H1 and M15 screenshots each day.
- Count how many days produced a trade according to plan.
- Post one day plan in the group.
Post your assignment screenshots with your reasons in our free Facebook group, where your charts will be checked.
Join the free group
Who wrote this lesson
Dr. Qazi Abdul Basit, Ph.D
Ph.D in Business Administration and a forex and Gold trader since 2013. Founder of Qazi Forex Tips, which teaches traders in Pakistan and India price action, risk management and trading psychology in their own language: 65 student batches so far, free courses on YouTube, and MT5 tools for traders (QFT Replay Simulator, QFT Trade Assistant).
- 2013 trading since
- 75K+ Facebook group members
- 65 student batches
- 15K+ YouTube subscribers
How this lesson was made: the content follows Dr. Qazi's teaching method and years of trading. Real charts are built from Dukascopy Gold (XAUUSD) data, and backtest results are shown as they came out, even when negative. We do not sell signals, manage accounts or take money from any broker. Last updated: 19 November 2026.
Questions
What is top-down analysis?
Taking bias from the higher timeframe, the target and POI from a middle timeframe, and the entry from a lower timeframe.
Which timeframes are best for Gold?
For intraday H4, H1, M15 and M5; for swing trading D1, H4 and H1.
What if H4 and H1 disagree?
Treat H1 as a pullback and wait for it to reach the H4 POI.
How do you do top-down analysis step by step?
First the bias and swing range on D1 or H4, then the DOL and POI on H1, then wait, and finally enter on confirmation on M15 or M5. Write each step's answer in one line.
How long should a top-down analysis take?
About 15 minutes a day, in the morning before the killzone. Changing your bias all day is a mistake; build the plan once, then set alerts and wait.
Read more
Education only, not financial advice. Trading forex, Gold and CFDs carries a high risk of loss. SMC concepts describe tendencies, not guarantees. Lesson 28 of 38.